-
-
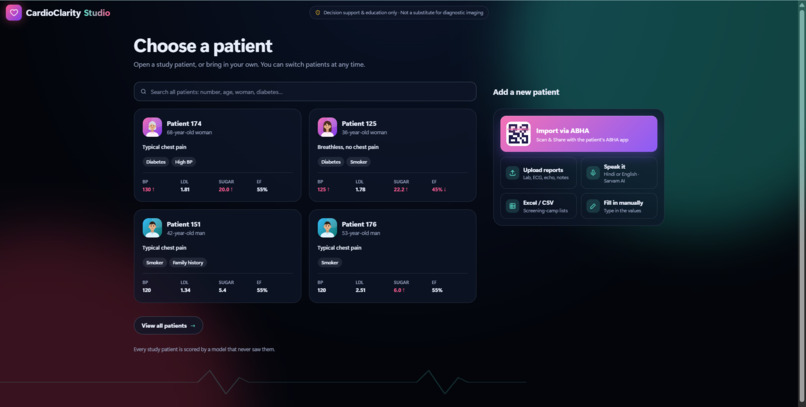
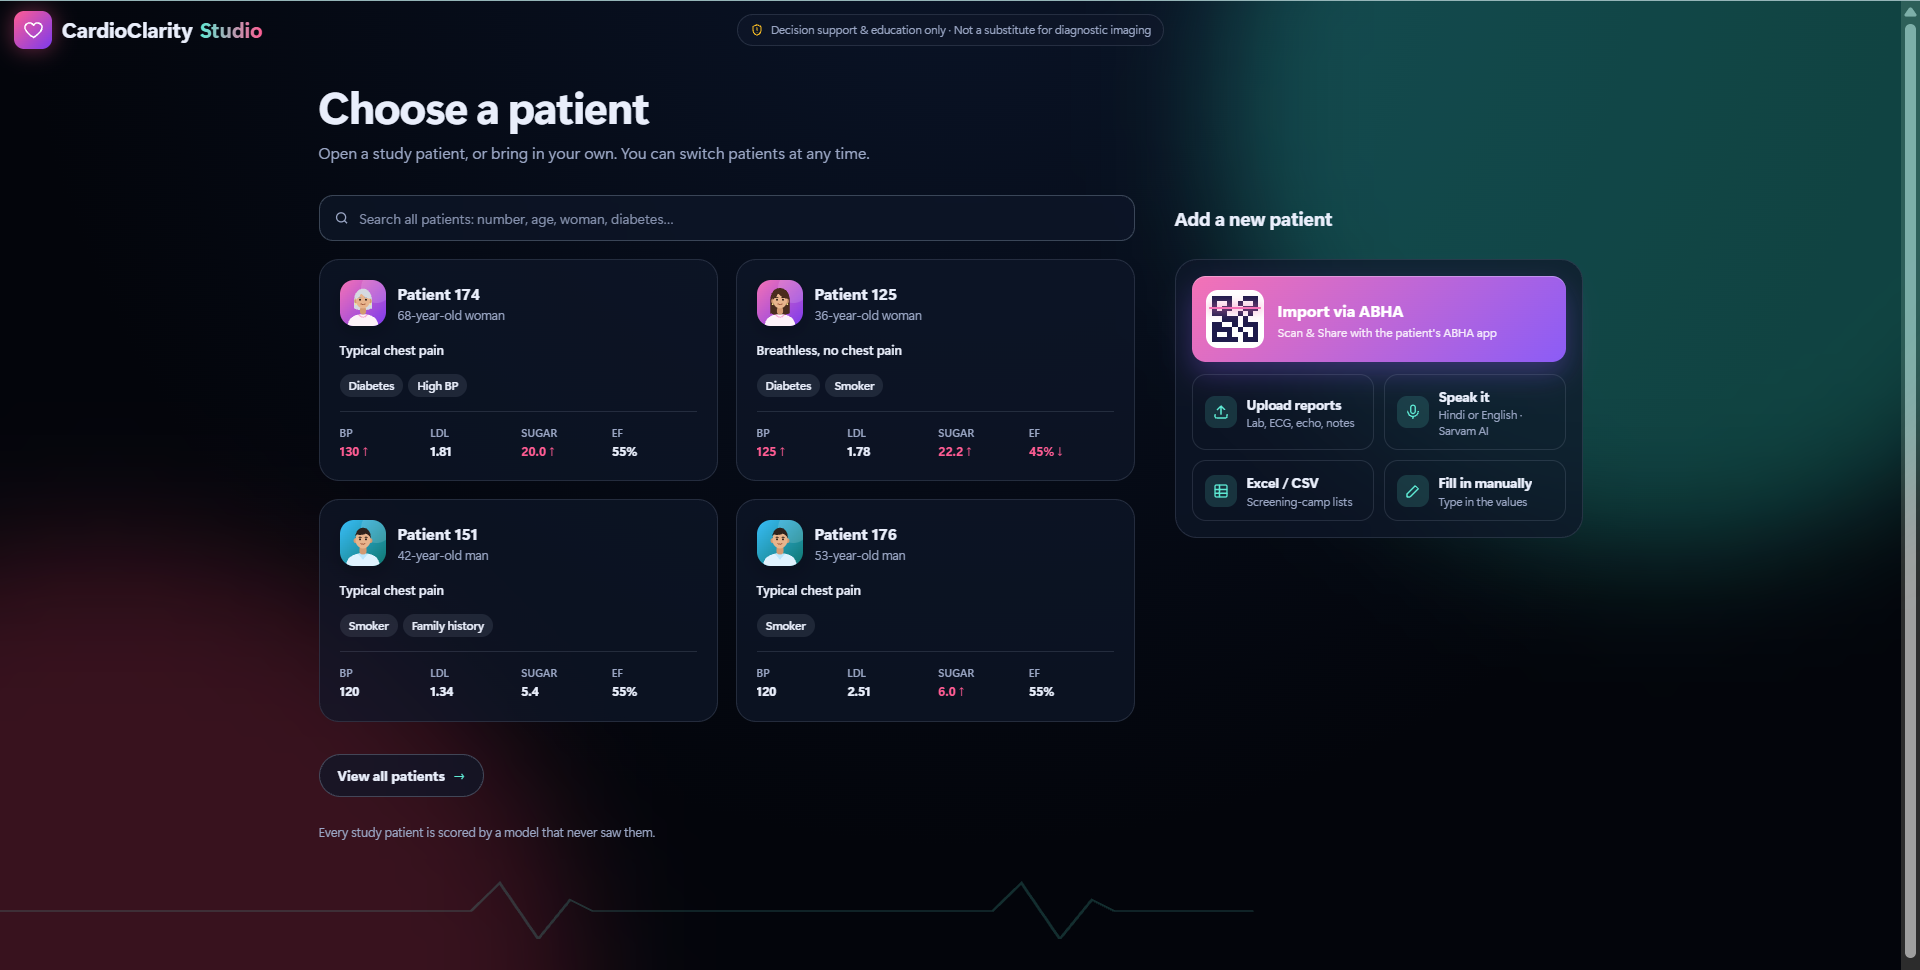
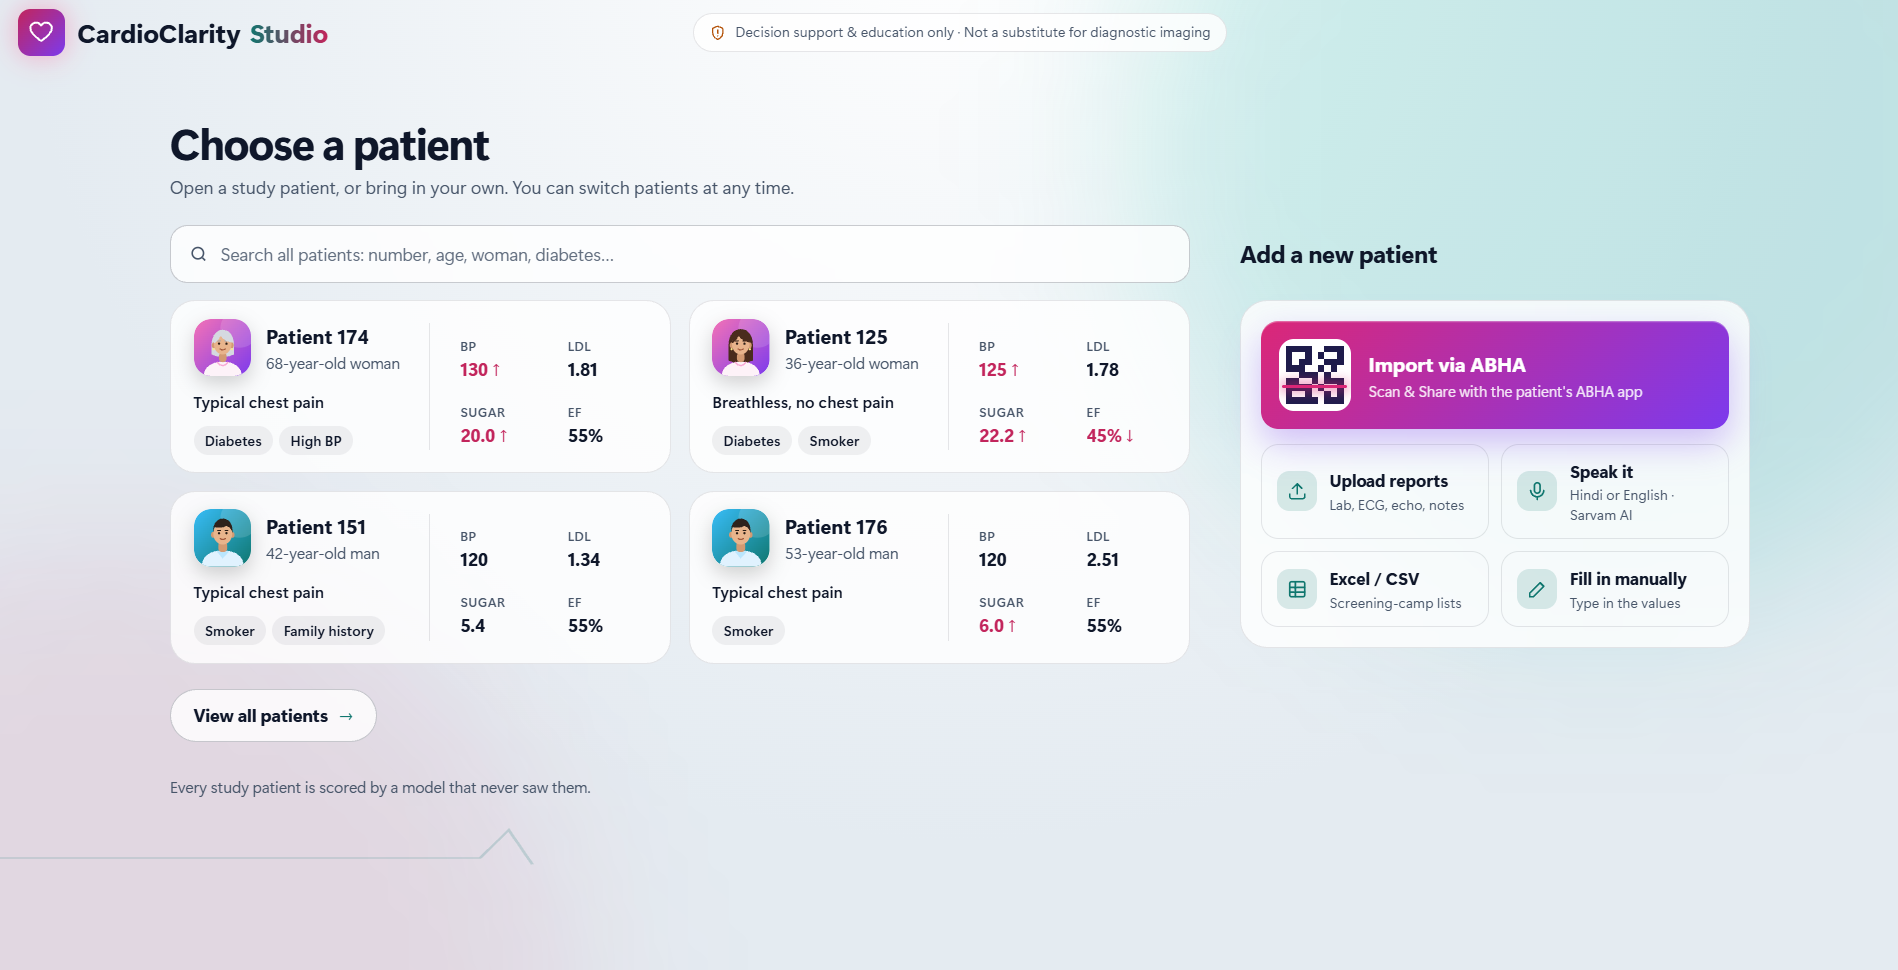
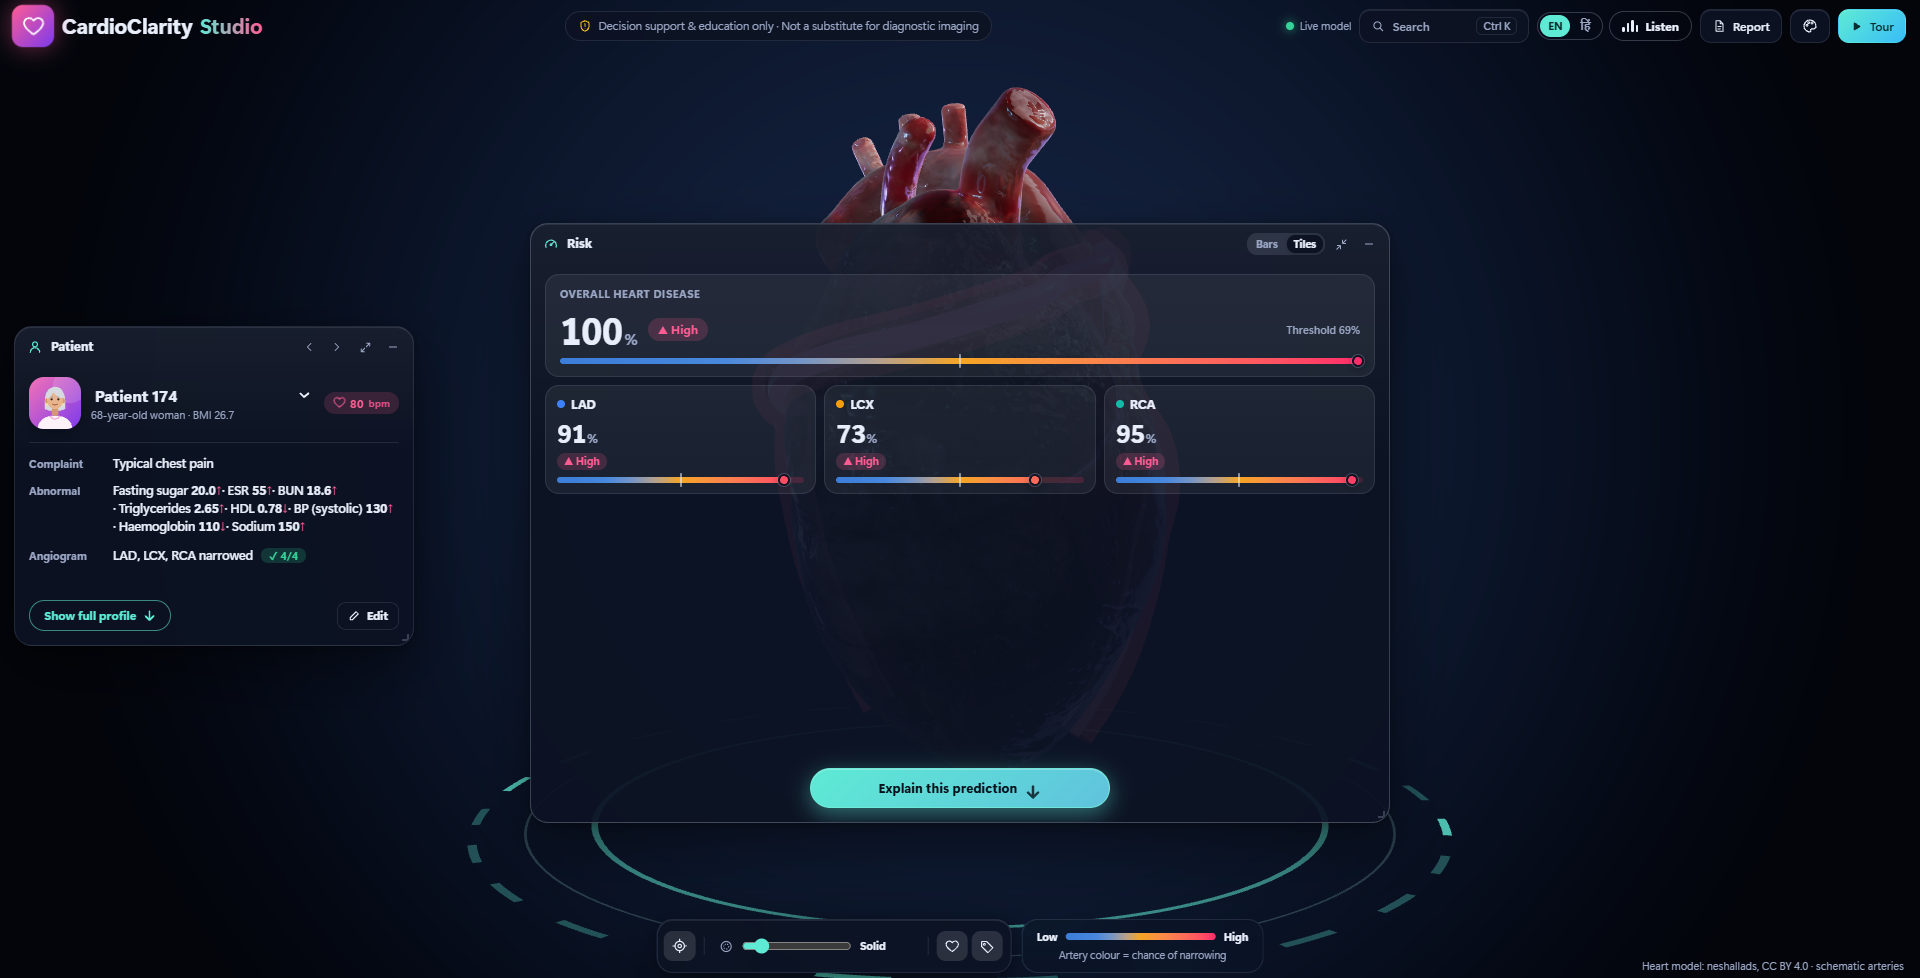
First screen - Choosing patient (Dark mode)
-
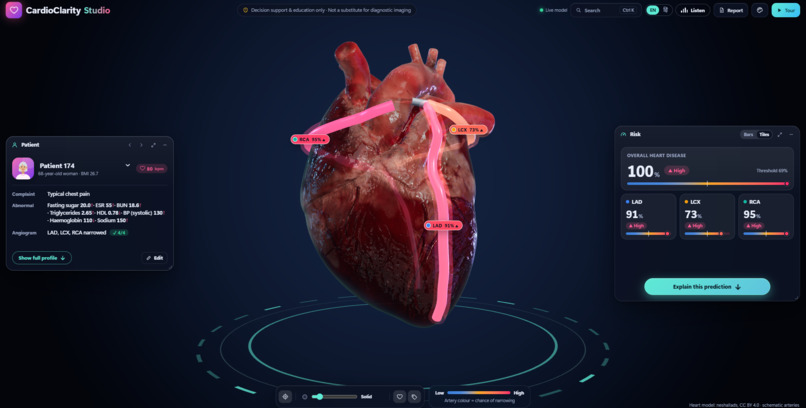
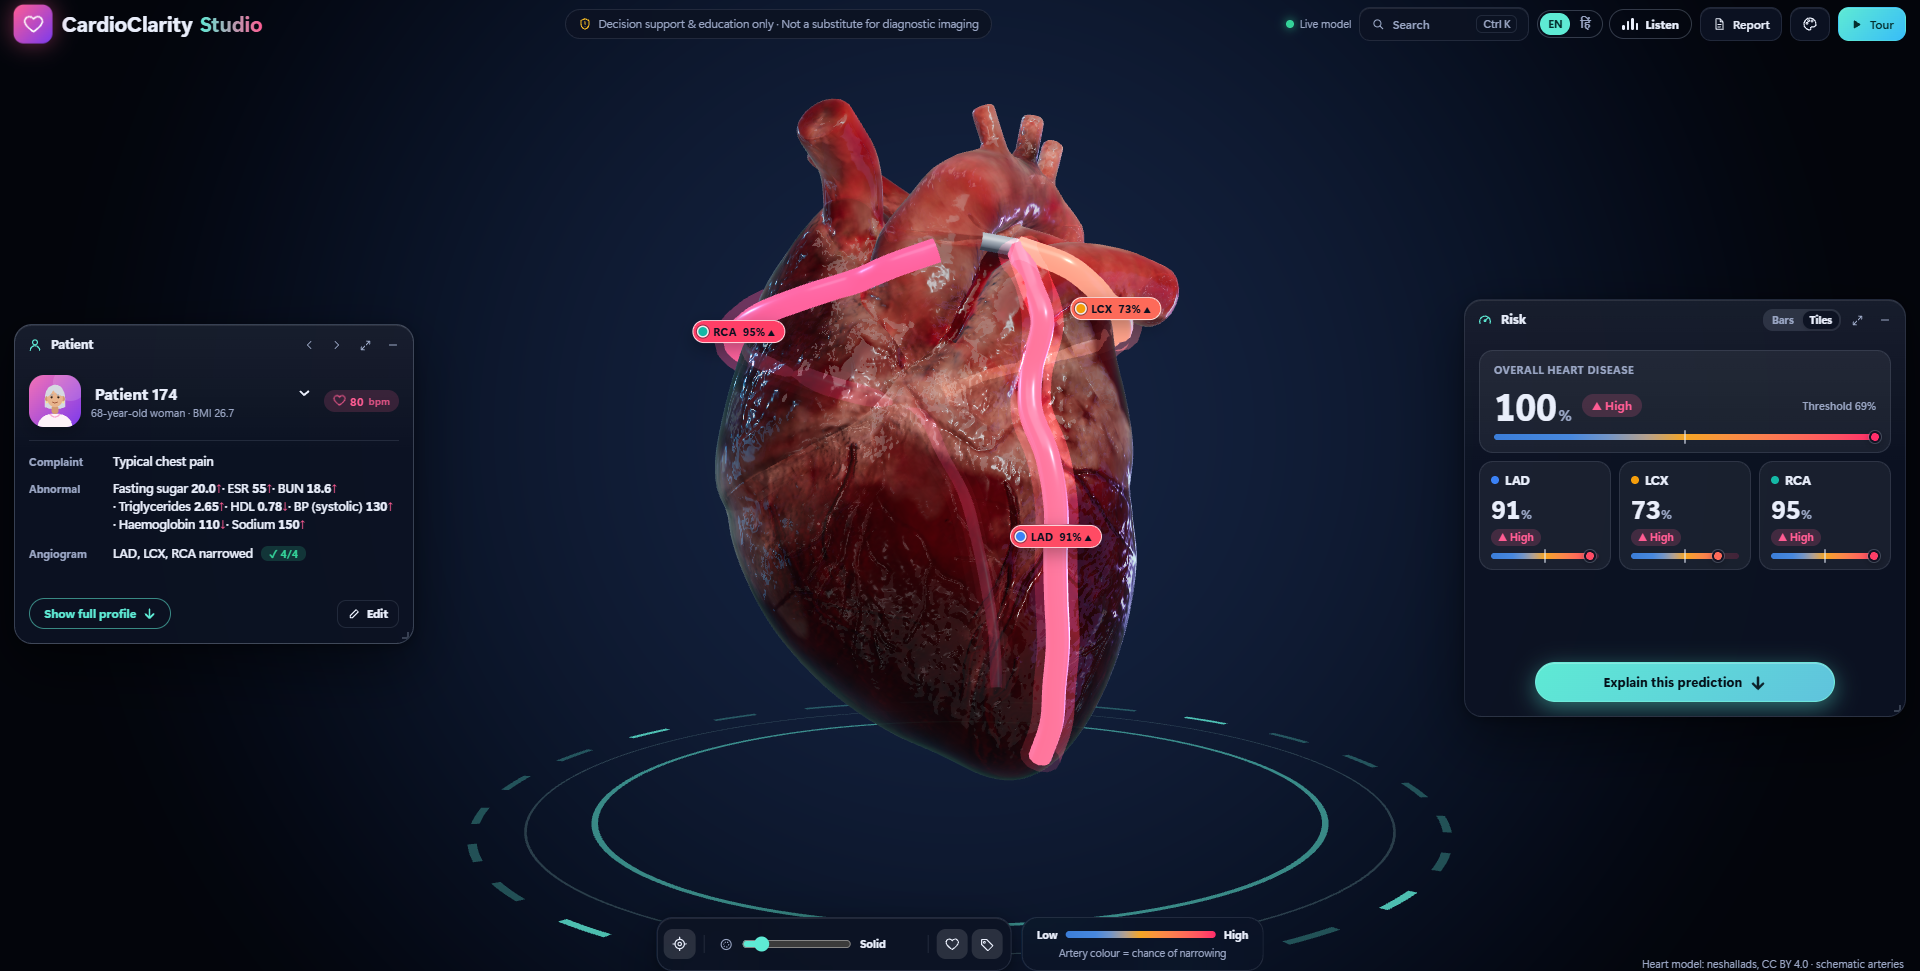
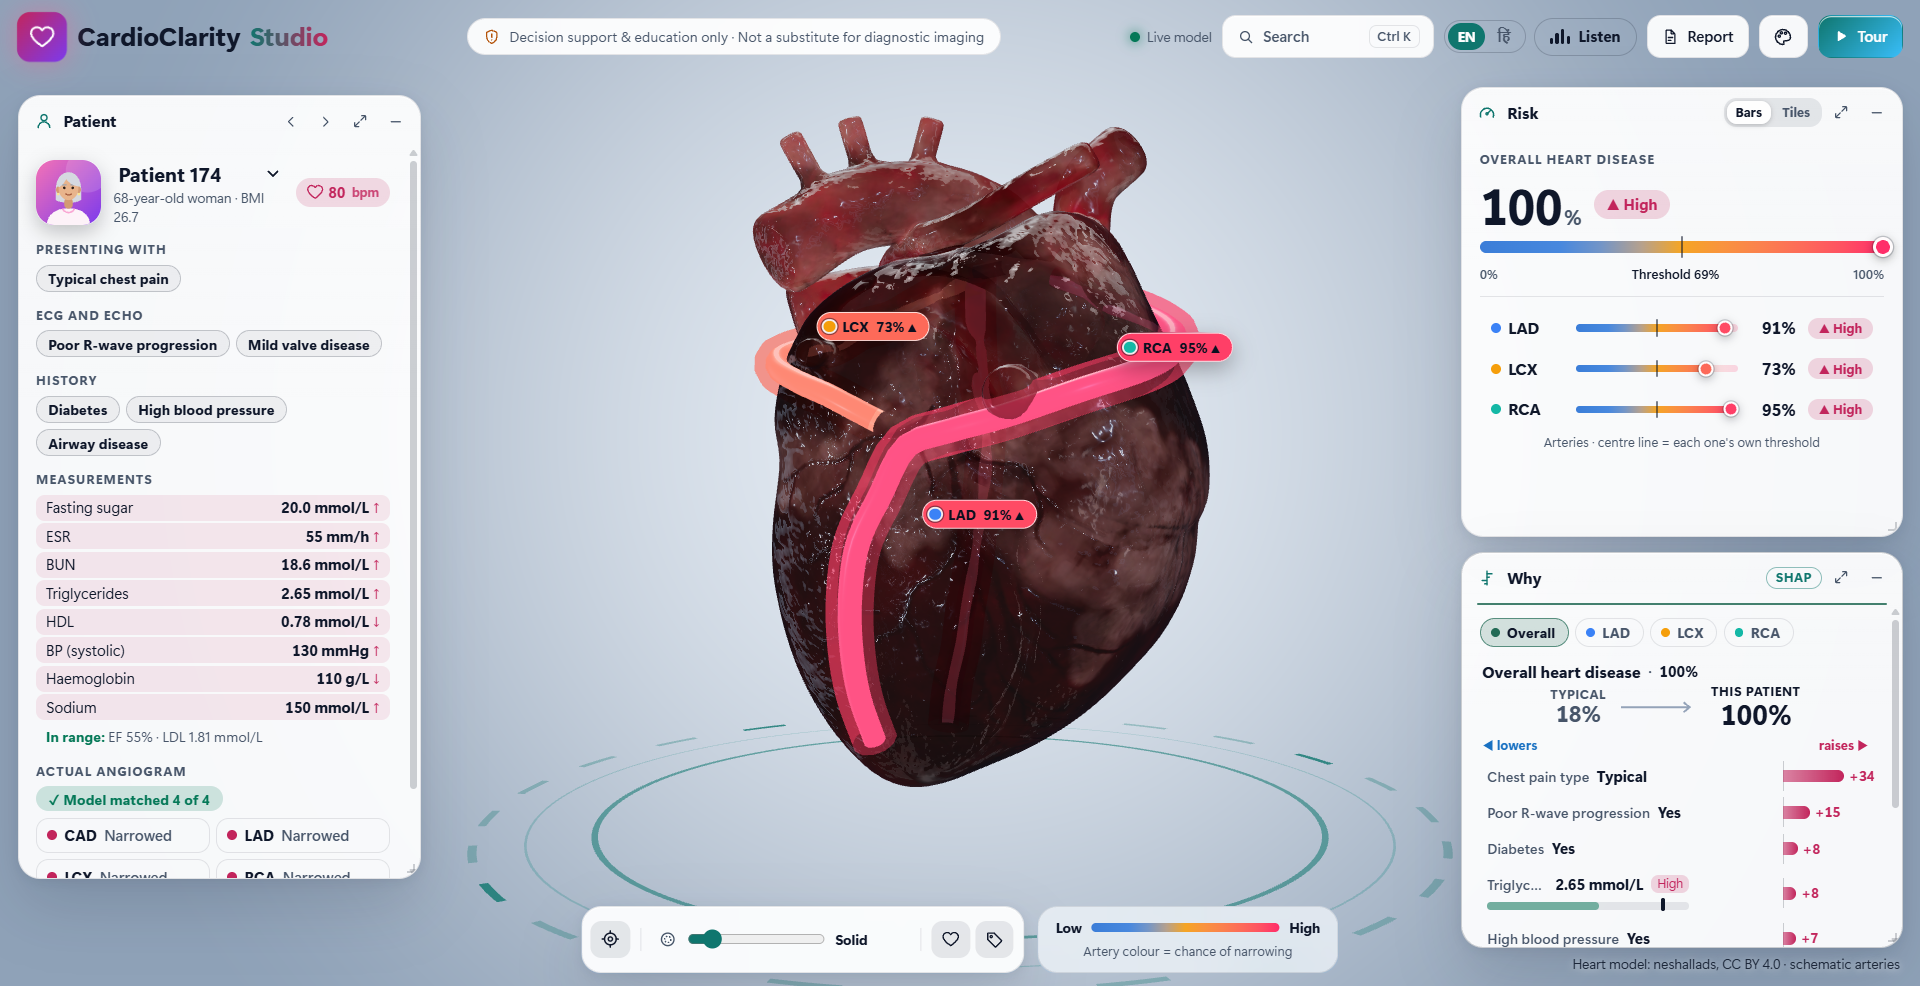
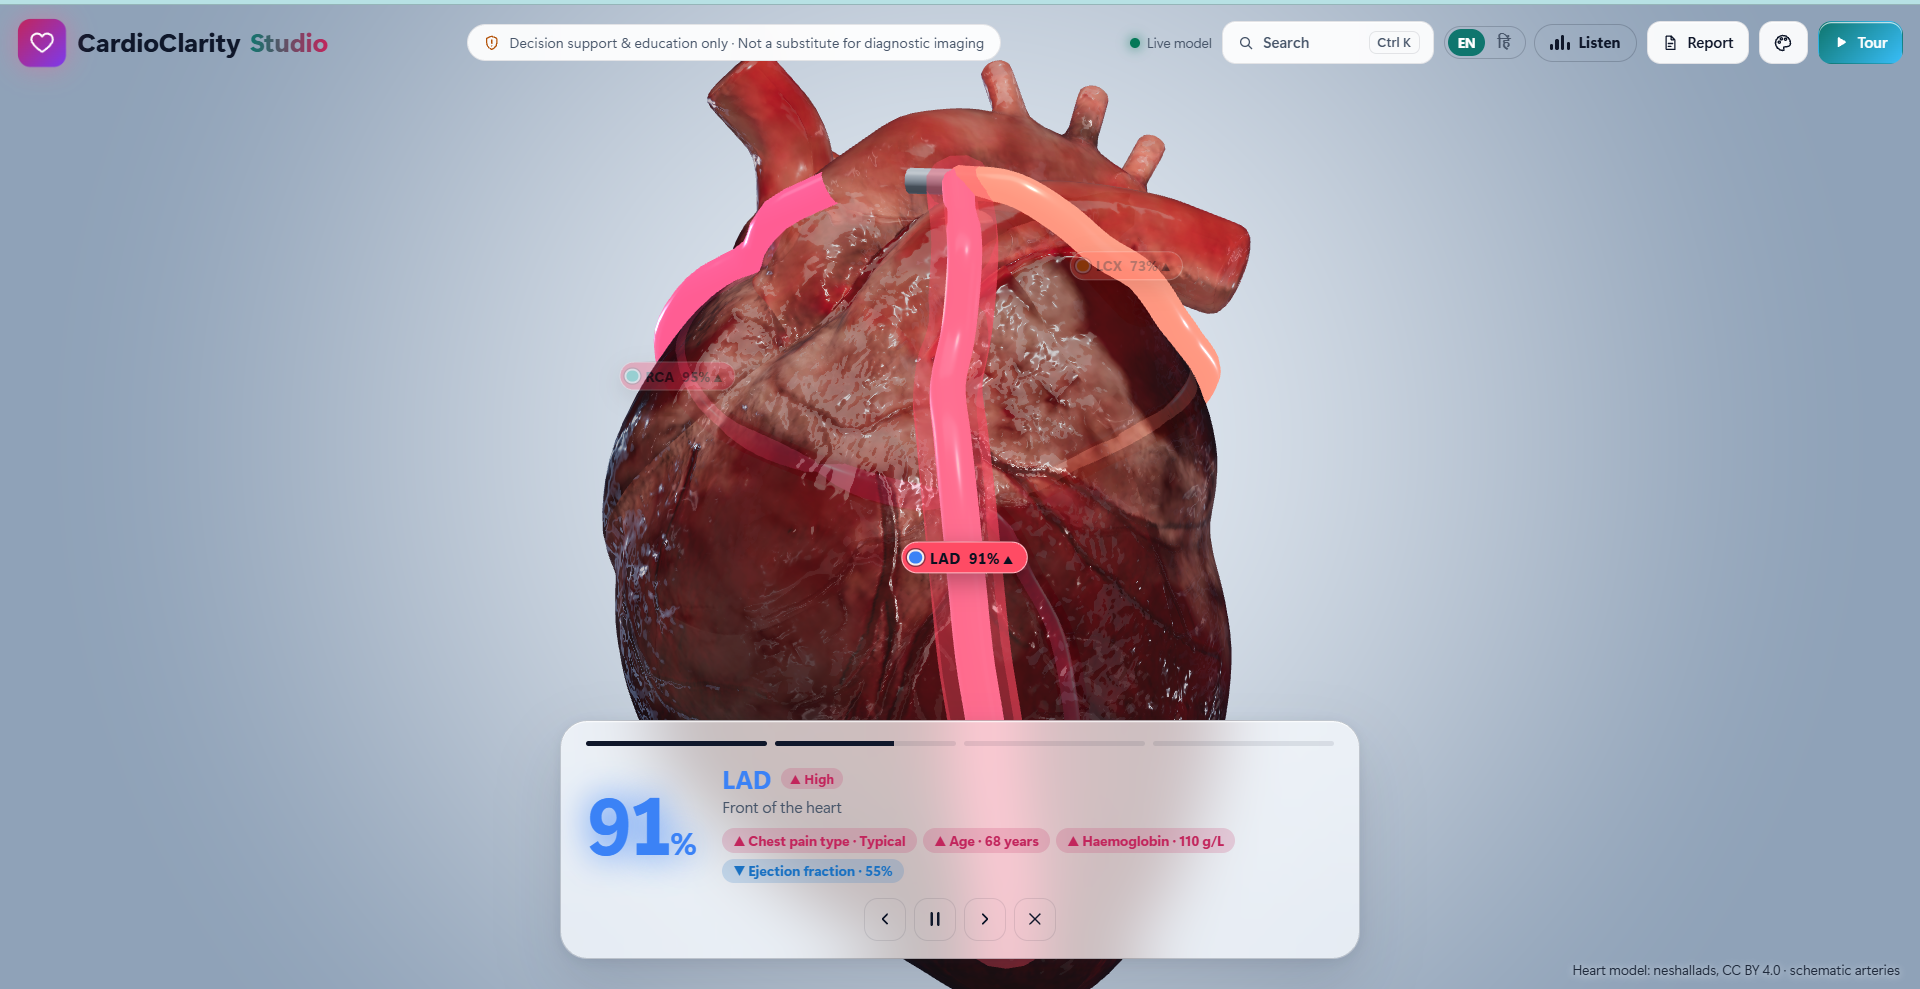
Heart 3D visualization(Dark Mode)
-
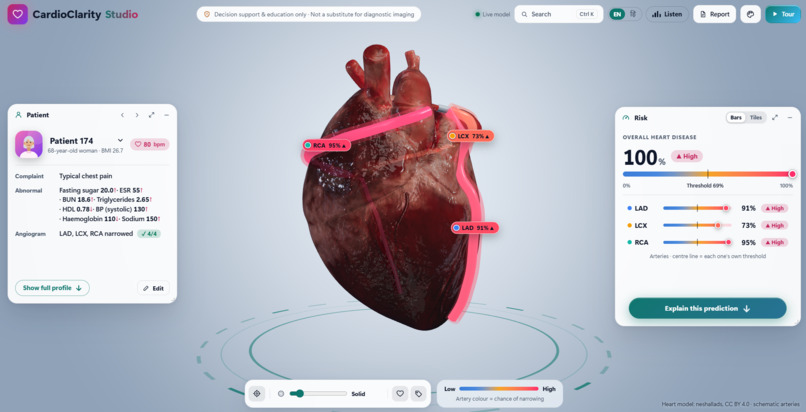
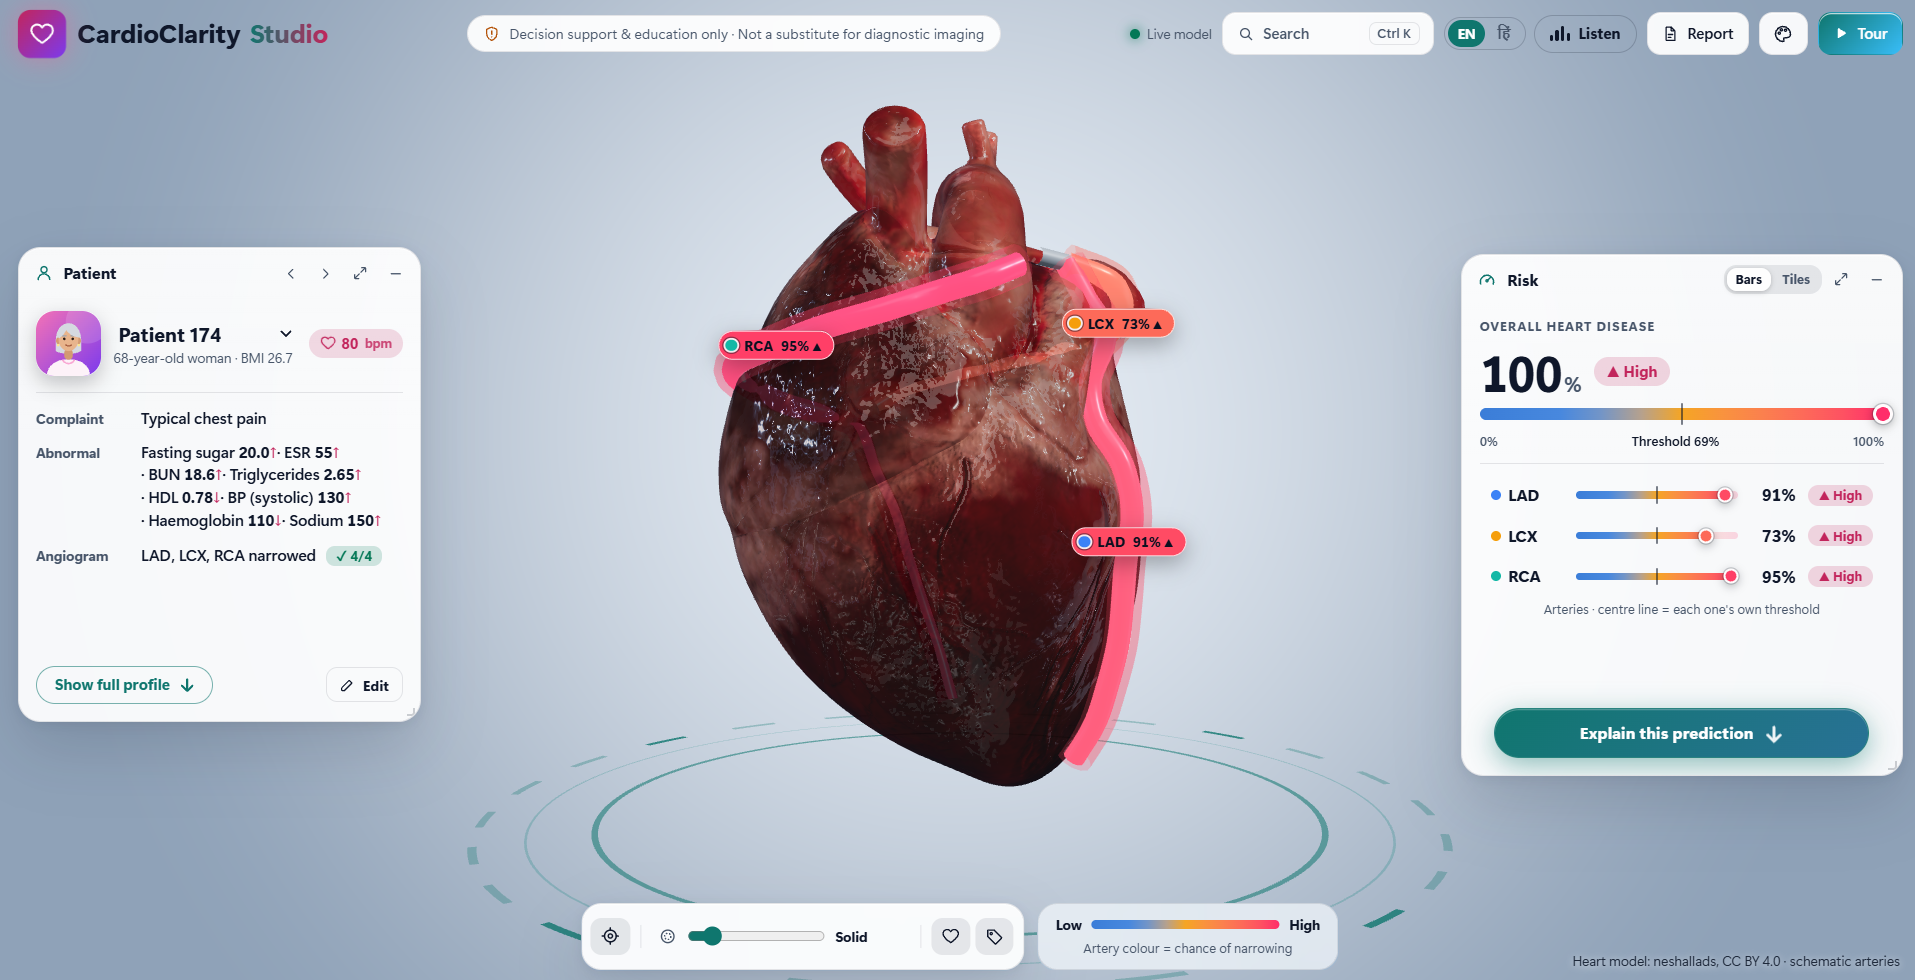
Heart 3D visualization(Light Mode)
-
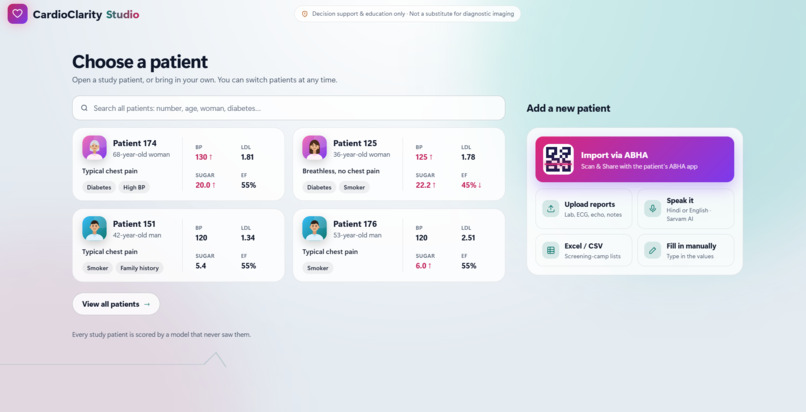
First screen - Choosing patient (Light Mode)
-
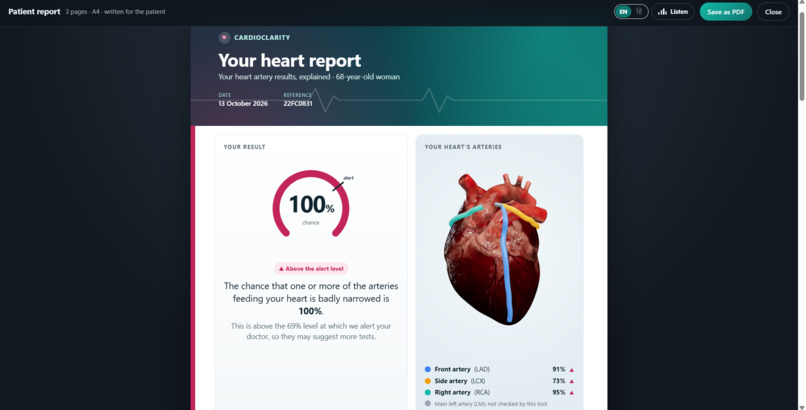
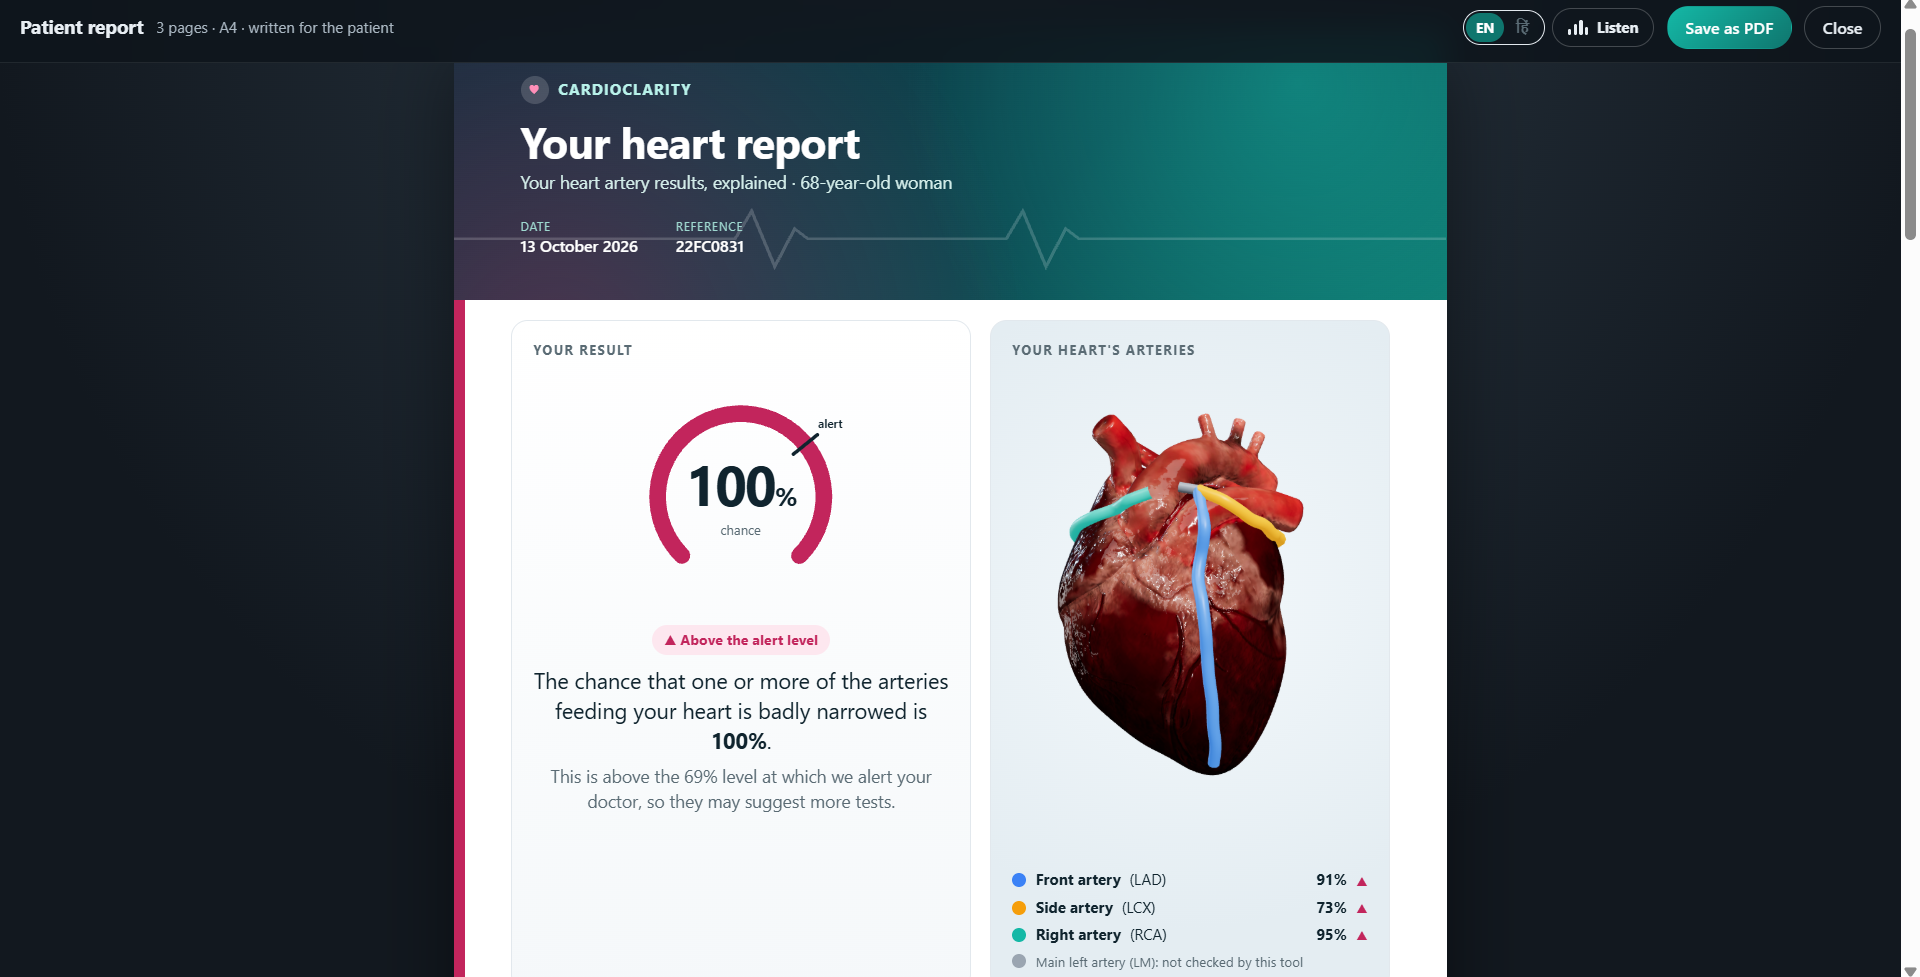
Patient take home report
-
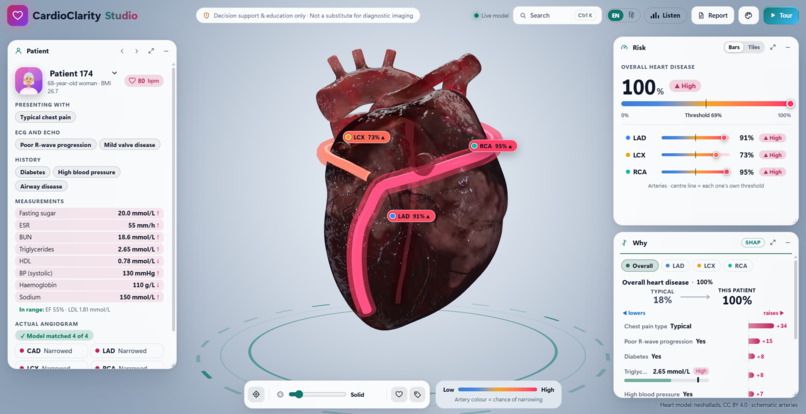
Patient CAD full dashboard (Light Mode)
-
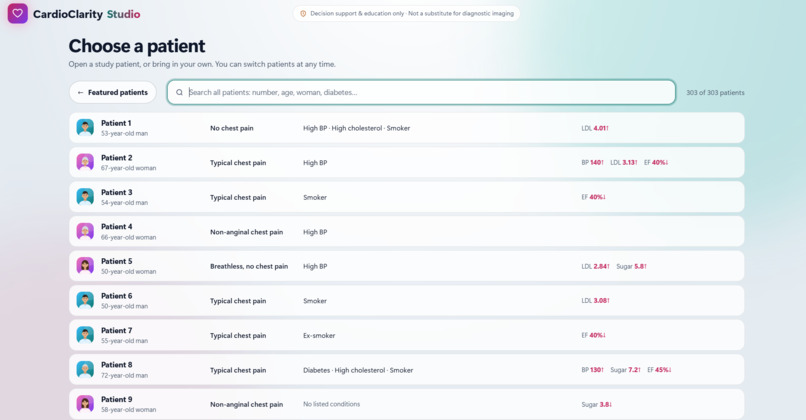
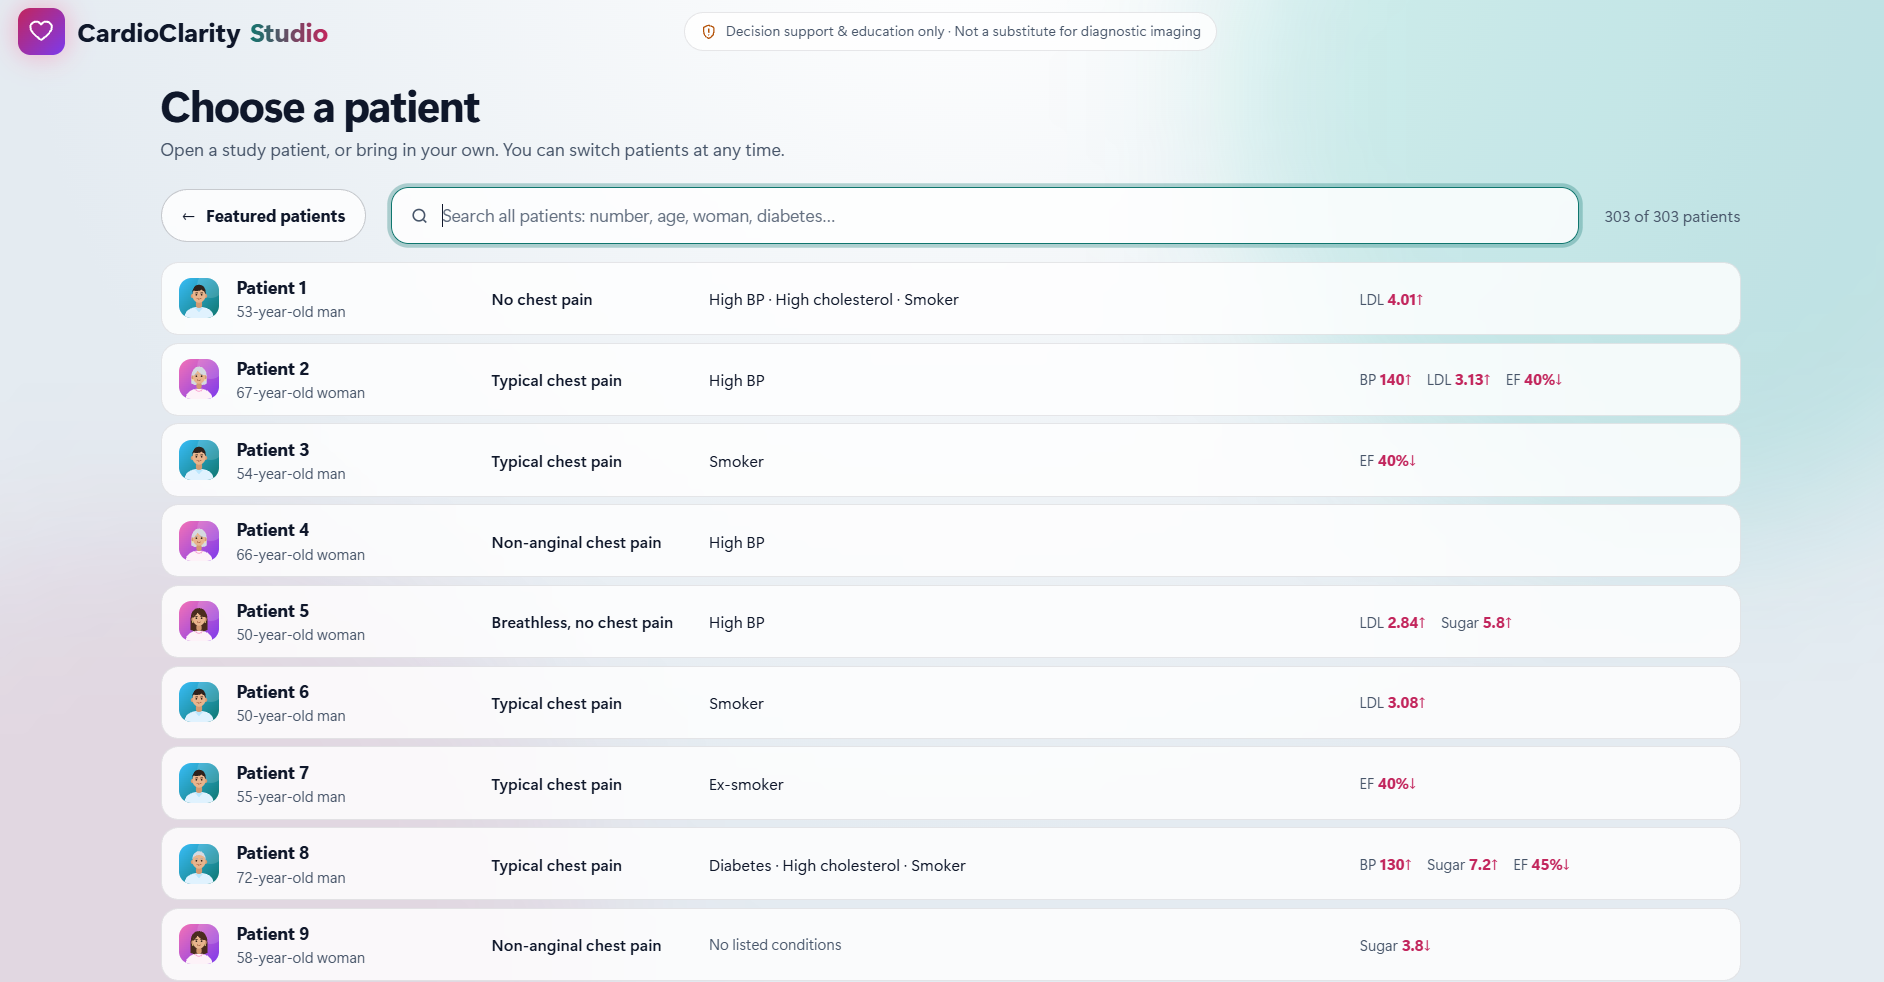
Patiets full list ( Light Mode)
-
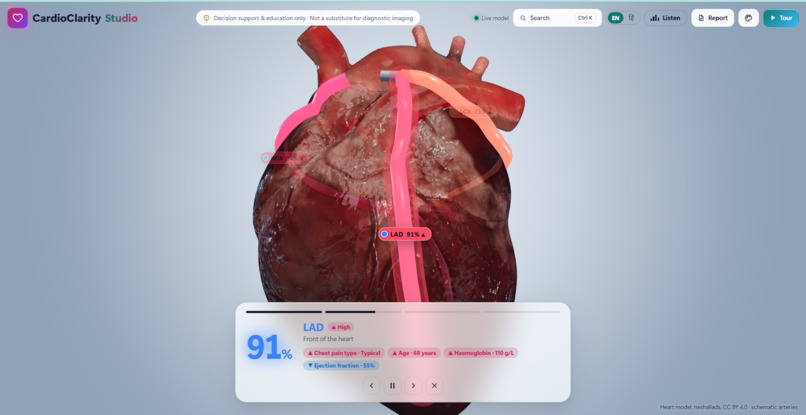
Tour page
-
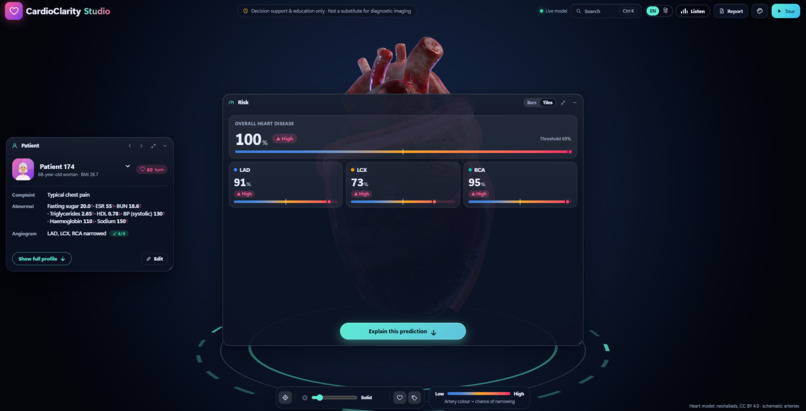
Heart Risk Window
Inspiration
Heart disease is India's biggest killer: 2.8 million deaths a year, 28% of all deaths, and more than half of them before the age of 70. India has fewer than five cardiologists per million people. A typical doctor's visit lasts about two minutes, and reports are written in English, which only about one in ten Indians speaks.
So most patients leave with, at best, one risk number. It doesn't tell them where the problem is, why, or what to do next. We wanted to build something for those two minutes: a screen a doctor can read at a glance and a patient can actually understand, in their own language.
What it does
CardioClarity Studio takes the tests a patient already has (blood tests, ECG, heart ultrasound, history) and answers four questions: the chance of coronary artery disease (CAD), and the chance that each main heart artery (LAD, LCX, RCA) is narrowed.
- See it. The result appears on a 3D heart. Each artery changes colour, thickness and glow with its own risk. Click an artery to zoom in, or switch to an X-ray view.
- Understand it. "Explain this prediction" uses SHAP to show how much each test result pushed the risk up or down, in percentage points. Point at any test to see its effect on all three arteries.
- Act on it. What-if sliders (weight, smoking, blood pressure, sugar, cholesterol) re-score the patient in about a second, so a doctor can show why a change matters. A 3-page plain-language report lists the main reasons, questions to ask the doctor, and when to get help straight away.
- Hear it in Hindi. Most Indians, especially in small towns and villages, don't read English reports. Listen reads the summary aloud in Hindi, recorded with Sarvam AI, India's own speech AI. It covers the risk, which arteries, the main reasons and the next step. Medical terms stay in English, the way Indian doctors speak, so the patient recognises them on their reports. Switch EN | हिं next to Listen.
- Honest. When the model can't decide, it says "unsure" instead of guessing. Every screen says it is for decision support and education only.
Designed for India: getting data in without typing (multimodal AI). Typing 49 values is slow, and most of them already sit in a patient's paperwork. We designed four ways in, all ending on one review screen so a person checks every value before anything is scored:
- Upload reports: photos, PDFs or WhatsApp forwards of lab, ECG and echo reports, read by multimodal AI that shows where each value came from.
- ABHA import: the patient scans the clinic's QR code with the ABHA app and gives consent. Records arrive in the standard FHIR format.
- Speak it: describe symptoms and history in Hindi or another Indian language; Sarvam AI turns speech into values.
- Excel / CSV: for health camps, score many patients at once.
How we built it
Data. 303 patients from the public Z-Alizadeh Sani dataset. Every patient had an angiogram, so the true answer is known. We cleaned the data, kept the angiogram results out of the inputs, and added inputs only when they helped: a standard pre-test probability, ten published heart-risk scores, and a wall-movement flag.
Models. We compared more than 10 model types, plus TabPFN and AutoGluon, and kept the best for each answer: an Explainable Boosting Machine for CAD, CatBoost for LAD, XGBoost for LCX and a blend of 8 models for RCA.
Testing. We used 10 × 5 repeated stratified cross-validation. Half the repeats were used for every design choice. The other half stayed sealed until the final scores.
| Answer | ROC-AUC (sealed test) |
|---|---|
| CAD | 0.939 |
| LAD | 0.869 |
| LCX | 0.782 |
| RCA | 0.770 |
Trustworthy percentages. Platt scaling calibrates each score, so "70%" really means about 7 in 10:
$$\hat{p} = \sigma(a\,s + b) = \frac{1}{1 + e^{-(a\,s + b)}}$$
Explanations that add up. We compute SHAP on the final percentage the app shows, so the points always add up exactly to the result:
$$\hat{p}(x) = \phi_0 + \sum_{i=1}^{M} \phi_i$$
Here $\phi_0$ is a typical patient's risk and $\phi_i$ is the push from test result $i$.
Server. FastAPI keeps five models per answer, each trained without one fifth of the patients. A study patient is always scored by the model that never saw them. An artery's risk is never shown higher than the overall CAD risk.
App. React, TypeScript and React Three Fiber, with one typed data format (Pydantic and Zod) shared by the server and the browser. The heart and every panel read the same result, so a colour and its number can never disagree.
Hindi. Summaries for the featured patients were recorded once with Sarvam AI's Bulbul voice: 4 API calls in total and zero calls at run time, so it's free to serve and plays instantly.
Deploy. One Docker image on Google Cloud Run, CPU only.
Challenges we ran into
- Small data makes it easy to fool yourself. With 303 patients, a lucky split can look like a breakthrough. Sealing half the test rounds, and counting only statistically significant gains, kept us honest.
- Leaks that look like success. Our first served model had seen every study patient during training, so it looked almost perfect (AUC 0.99–1.00). We rebuilt serving so no patient is ever scored by a model that saw them.
- "Which artery" is much harder than "is there disease". Among sick patients, telling the arteries apart is only slightly better than chance. Rather than hide this, the heart shows the chance an artery is involved, and says "unsure" when it should.
- Explanations had to match the screen. Explaining the raw model gave points that didn't add up to the displayed percentage, because of calibration and the CAD cap. Explaining the final served value fixed it.
- Too much to show. We had dozens of panels' worth of information. We made the heart the screen, open only two panels at the start, and show details only when asked.
- Smooth on ordinary laptops. The 3D heart runs at 56–59 frames per second on built-in Intel graphics, with no graphics card.
Accomplishments that we're proud of
- Strong results on a sealed test, for four answers, not one, each with its own model, calibration and alert level.
- Patient 125: a 36-year-old woman with no chest pain, flagged from her echo and ECG (LAD 75%). Her angiogram confirmed LAD disease.
- Hindi that reaches beyond English speakers. With Sarvam AI, a patient in a small town can hear their own heart result in Hindi. The clips were recorded once (4 API calls in total, about ₹10), so there is no AI cost and no waiting when a patient presses Listen.
- A data-entry design built for Indian clinics: reports, ABHA, voice and Excel, all checked by a person on one review screen before scoring.
- Every number on screen can be traced: SHAP points add up exactly, and artery colours always match their percentages.
- A what-if updates the heart in about 1 second on the live site.
- 70 Python and 163 frontend tests pass, with 0 accessibility violations in light and dark themes.
What we learned
- On small medical data, how you test matters more than which model you pick. The best simple model already reached 0.925 on CAD; the real gains came on the arteries.
- Saying "unsure" is a feature, not a weakness. Doctors trust a tool more when it knows its limits.
- People need where, why and what next, not just a number.
- In India, language is part of the interface. A perfect prediction in English still doesn't reach most patients.
What's next for CardioClarity Studio
- Read reports with multimodal AI. Photos, PDFs and WhatsApp forwards of lab, ECG and echo reports, with each value linked back to where it came from.
- More Indian languages. Bengali, Marathi, Tamil, Telugu and more through Sarvam AI, for every patient, not just the featured four.
- Speak, don't type. Patients and health workers describe symptoms in their own language.
- ABHA import. With consent, pull lab results and vital signs from India's digital health ID.
- Test on Indian patients. The models learned from one hospital in Iran, and Indians get heart disease about ten years younger.
- Health camps. Upload an Excel sheet, score many patients at once, and rank who to refer first.
Built With
- catboost
- docker
- fastapi
- google-cloud-run
- interpretml
- lightgbm
- numpy
- optuna
- pandas
- pydantic
- pytest
- python
- react
- react-three-fiber
- sarvam-ai
- scikit-learn
- shap
- tabpfn
- three.js
- typescript
- vite
- vitest
- webgl
- xgboost
- zod


Log in or sign up for Devpost to join the conversation.