-
-
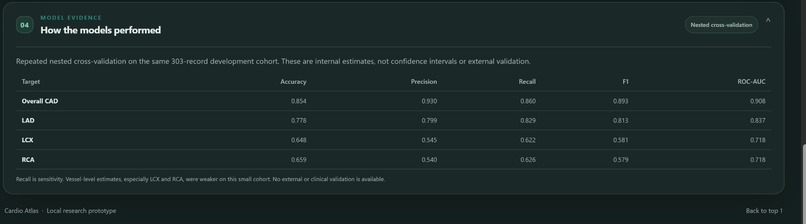
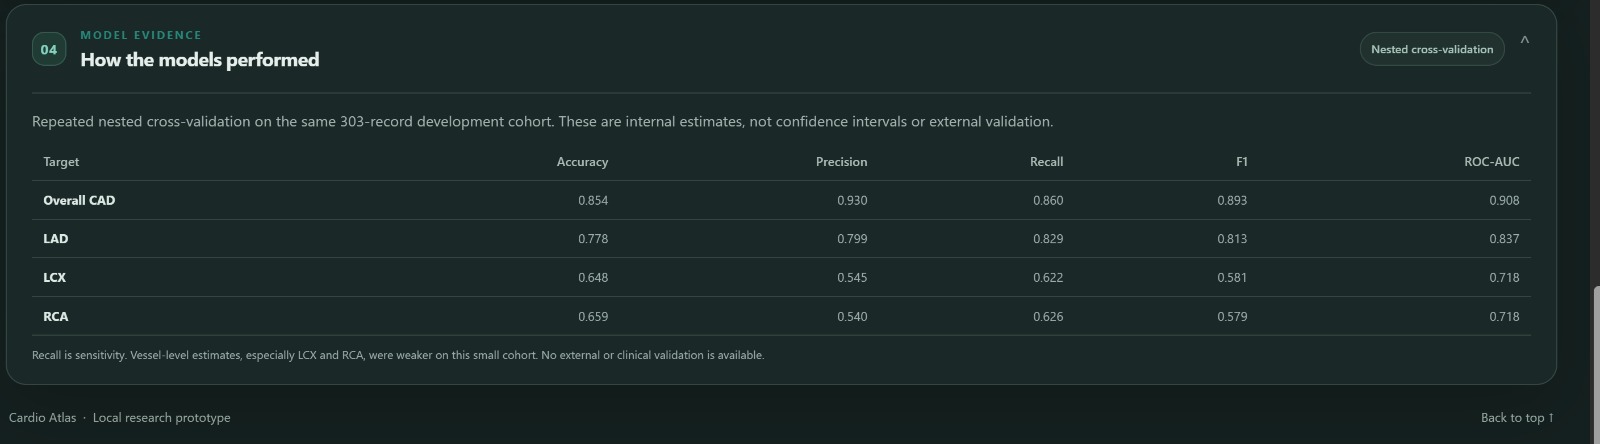
Model performance dashboard comparing CAD, LAD, LCX, and RCA using accuracy, precision, recall, F1-score, and ROC-AUC from cross-validation.
-
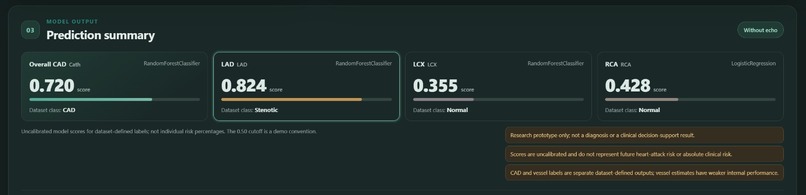
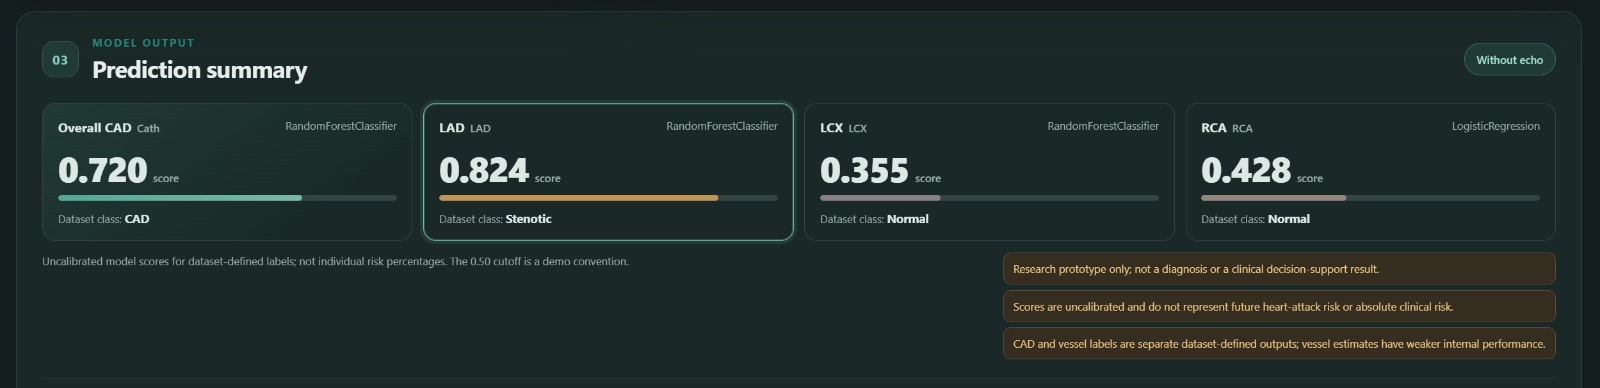
CardioVision-3D prediction summary showing overall CAD and vessel-specific model scores for LAD, LCX, and RCA, with dataset labels
-
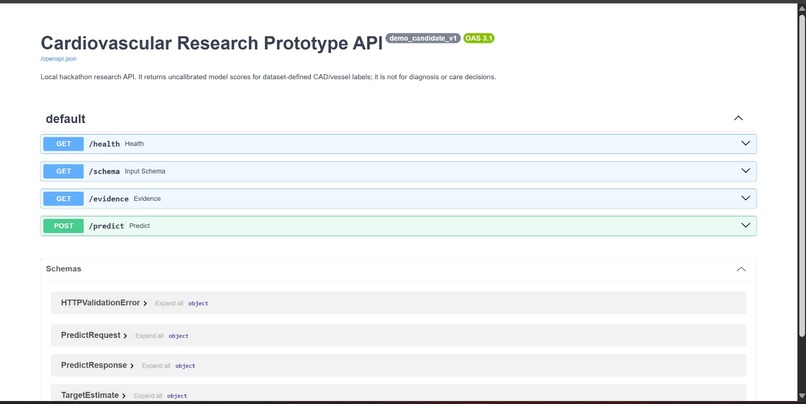
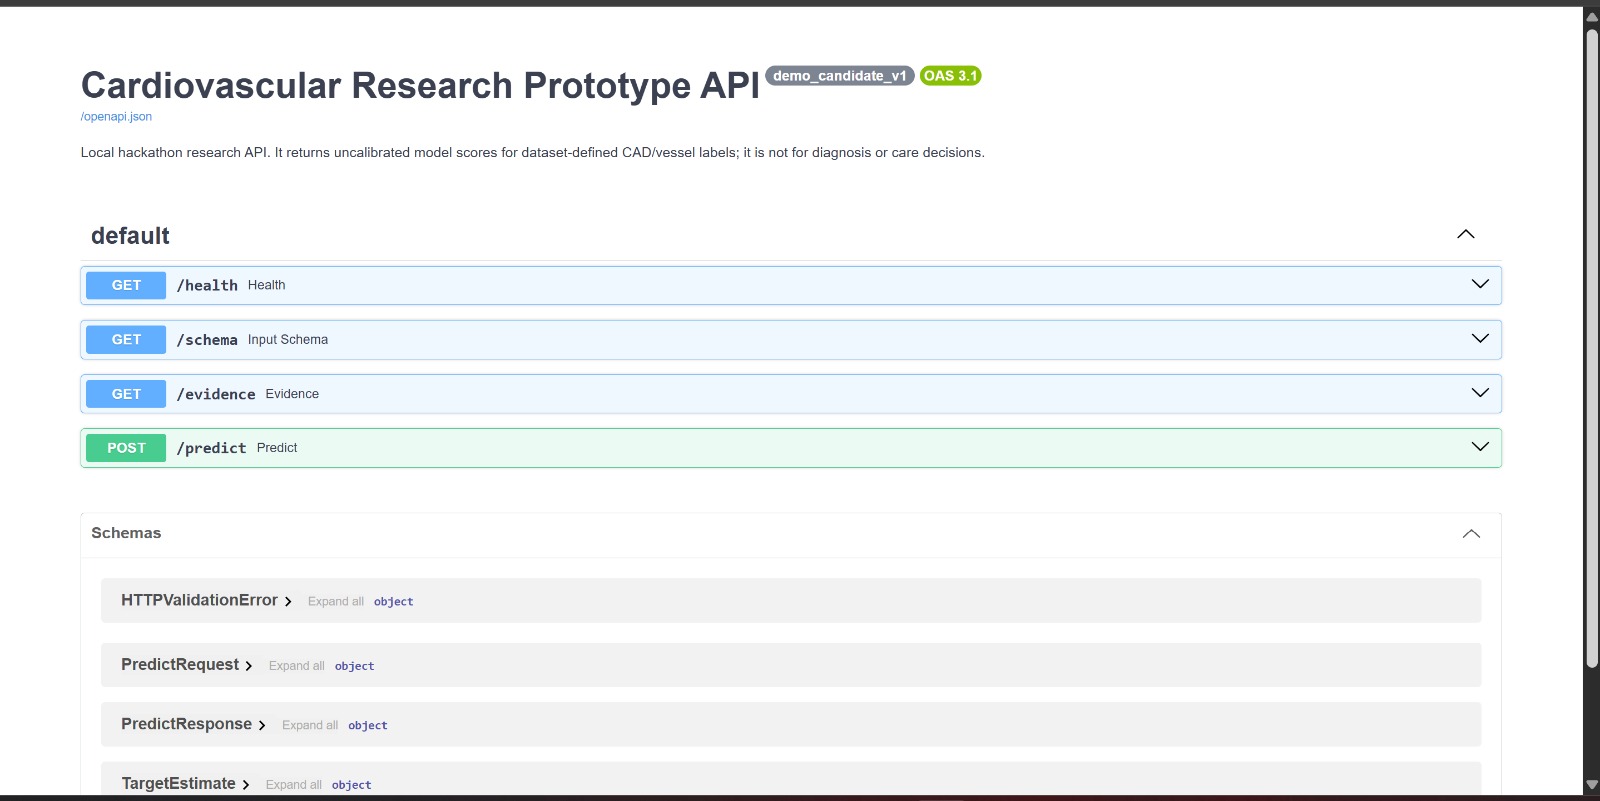
Cardiovascular Research Prototype API documentation showing health, schema, evidence, and prediction endpoints for CardioVision-3D.
-
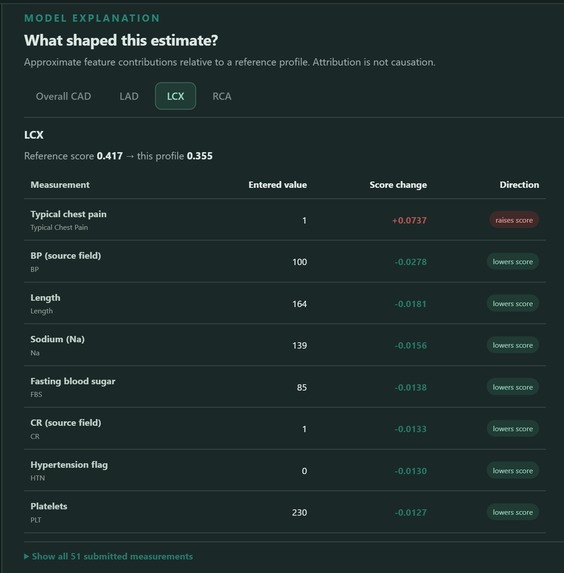
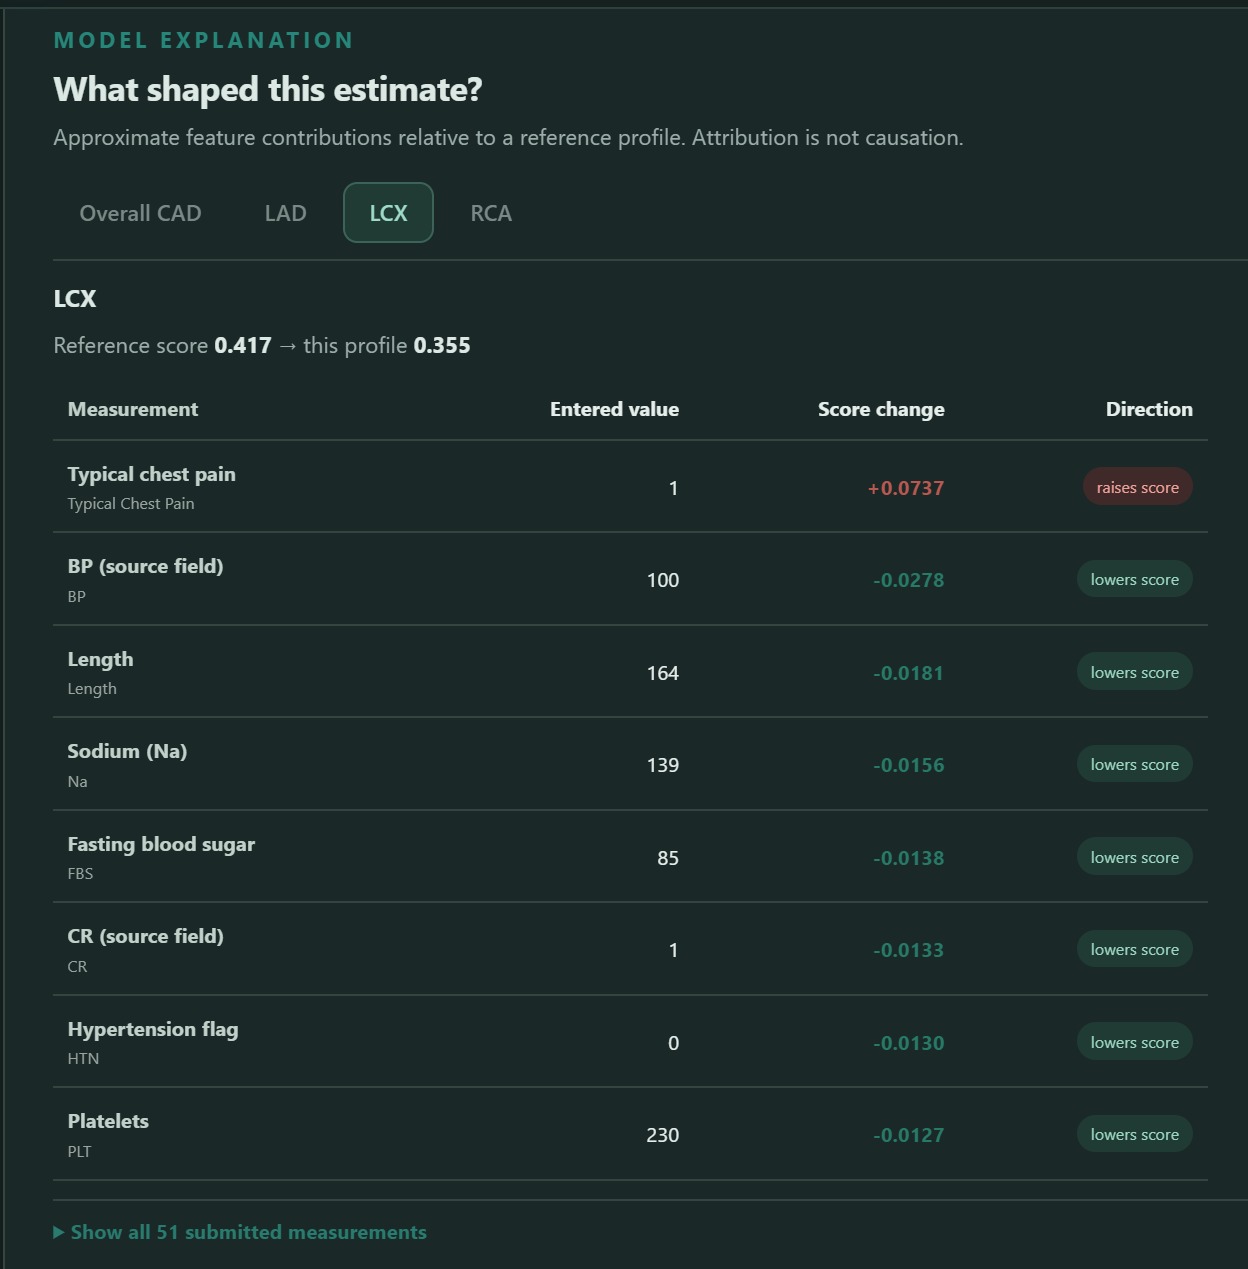
LCX model highlights clinical features influencing the estimate,showing factors that raise or lower the score relative to reference profile
-
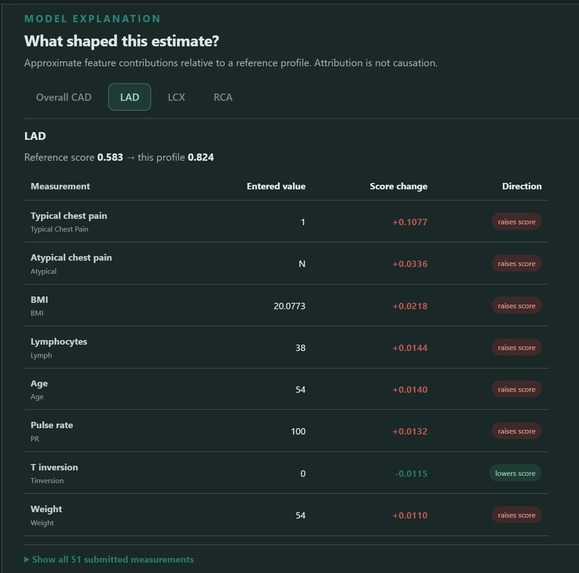
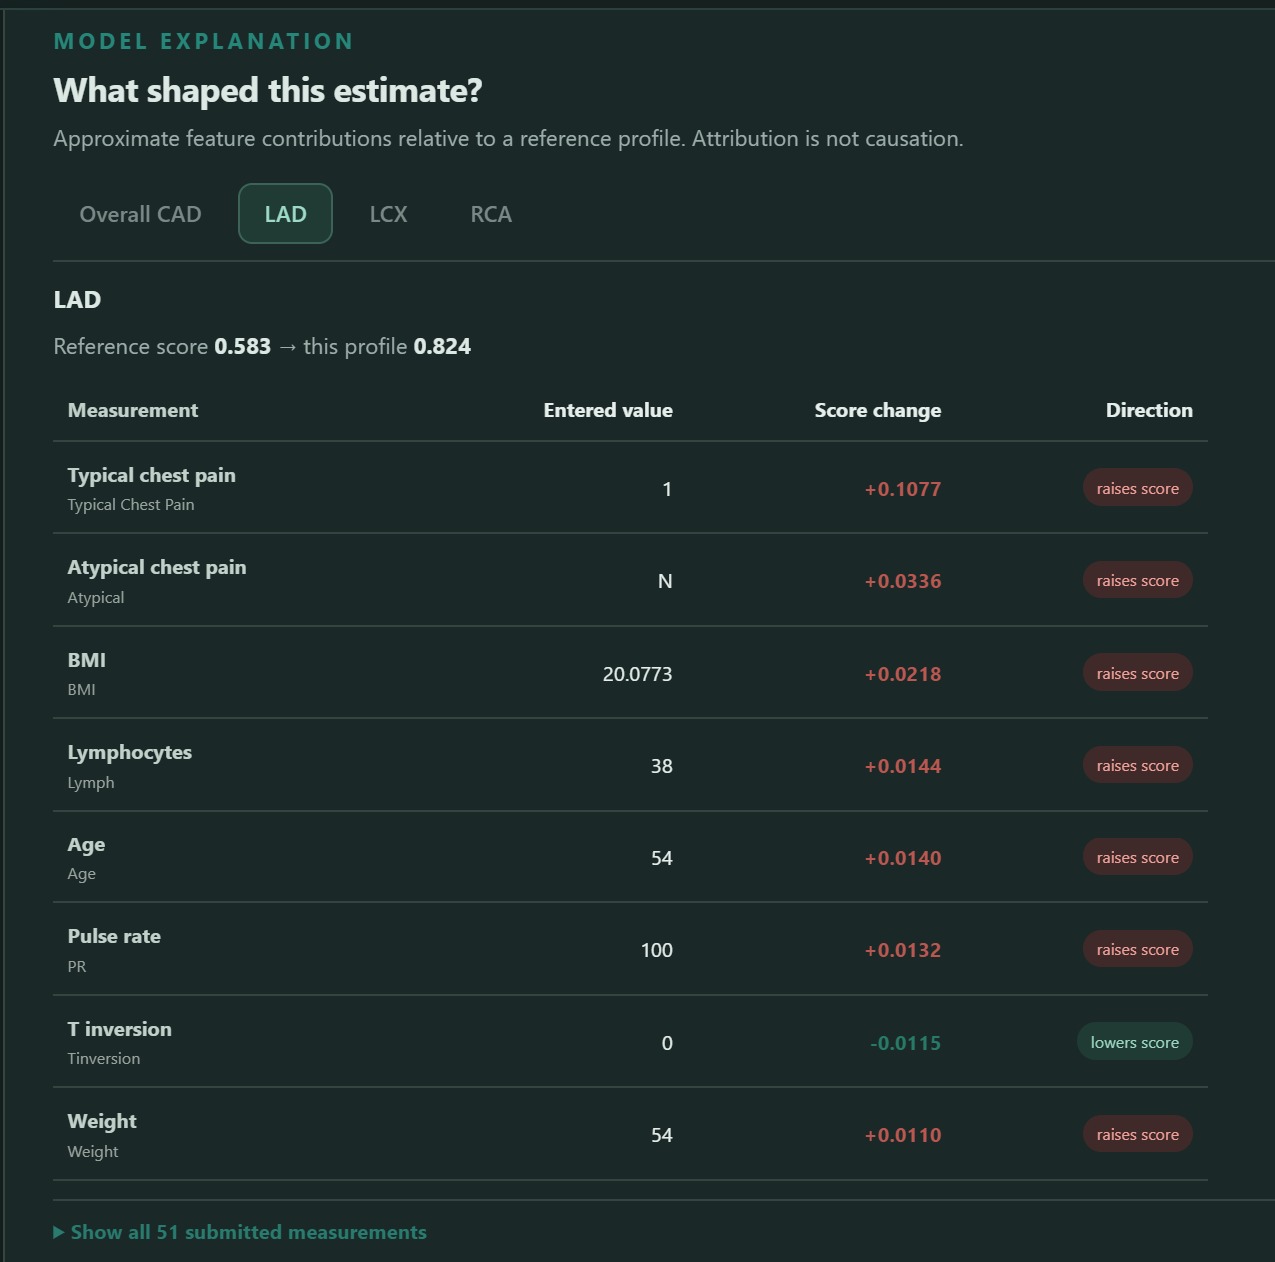
LAD model explanation shows clinical features that raise or lower the estimate compared with a reference profile. Changes are model-based.
-
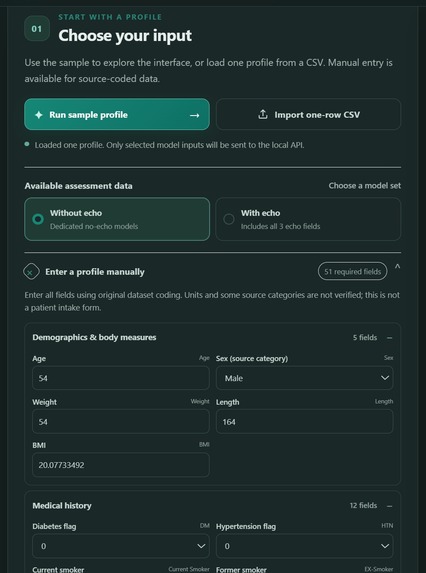
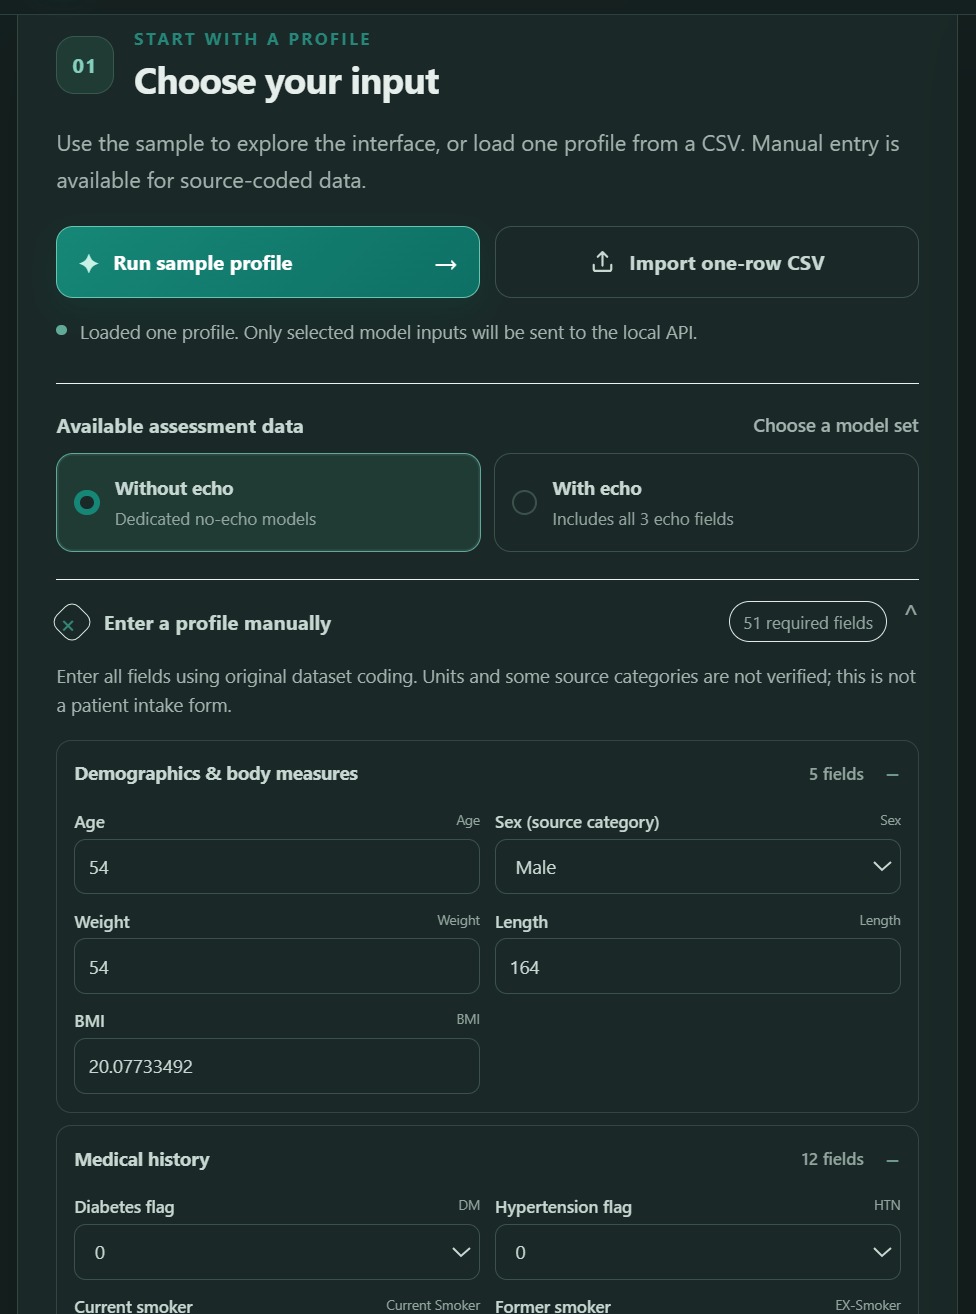
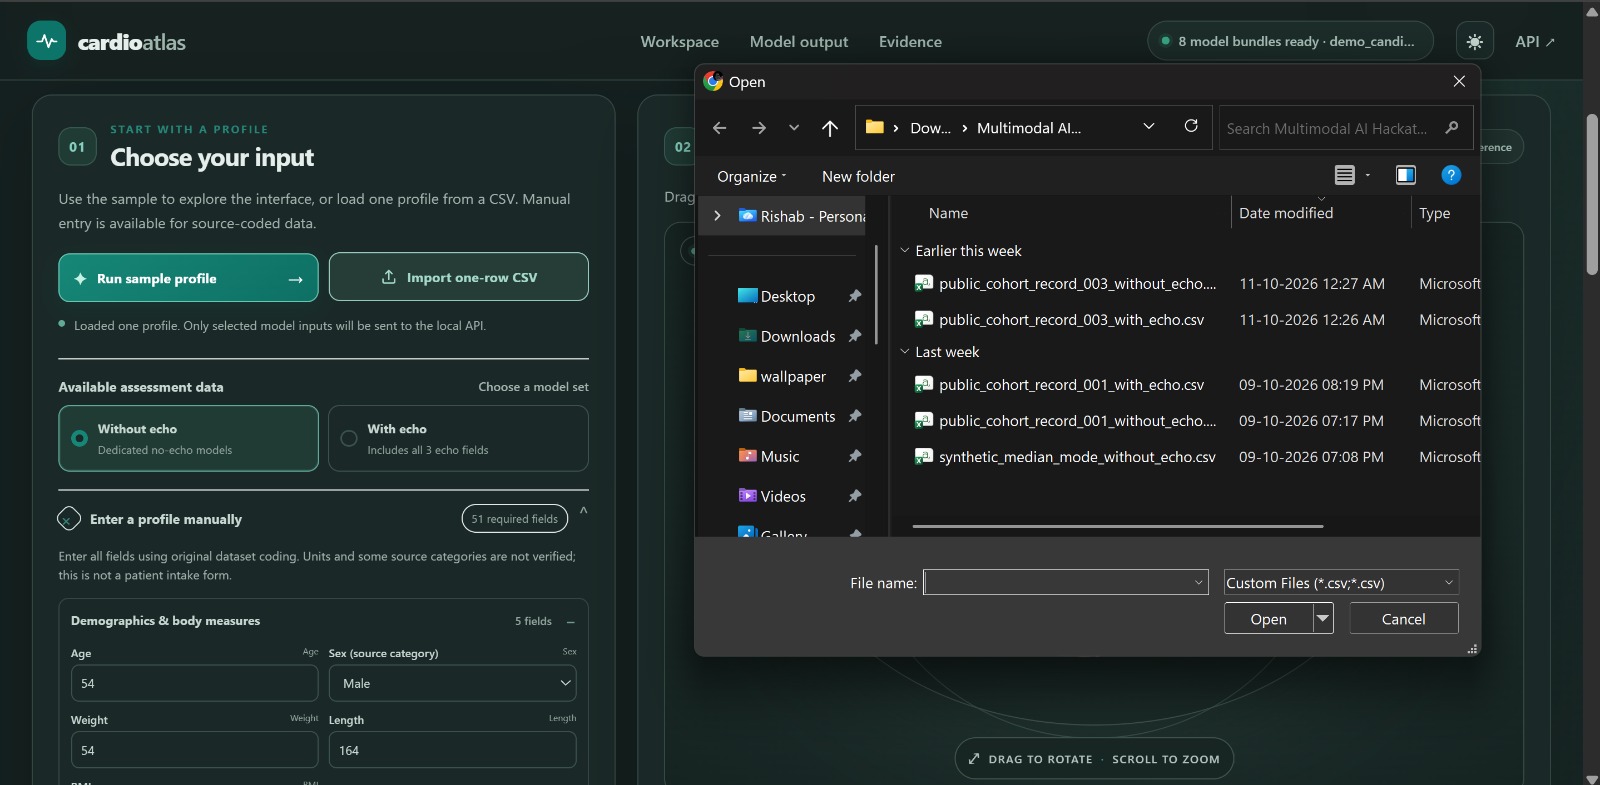
CardioVision-3D input interface for profile selection, CSV import, and manual entry of demographic and clinical data for risk prediction.
-
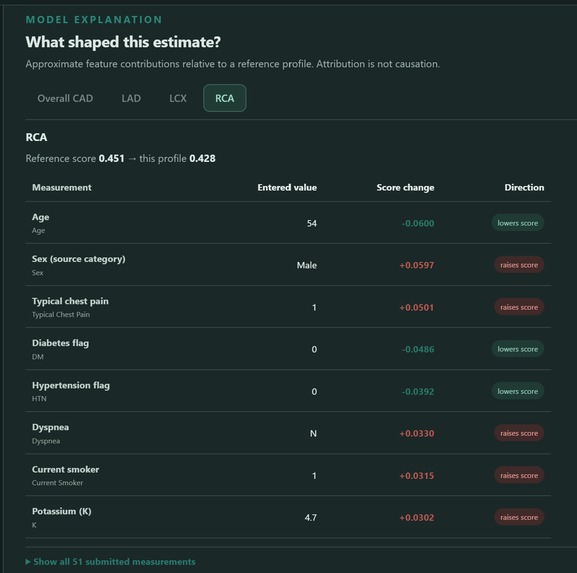
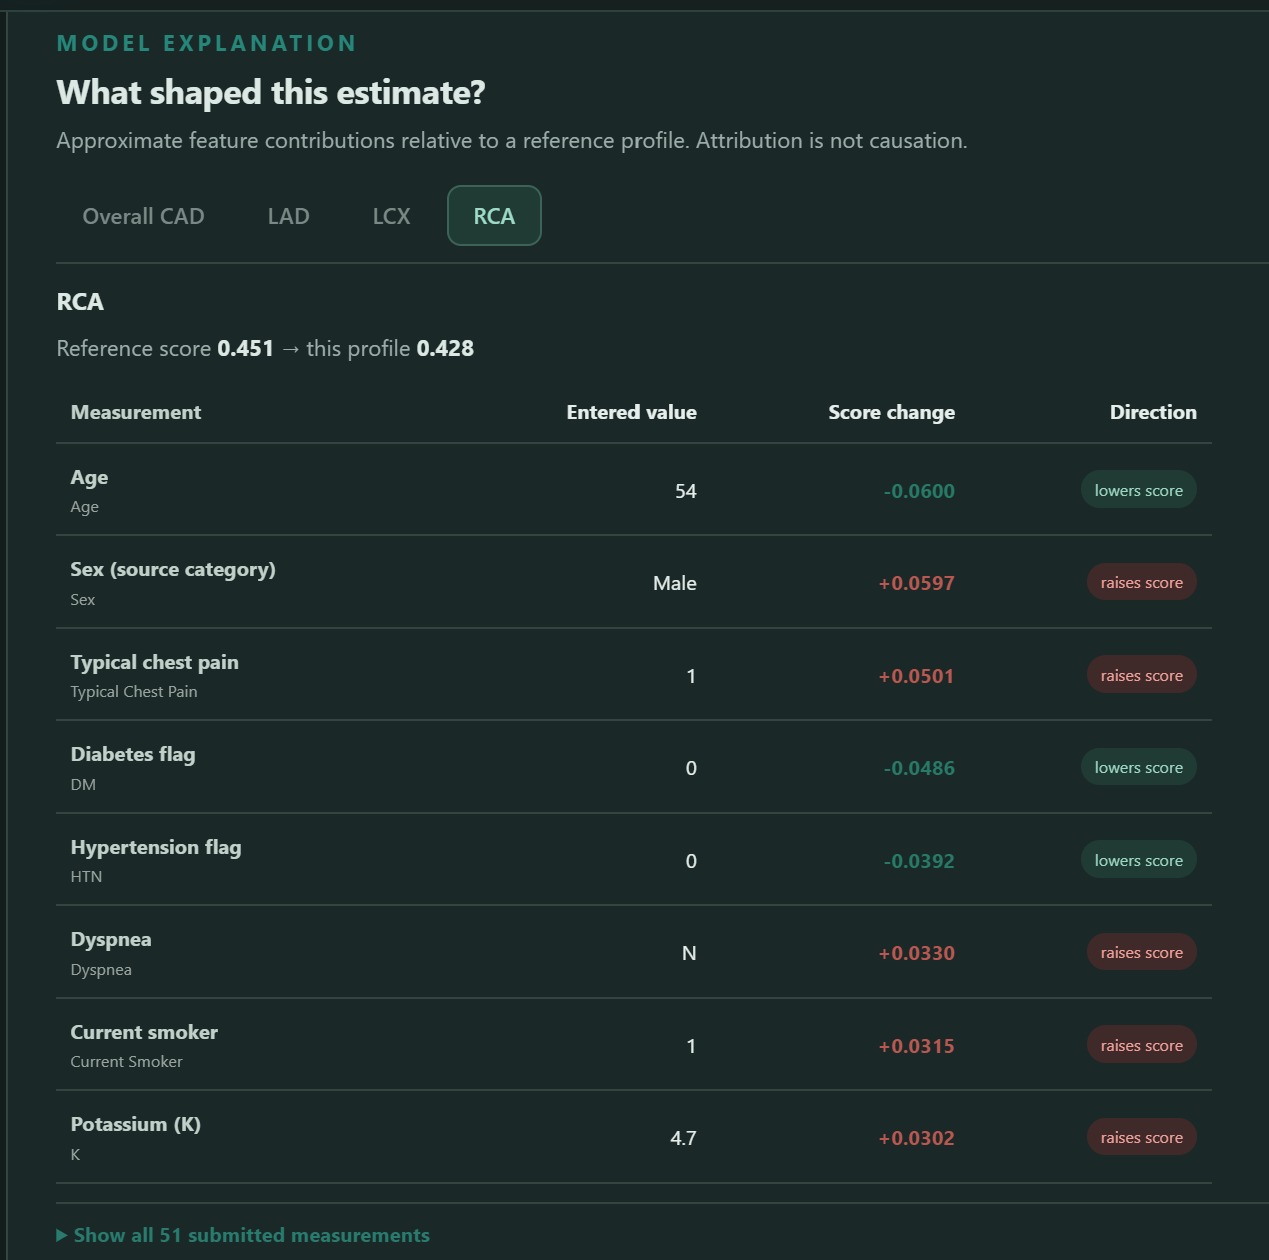
RCA model explanation highlights clinical features influencing the score, showing factors that raise or lower the estimate against profile.
-
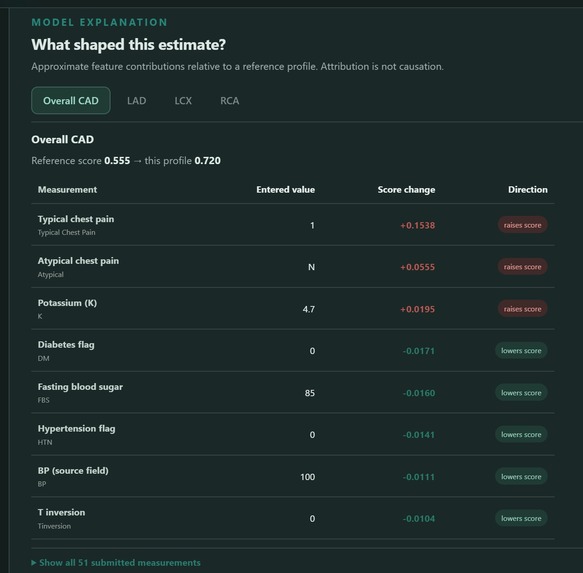
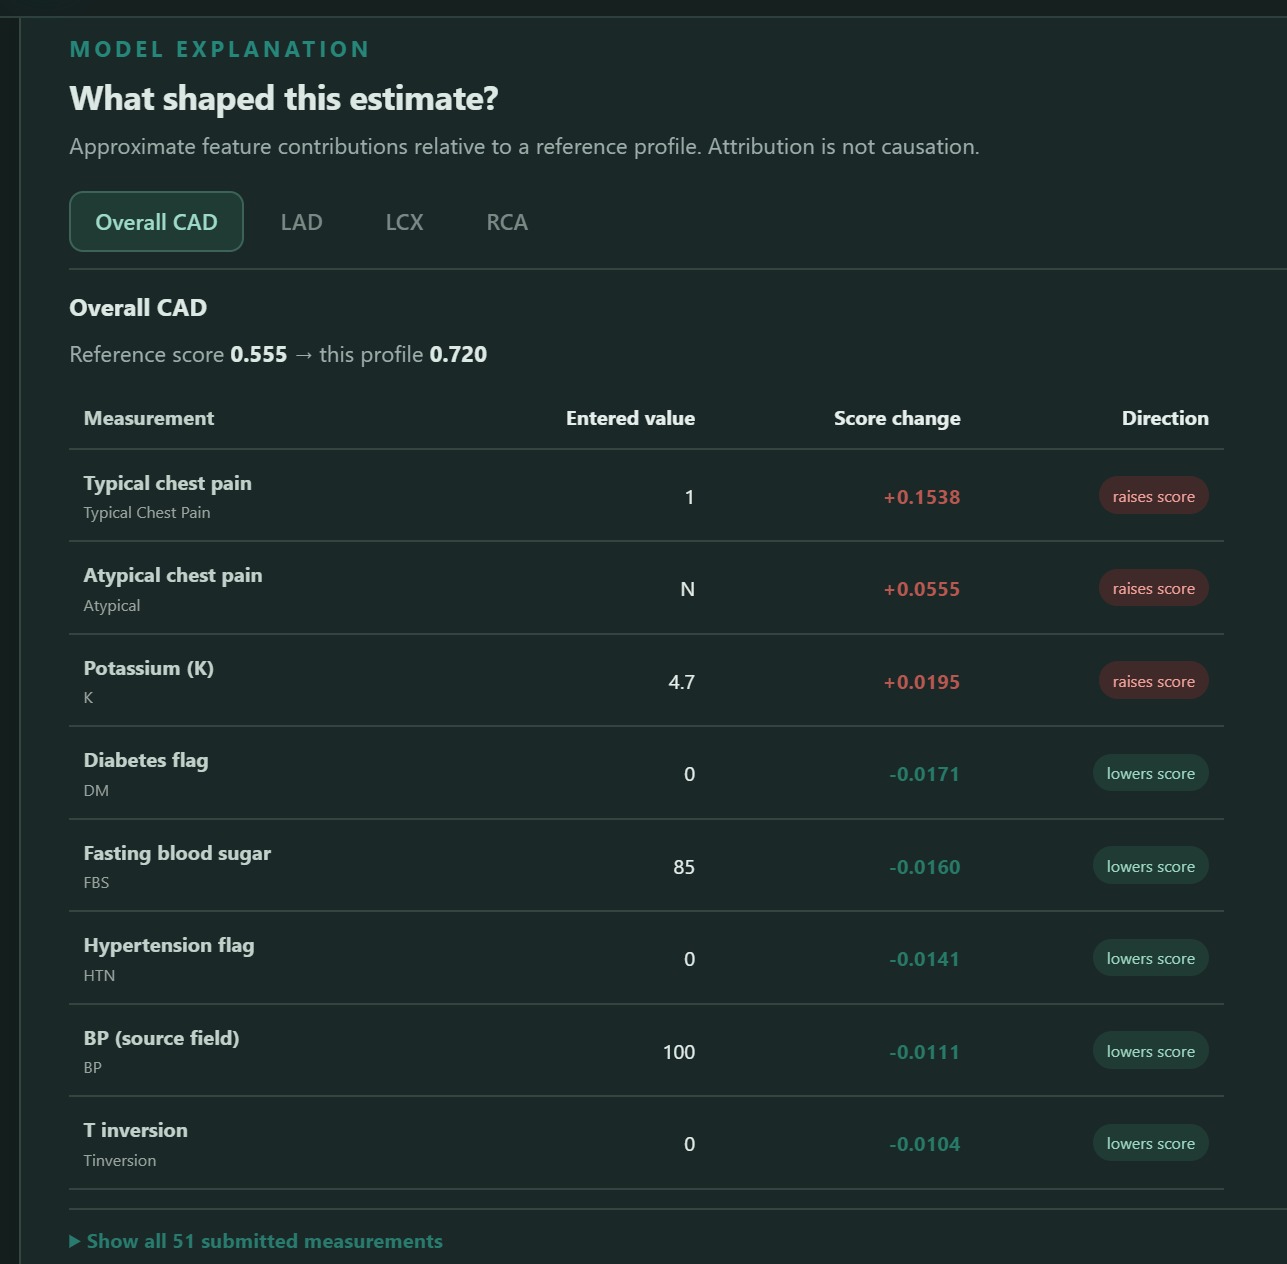
Model explanation panel showing key clinical features influencing CAD predictions, with score changes indicating factors
-
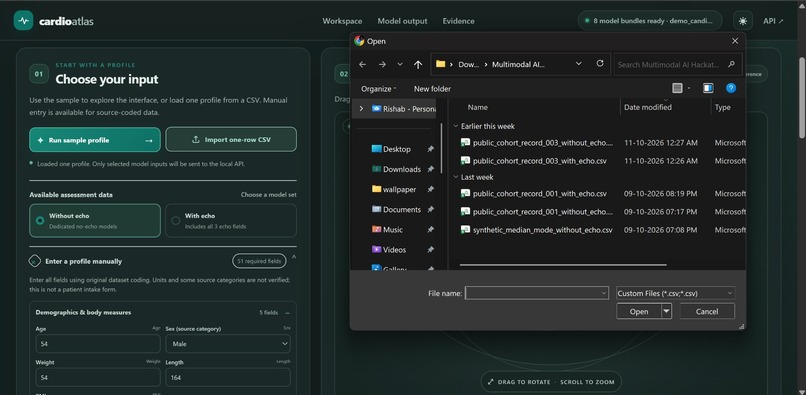
CardioAtlas interface showing CSV profile import, model selection, and patient data entry alongside sample datasets for risk prediction.
-
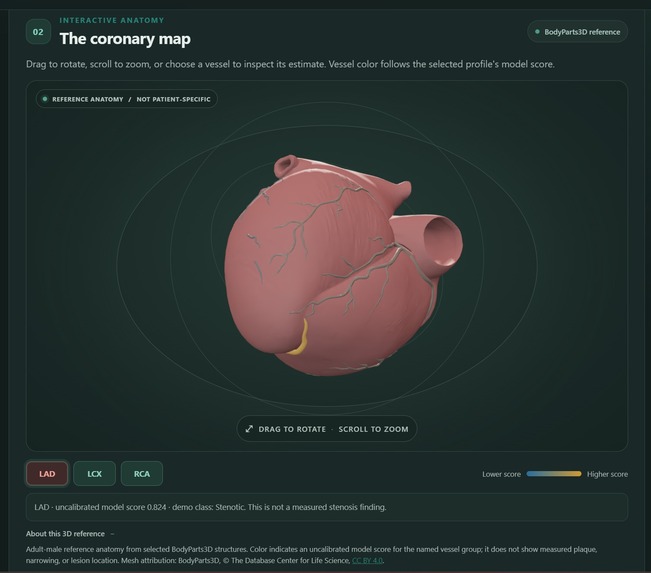
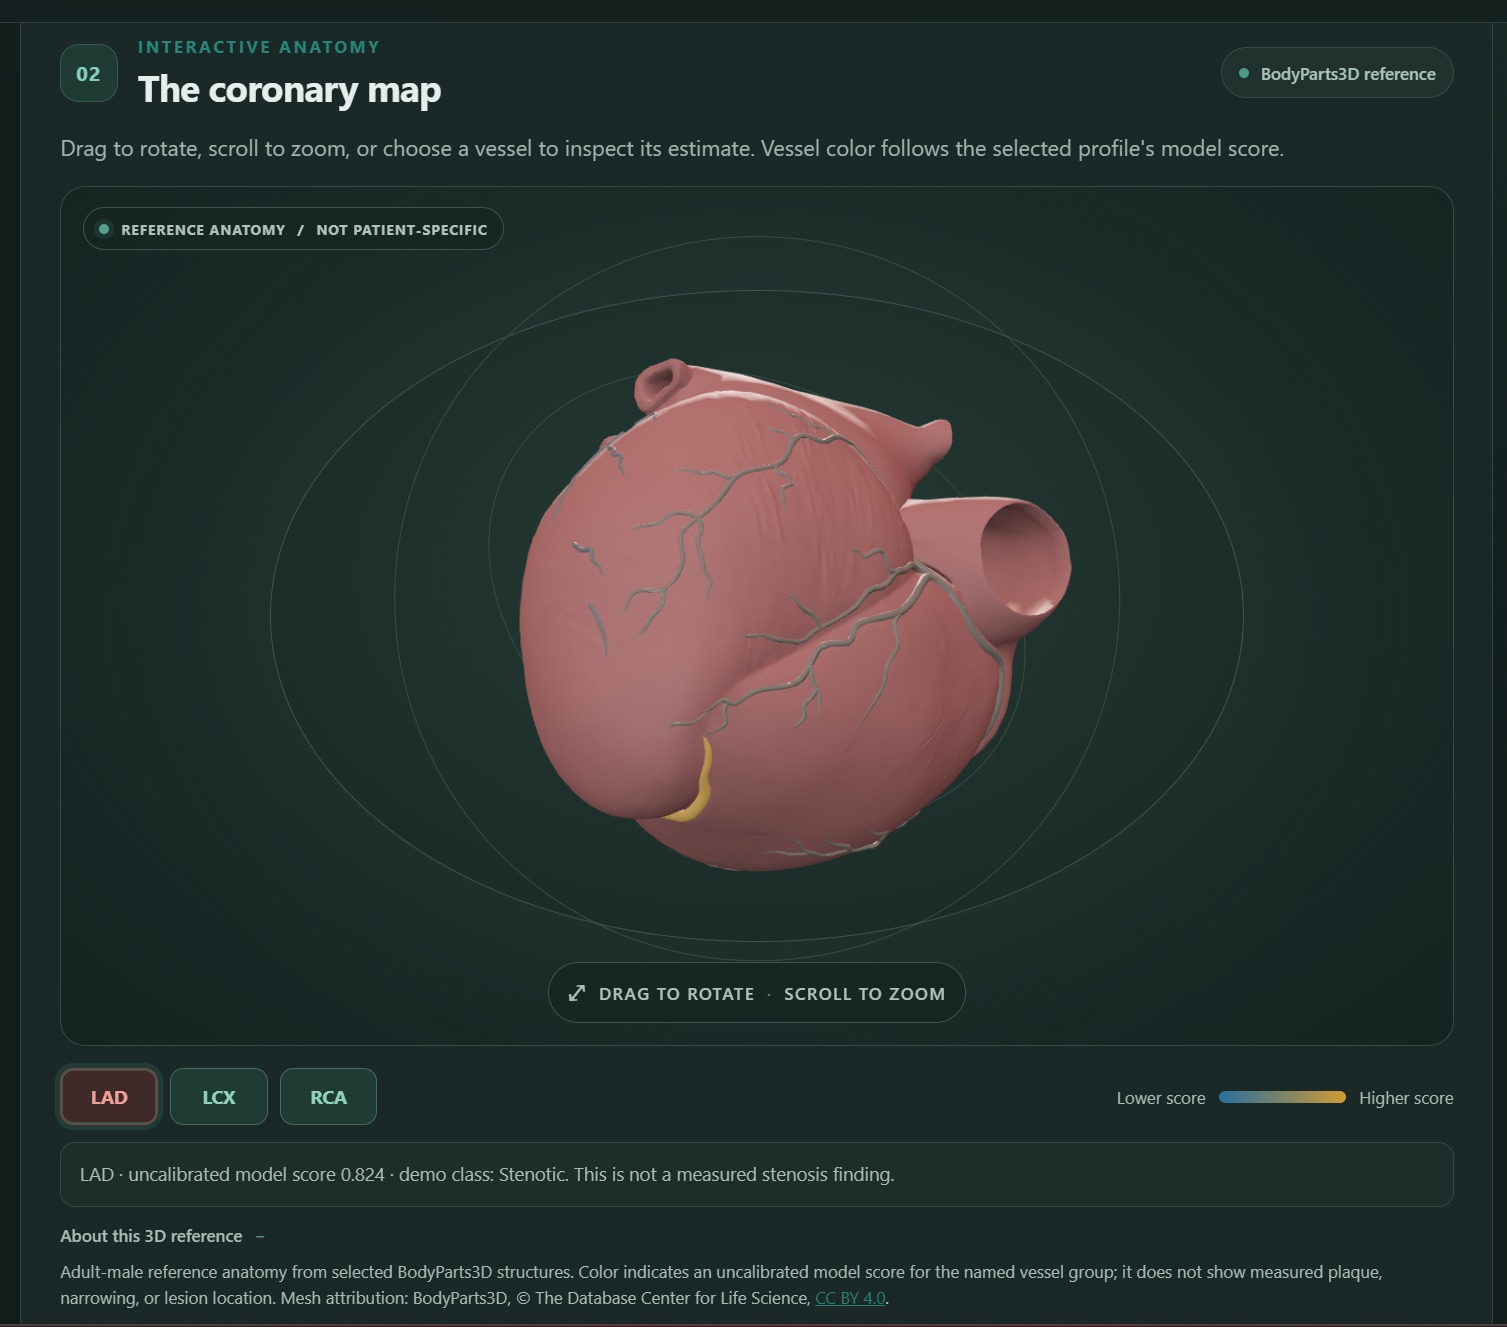
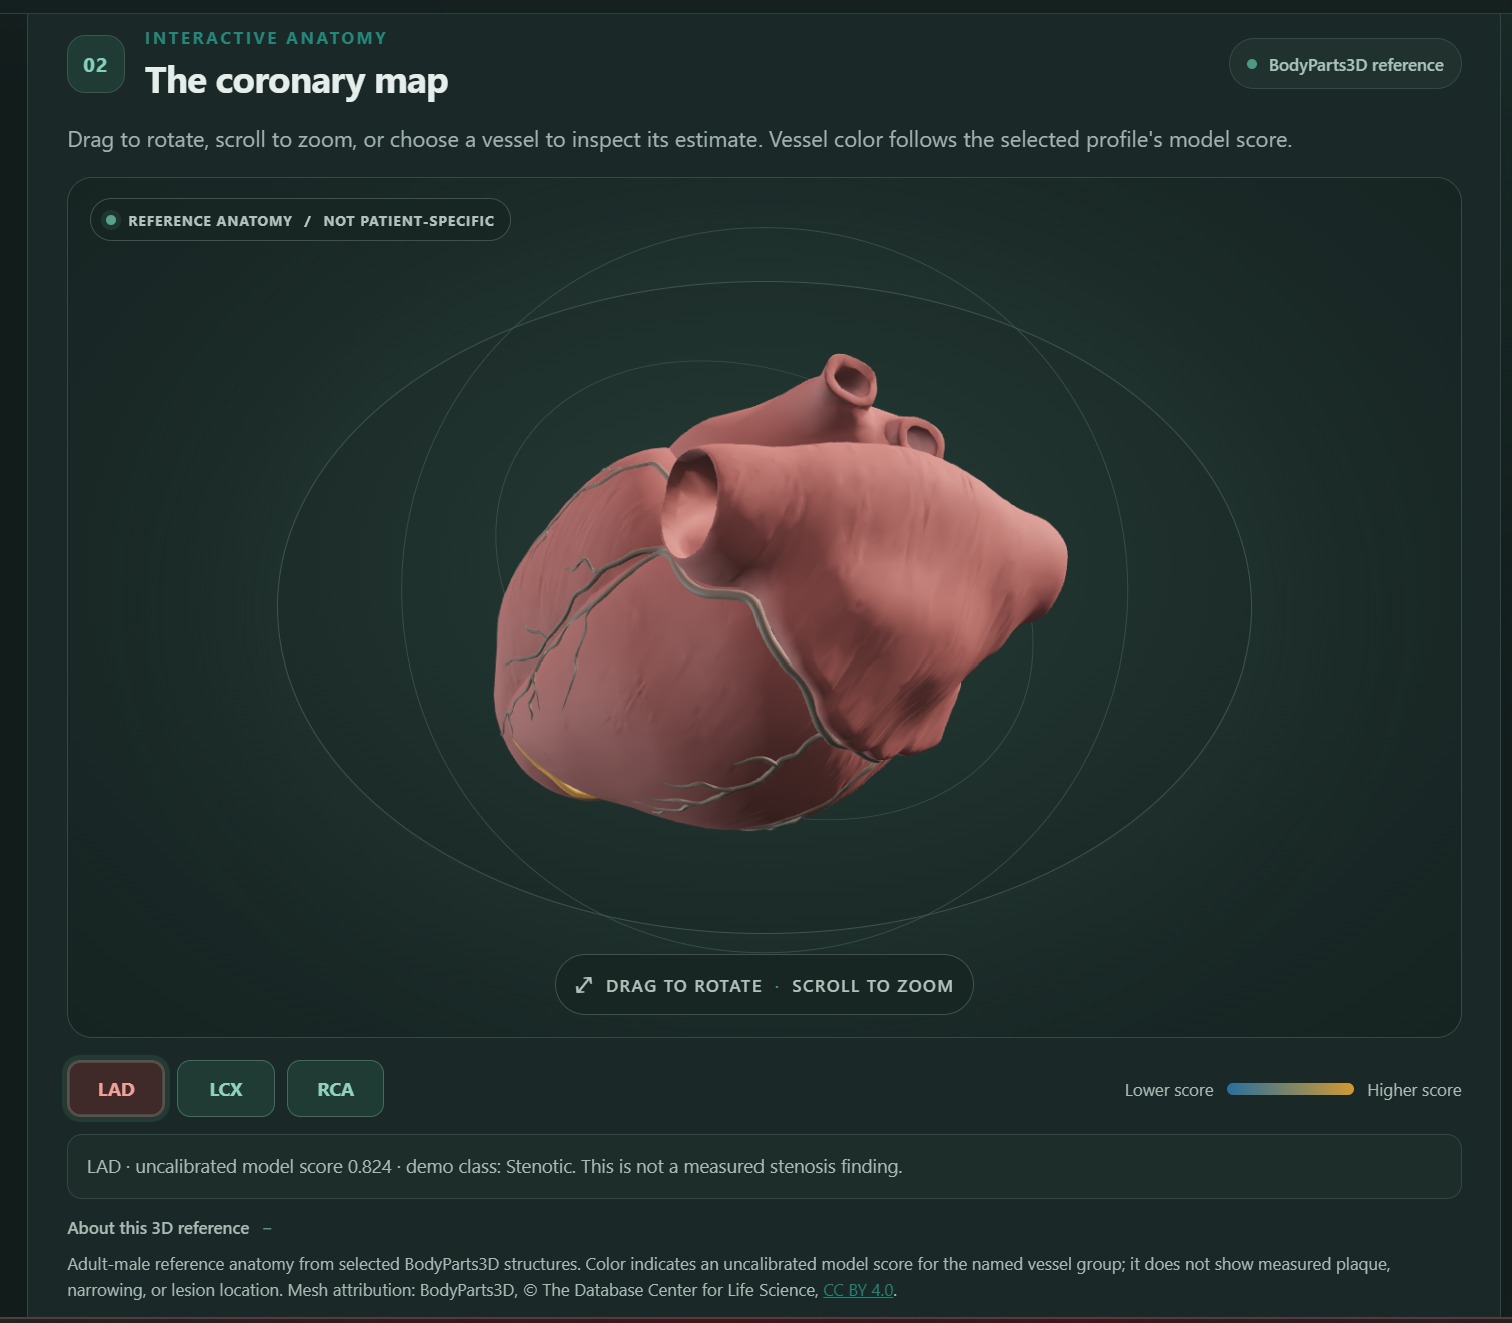
Interactive 3D Coronary Artery Visualization in CardioVision-3D
-
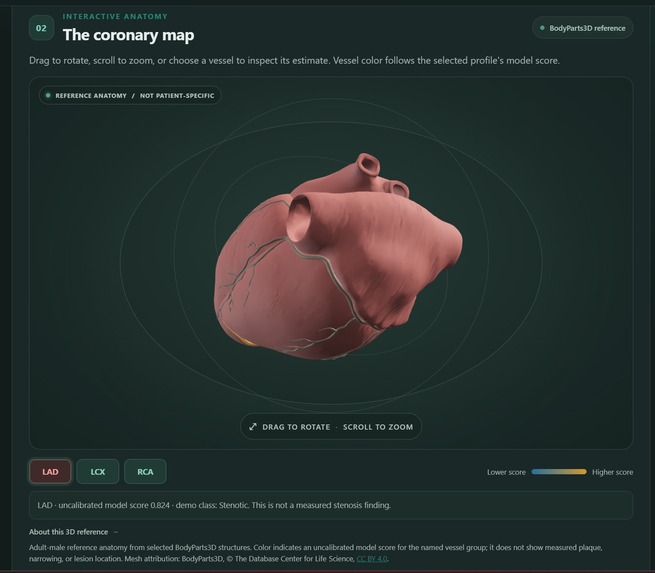
Interactive 3D coronary map showing LAD, LCX, and RCA vessel groups with color-coded, uncalibrated risk estimates on reference heart anatomy
-
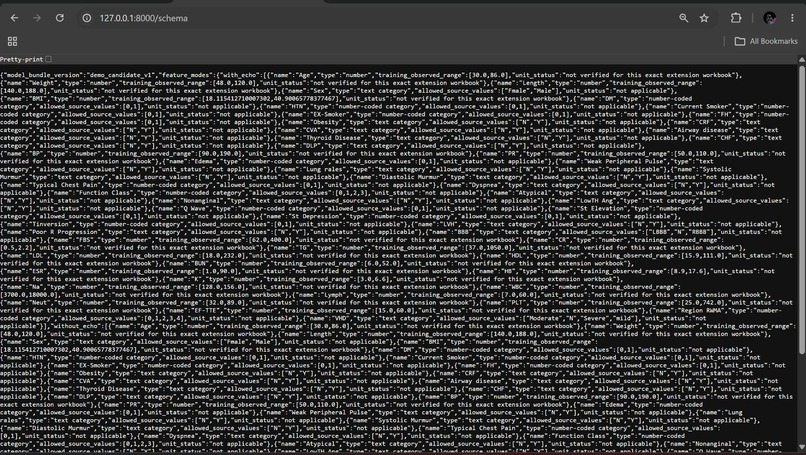
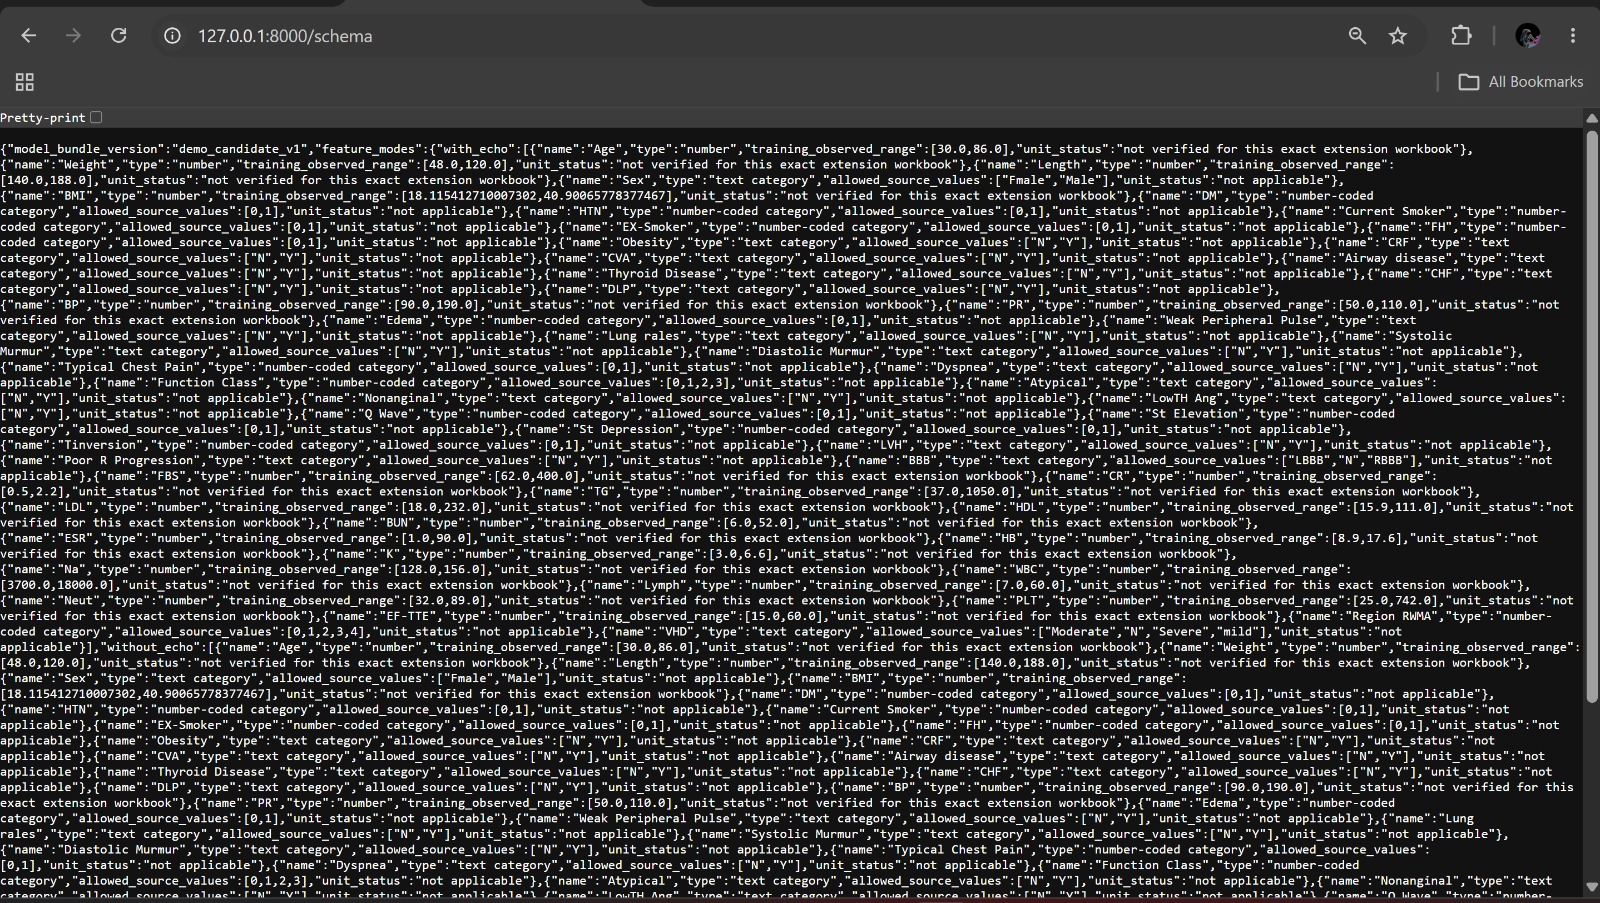
CardioVision-3D API schema displaying supported clinical input features, data types, valid ranges, and echo-based model configurations
-
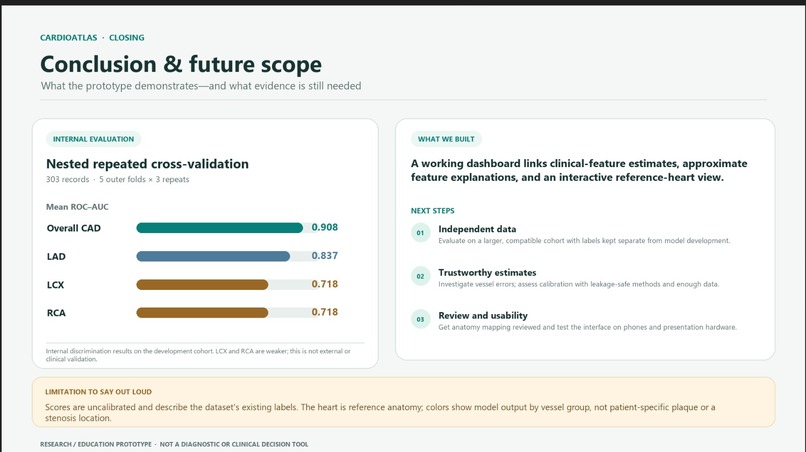
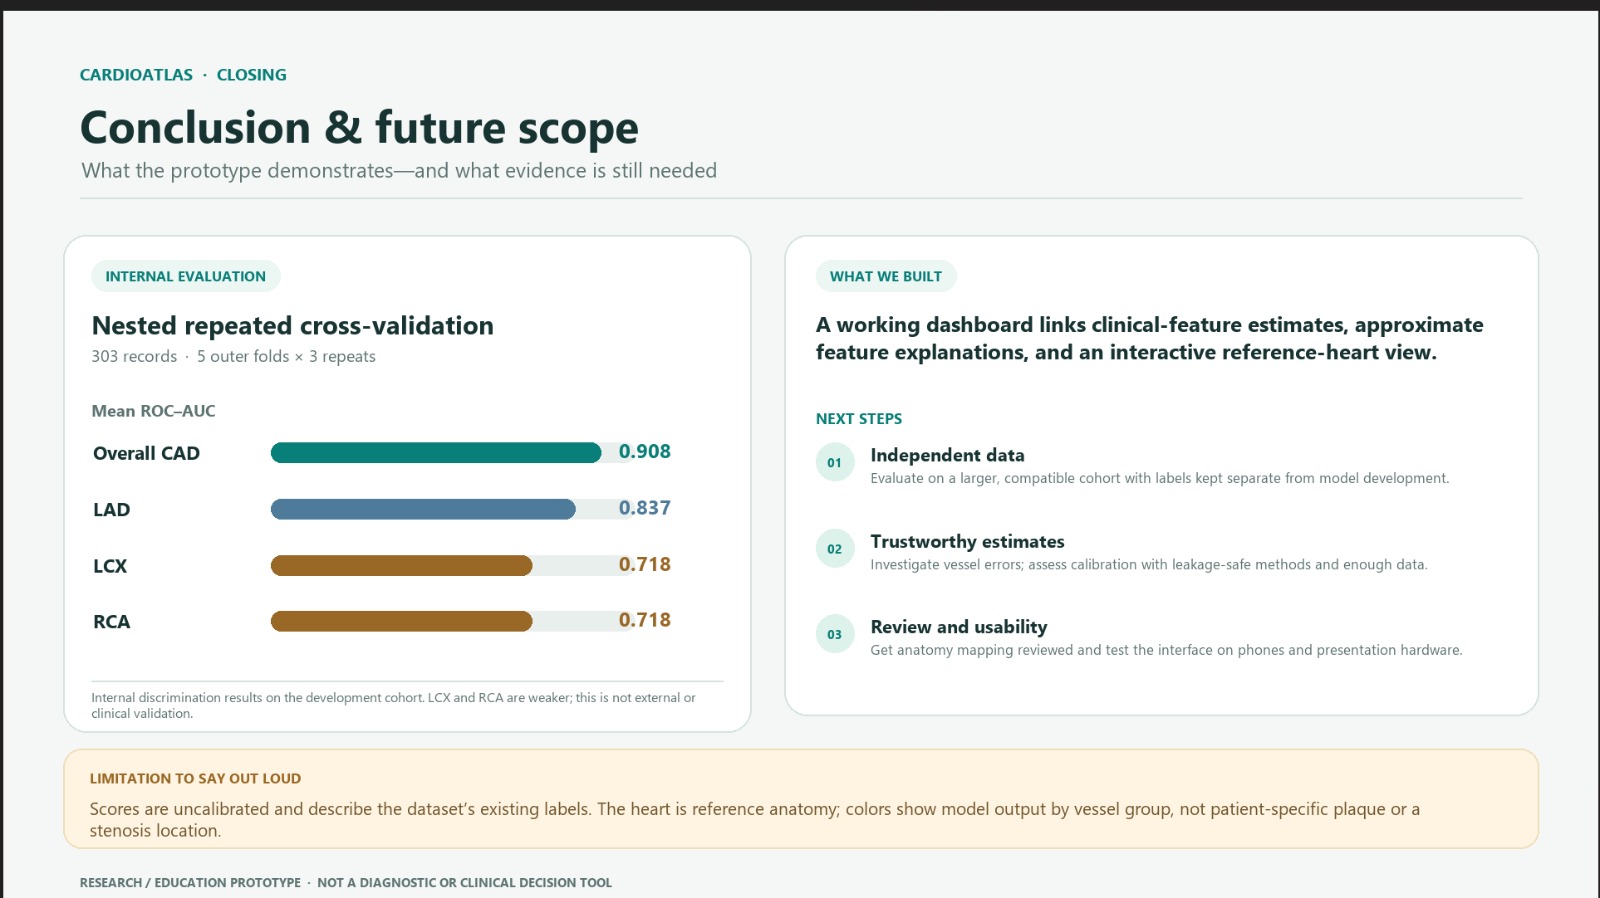
CardioAtlas conclusion highlights model performance, current limitations, and future validation, calibration, and usability improvements.
-
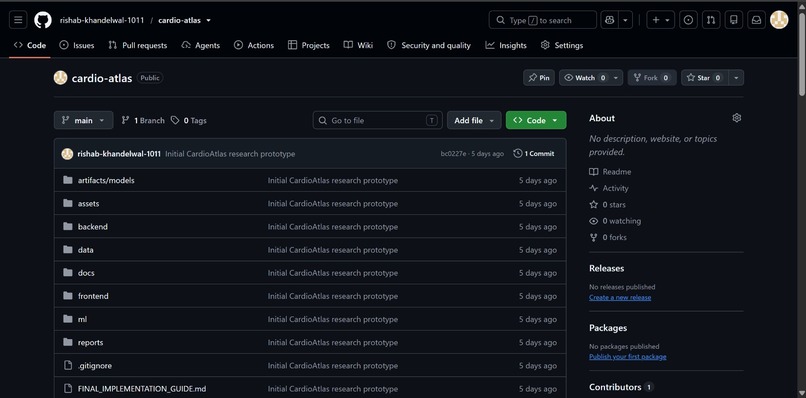
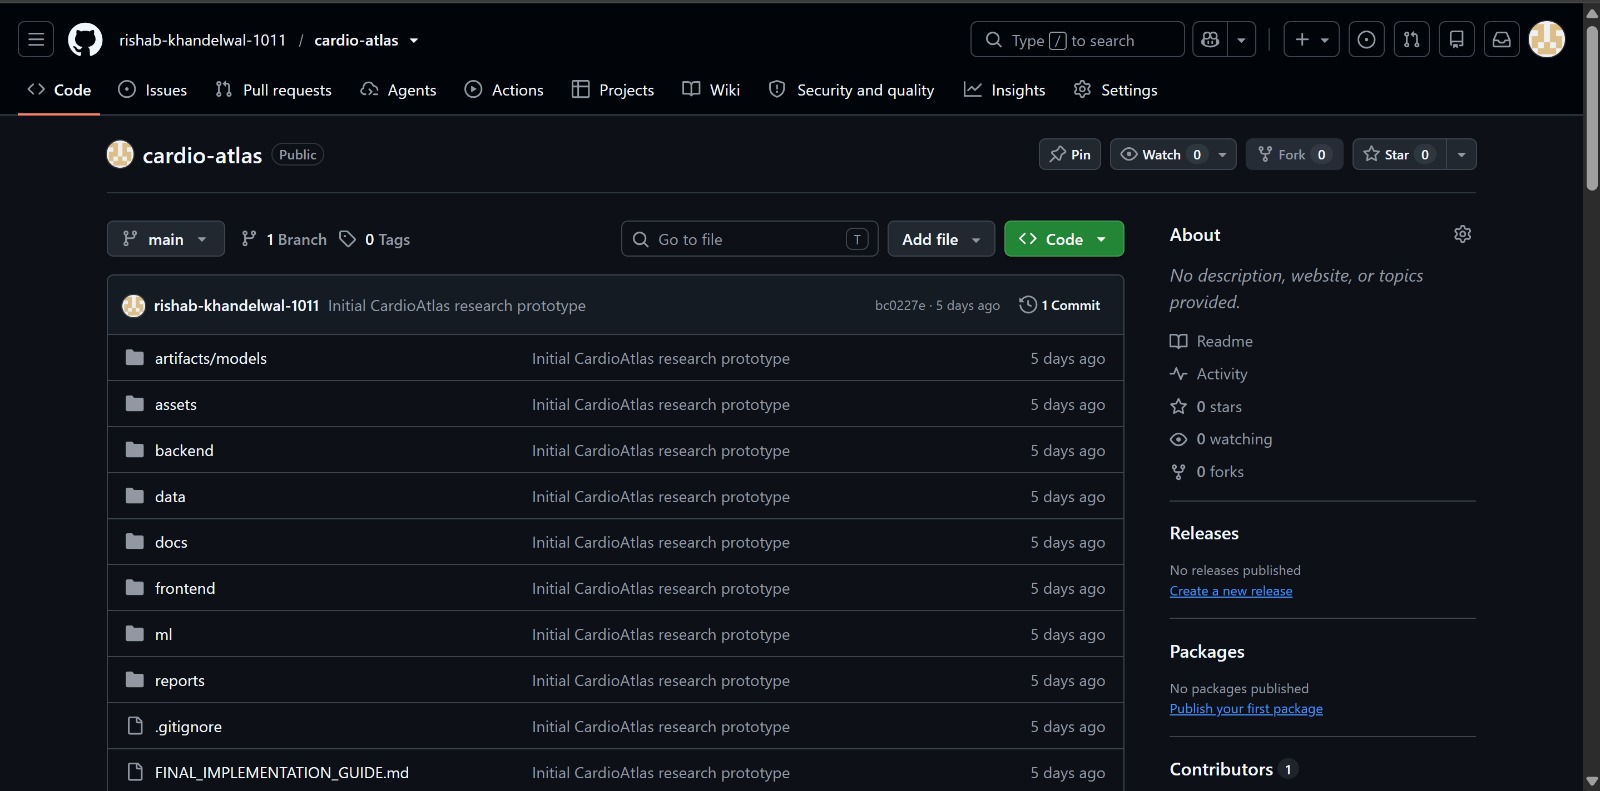
GitHub repository of CardioAtlas showing the project structure, including frontend, backend, ML models, datasets,assets and research reports
-
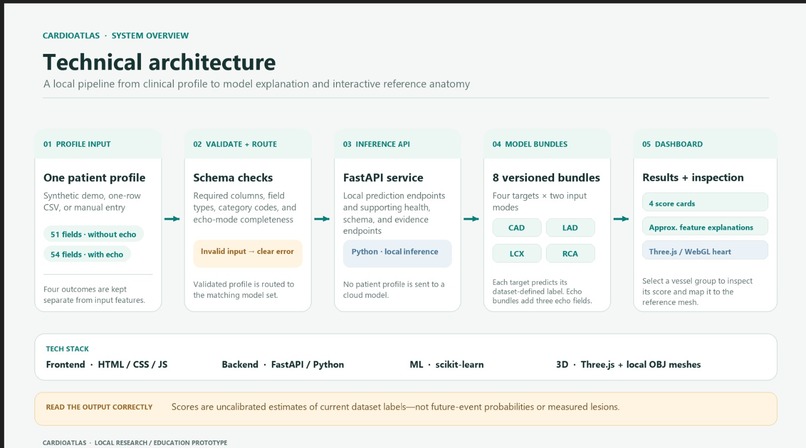
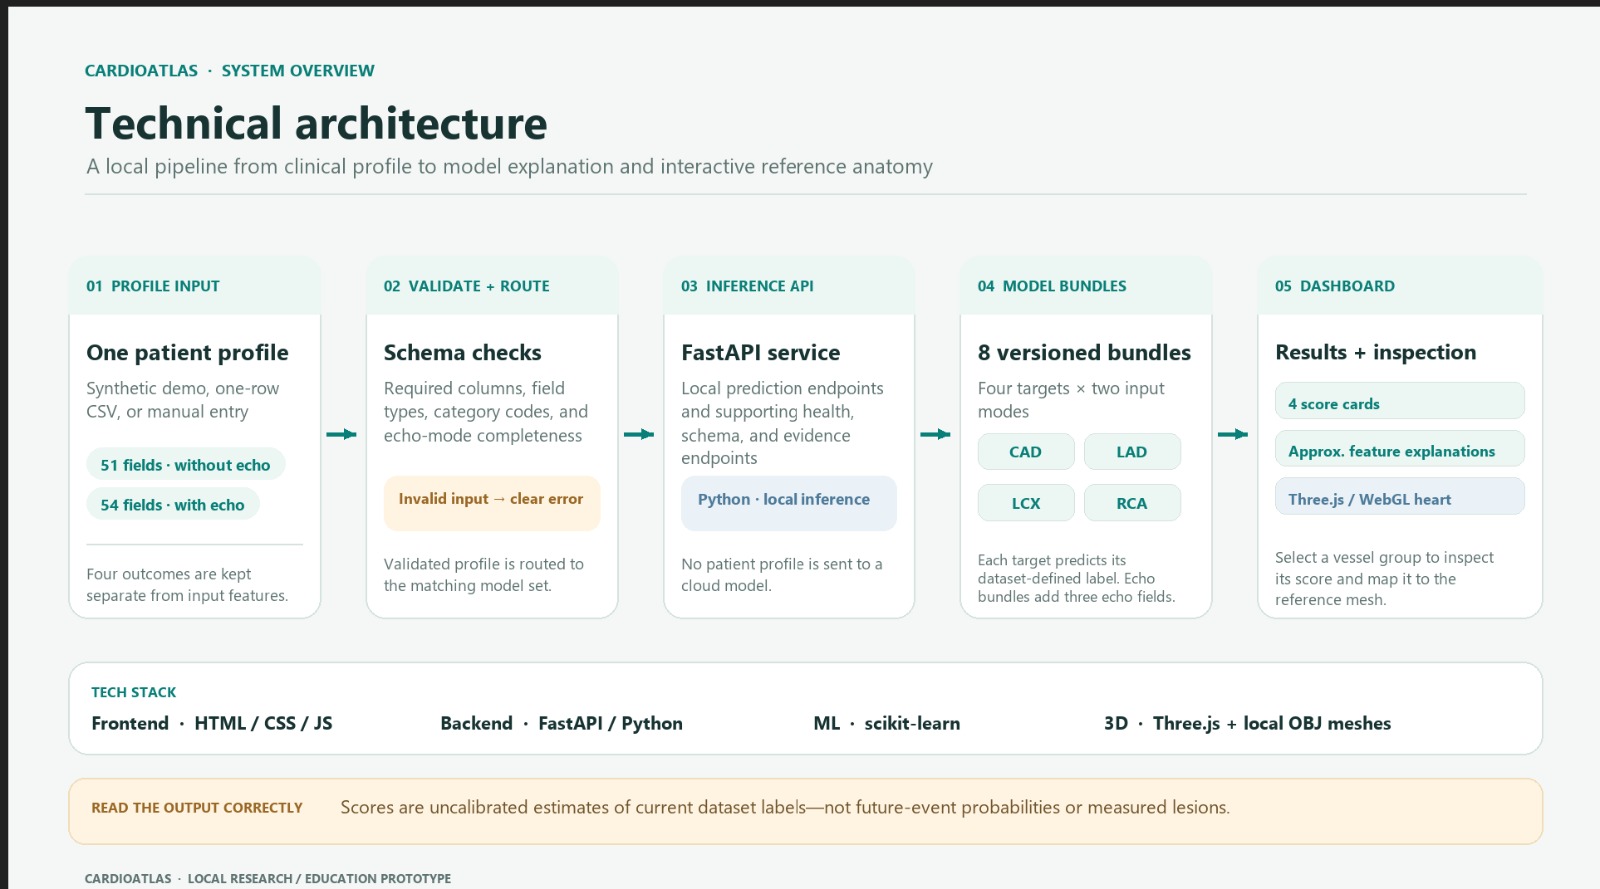
CardioAtlas technical architecture showing profile input, validation, FastAPI inference, ML models, and interactive 3D visualization.
-
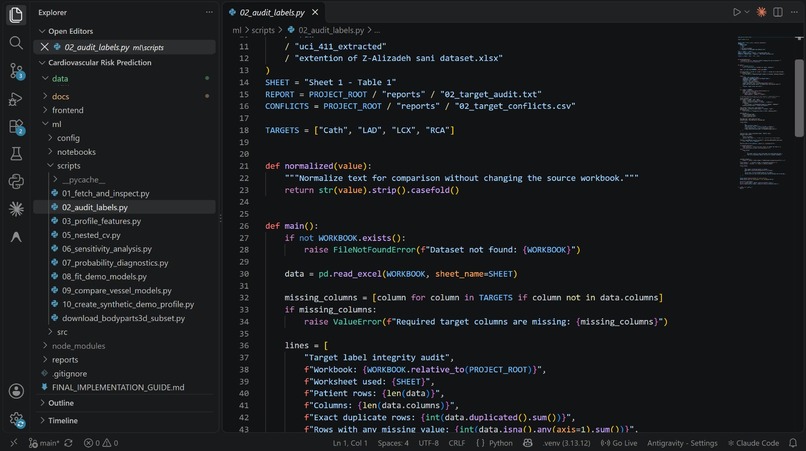
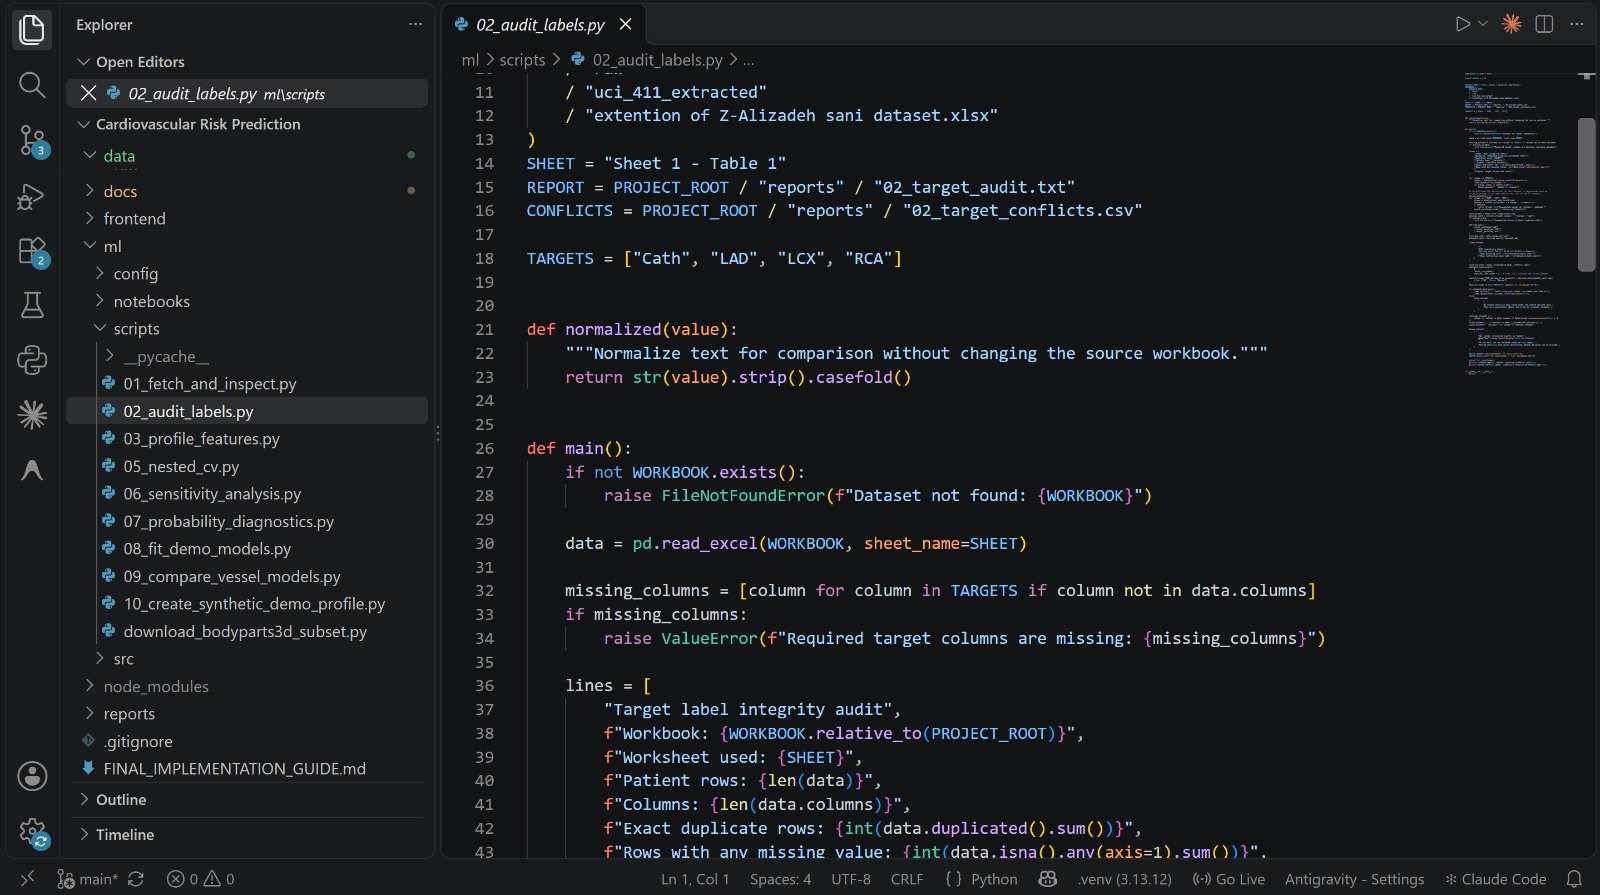
VS Code showing CardioVision’s Python scripts for data auditing, feature engineering, and ML model evaluation.
Inspiration
CardioAtlas began with a question: what if cardiovascular predictions could be understood through more than just numbers? While exploring machine learning for healthcare, we realized that predicting a condition is only one part of the problem. Understanding what influences a prediction and how it relates to the heart is equally important. We wanted to bring clinical data, AI explanations, and 3D visualization together in one place. That idea became CardioAtlas—a project through which we could explore how technology might make complex cardiovascular information easier to understand.
What it does
CardioAtlas is a cardiovascular prototype that estimates dataset-defined labels for coronary artery disease (CAD) and stenosis in three coronary arteries: LAD, LCX, and RCA. Machine Learning: Generates separate estimates for overall CAD and the three vessel-level labels. Interactive 3D Heart: Allows users to select and explore the corresponding coronary vessel groups on a reference anatomical model. Explainable AI: Shows which input features influence the model's outputs. CSV Input: Supports uploading clinical data in the expected format. Two Model Configurations: Supports inputs with and without the available echocardiographic features. Our aim is to connect clinical data, model predictions, and anatomical visualization rather than display isolated numbers.
How we built it
We started with the Z-Alizadeh Sani dataset, containing 303 records and 59 fields. We explored the data, performed preprocessing, and developed machine-learning models for four separate prediction targets. We used repeated, nested cross-validation to evaluate model performance and worked to prevent target leakage during preprocessing and model selection. Next, we connected the prediction pipeline to a web interface using a FastAPI service. We integrated a reference heart model using Three.js, allowing users to select mapped coronary vessel groups and explore their corresponding outputs. We also incorporated feature explanations to provide more context about the model's behaviour. Building these components separately was one thing; getting them to work together as a complete application was where much of our learning happened.
Challenges we ran into
Achieving reliable prediction accuracy: This was one of our biggest challenges. With only 303 records, achieving consistent performance across all four targets required repeated experimentation. We compared models, tuned their parameters, and evaluated them using repeated, nested cross-validation. Our results were stronger for CAD and LAD than for LCX and RCA, teaching us that improving accuracy also means understanding a model's limitations. Understanding coronary anatomy: Learning the medical terminology and anatomical roles of LAD, LCX, and RCA took time. We studied these structures to connect the model outputs to the appropriate vessel groups in the 3D visualization. These challenges taught us to be patient, investigate problems carefully, and keep improving instead of settling for a result that only looked good on the surface.
Accomplishments that we're proud of
We are proud to have brought several different components together into a working research prototype: machine-learning predictions, feature explanations, CSV input, and interactive 3D heart visualization. Our internal evaluation achieved a mean ROC-AUC of approximately 0.908 for CAD and 0.837 for LAD. LCX and RCA each achieved approximately 0.718. These results helped us identify both promising areas and targets that need further improvement. More than the scores, we are proud that we moved from an idea to an integrated application and learned how to connect machine learning with an interactive visual experience.
What we learned
This project taught us that building an AI solution involves much more than training a model. Data quality, evaluation, explainability, application integration, and honest communication of limitations all matter. We gained practical experience with clinical dataset preprocessing, machine-learning evaluation, FastAPI, and Three.js-based visualization. We also learned that a visually impressive prediction is not necessarily a reliable one, and that internal validation does not establish clinical readiness. Most importantly, we learned to treat unexpected results as opportunities to understand the problem better.
What's next for CardioAtlas
We want to continue improving CardioAtlas by evaluating the models on independent external datasets, investigating the weaker LCX and RCA results, obtaining independent review of the anatomical mappings, and improving the clarity of the feature explanations. Our long-term vision is to explore how explainable machine learning and interactive anatomical visualization can make complex cardiovascular data easier to interpret. CardioAtlas is still a research prototype, not a diagnostic tool, and there is more work to do before any clinical use could be considered.
For us, this project is more than a model or a 3D visualization. It is a learning journey that showed us how technology, persistence, and curiosity can come together to explore a real-world problem.
Built With
- 3d-visualization
- artificial-intelligence
- cad-classification
- cardiovascular-disease
- clinical-data
- coronary-artery-disease
- coronary-stenosis
- ecg
- echocardiography
- explainable-ai
- fastapi
- healthcare-ai
- heart-anatomy
- interactive-dashboard
- machine-learning
- medical-visualization
- model-evaluation
- predictive-modeling
- prototype
- scikit-learn
- shap
- tabular-data
- three.js
- uci-dataset
- webgl


Log in or sign up for Devpost to join the conversation.