-
-
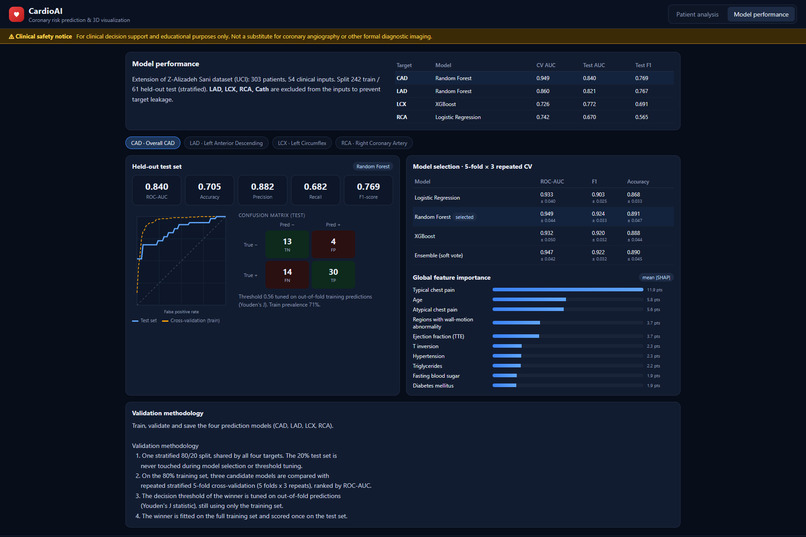
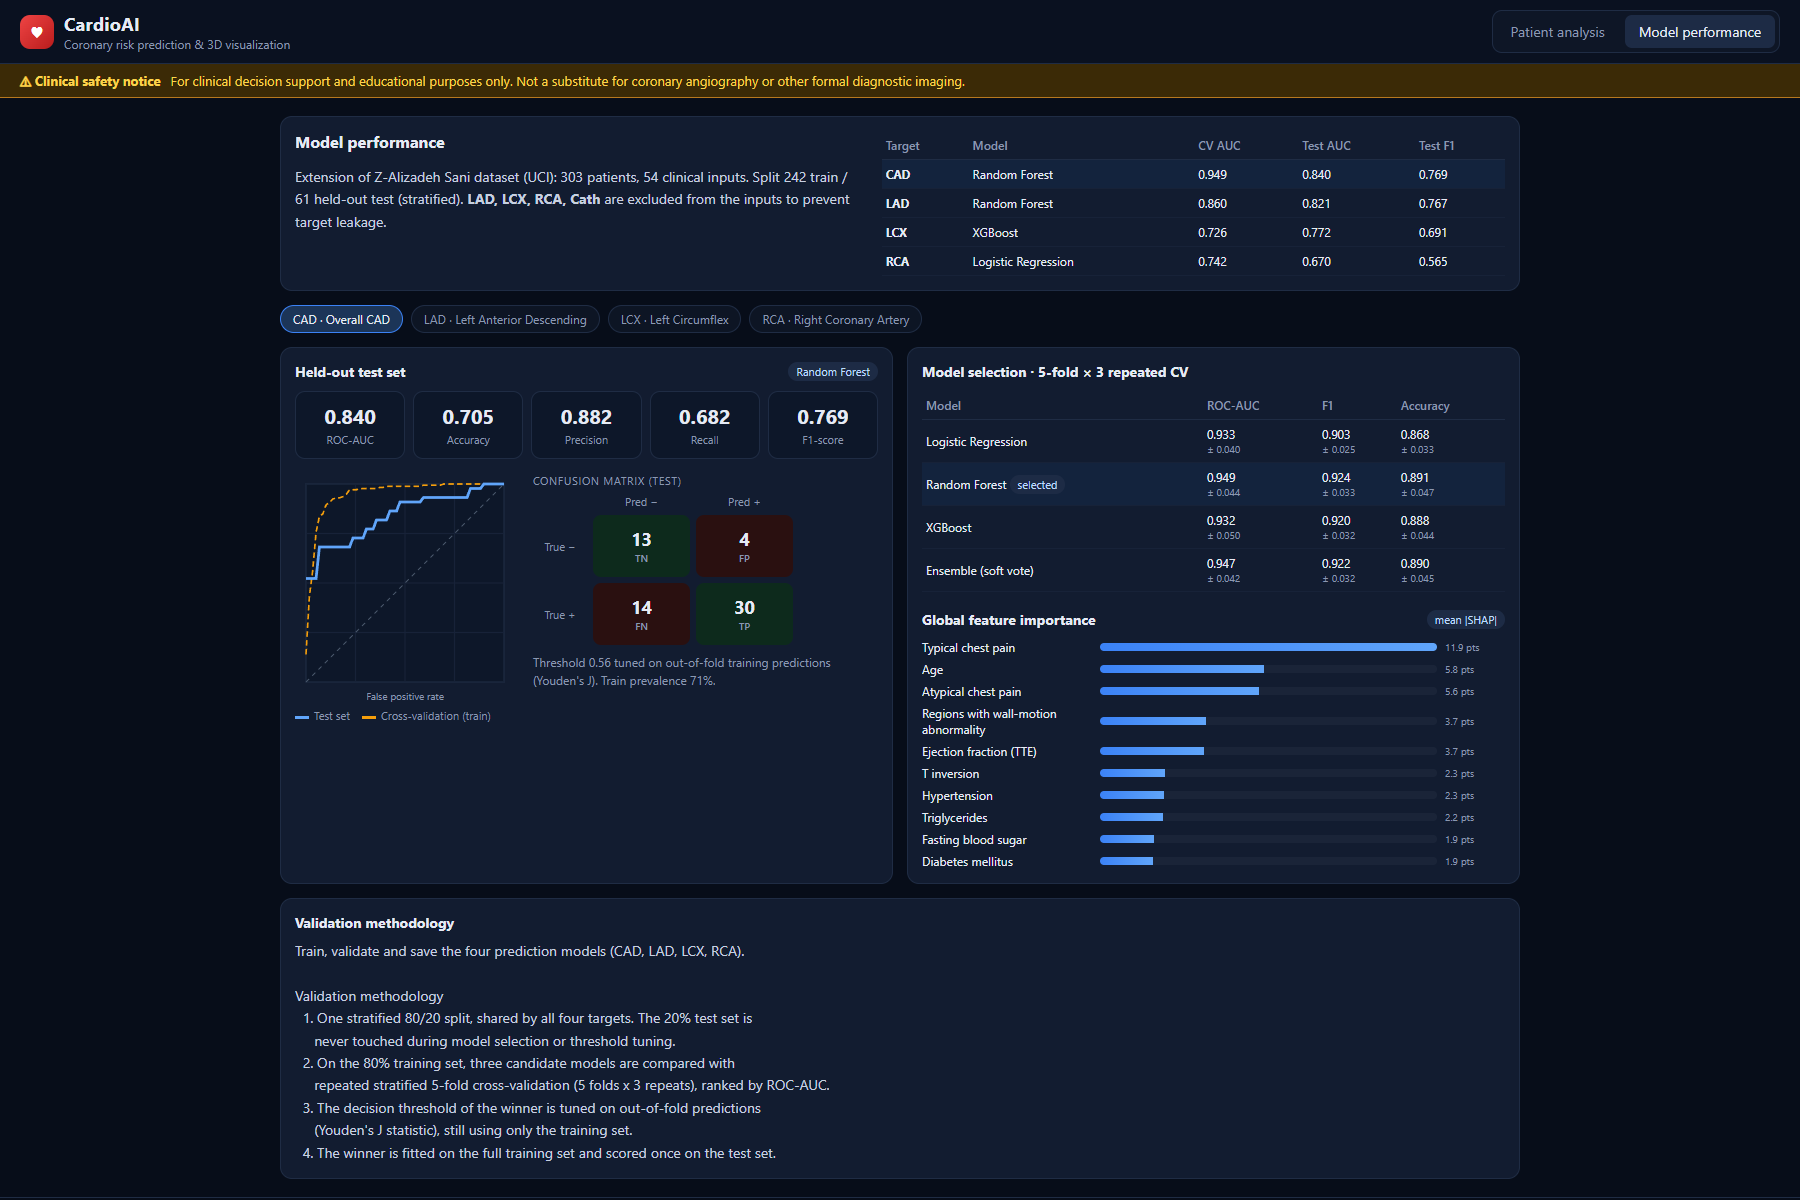
Model performance: ROC curve, confusion matrix, model comparison and feature importance
-
-
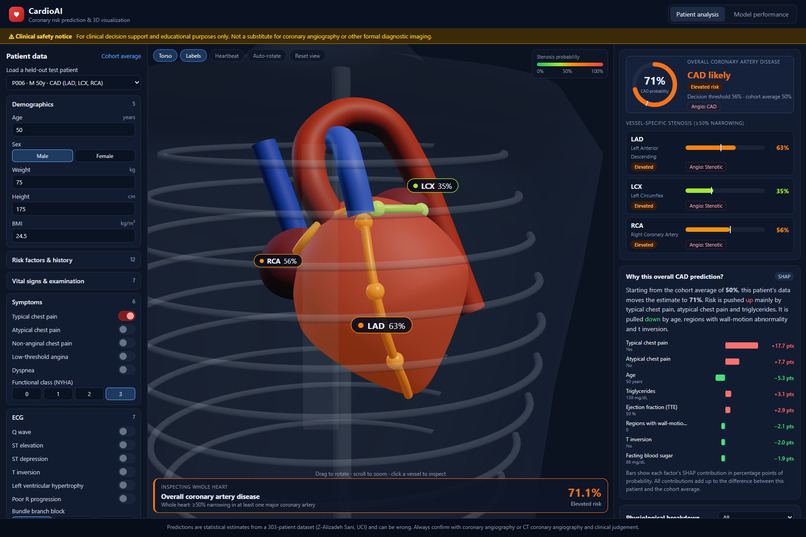
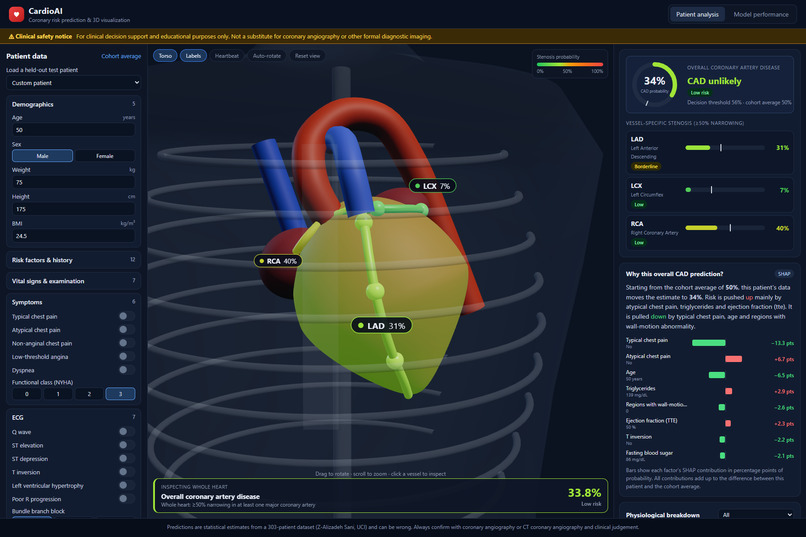
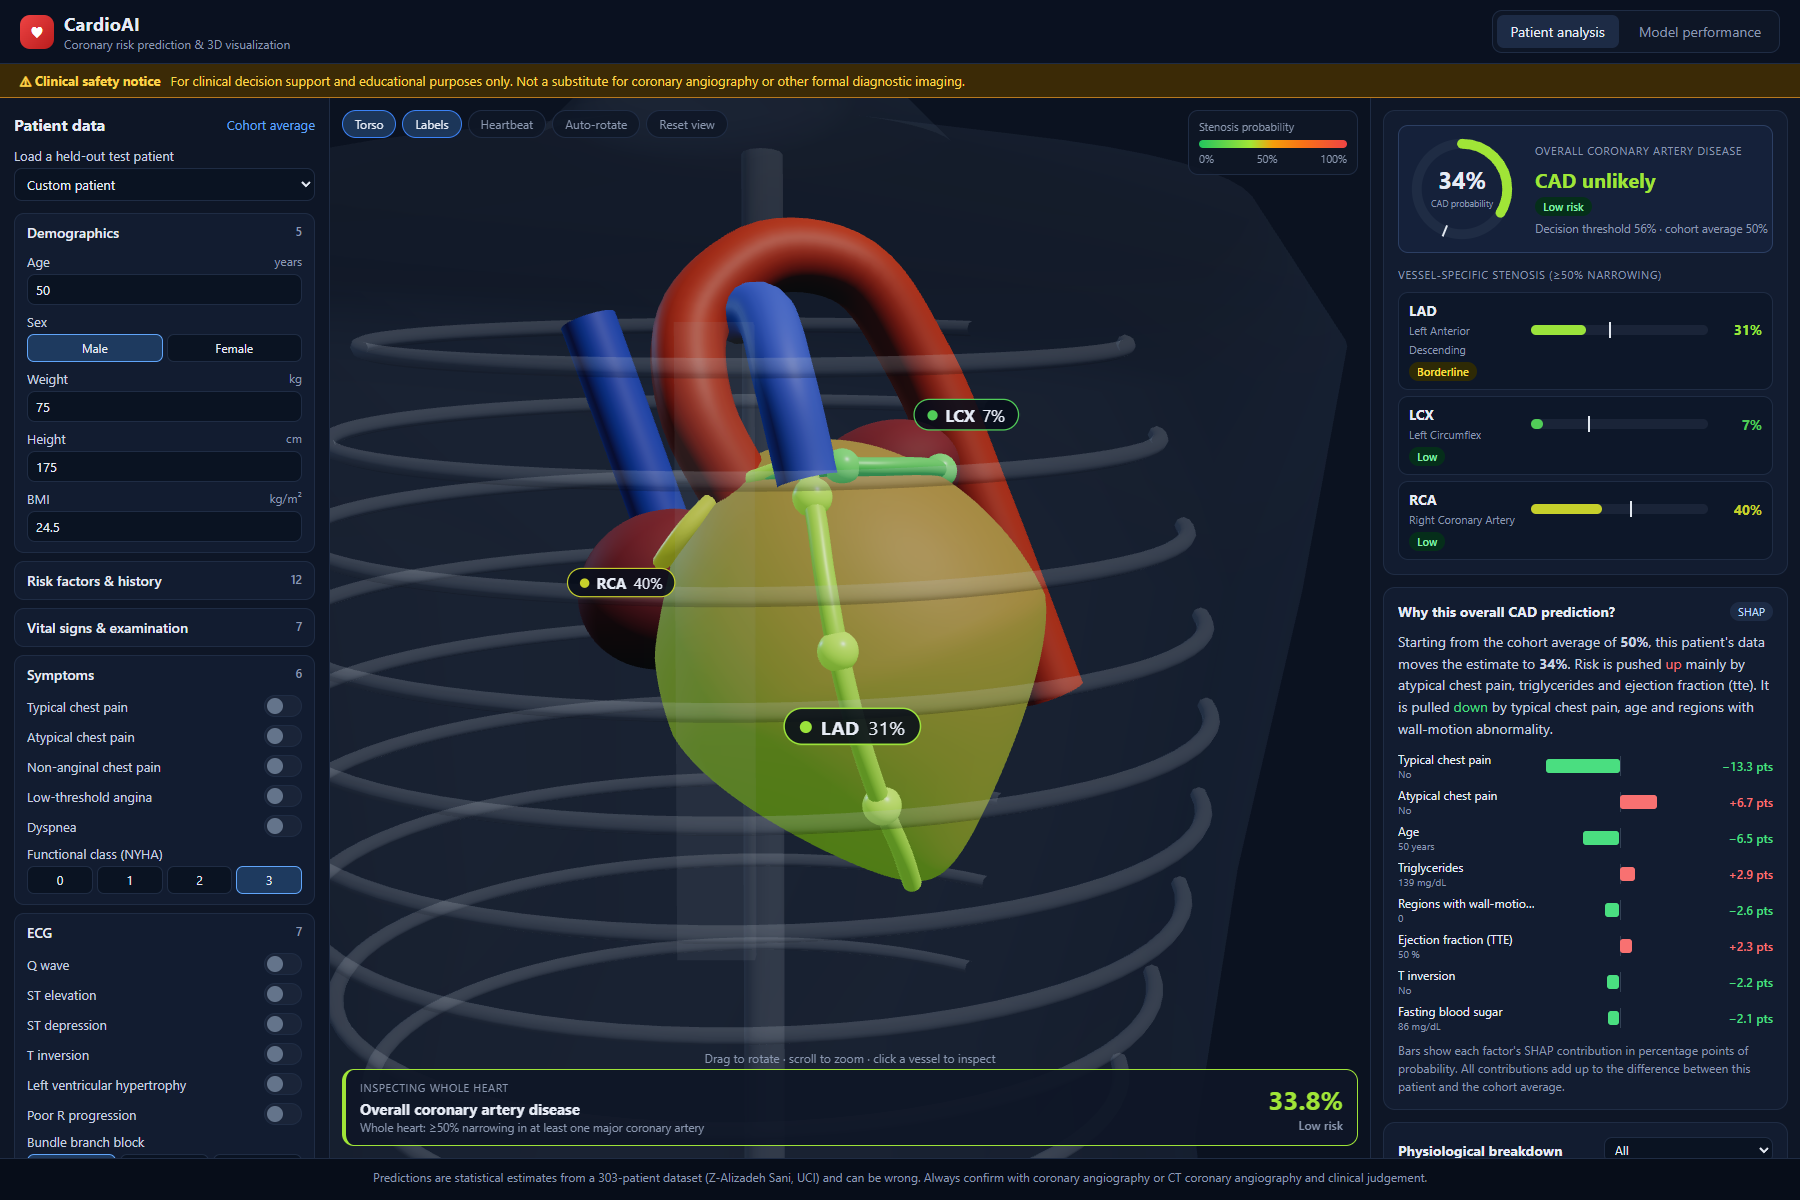
After turning off “typical chest pain”: CAD drops to 34% and the arteries turn green
-
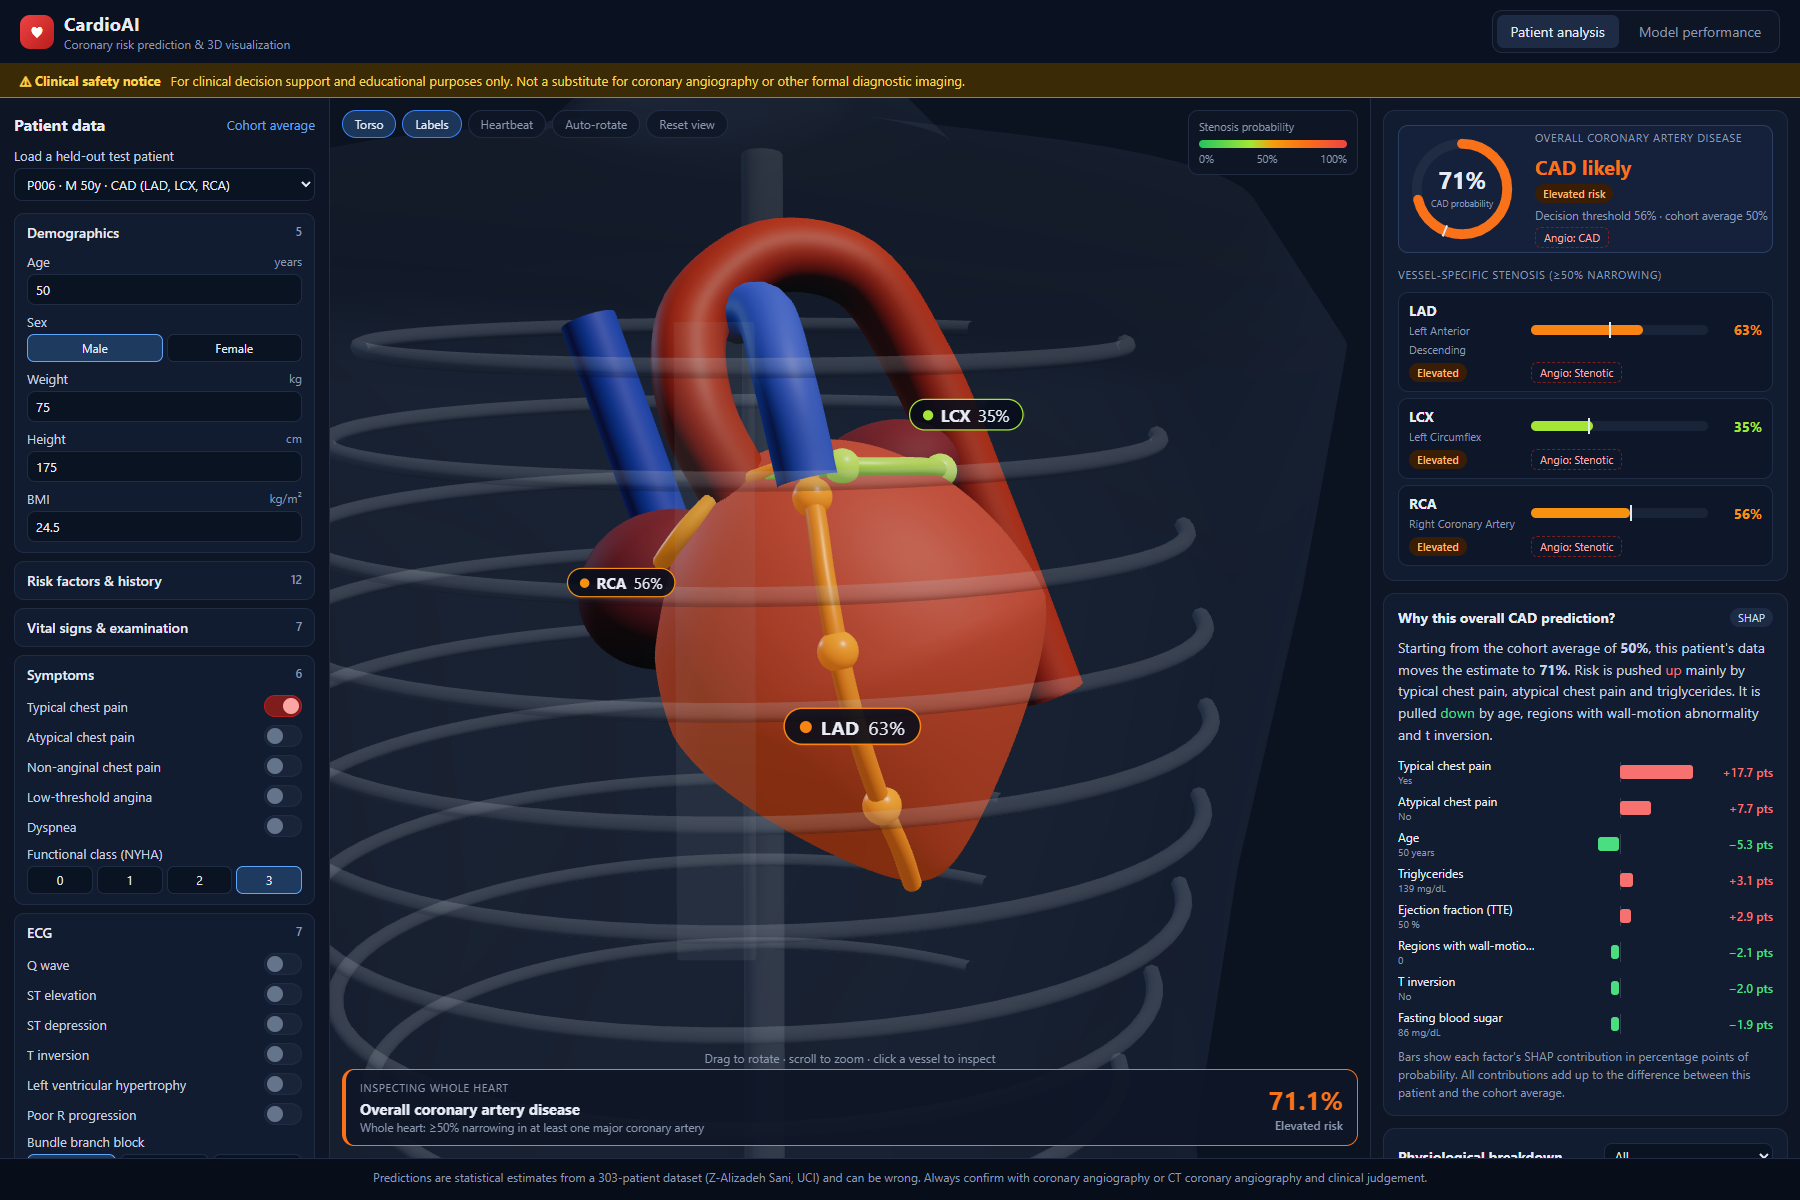
Dashboard
-
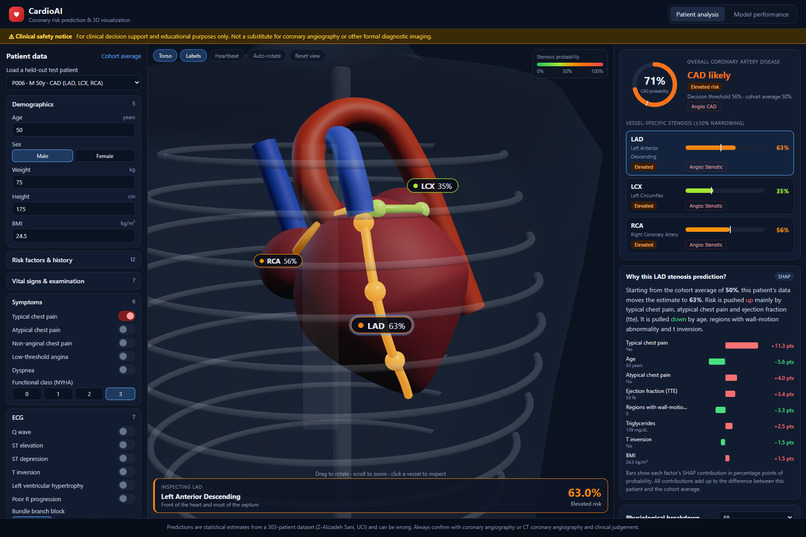
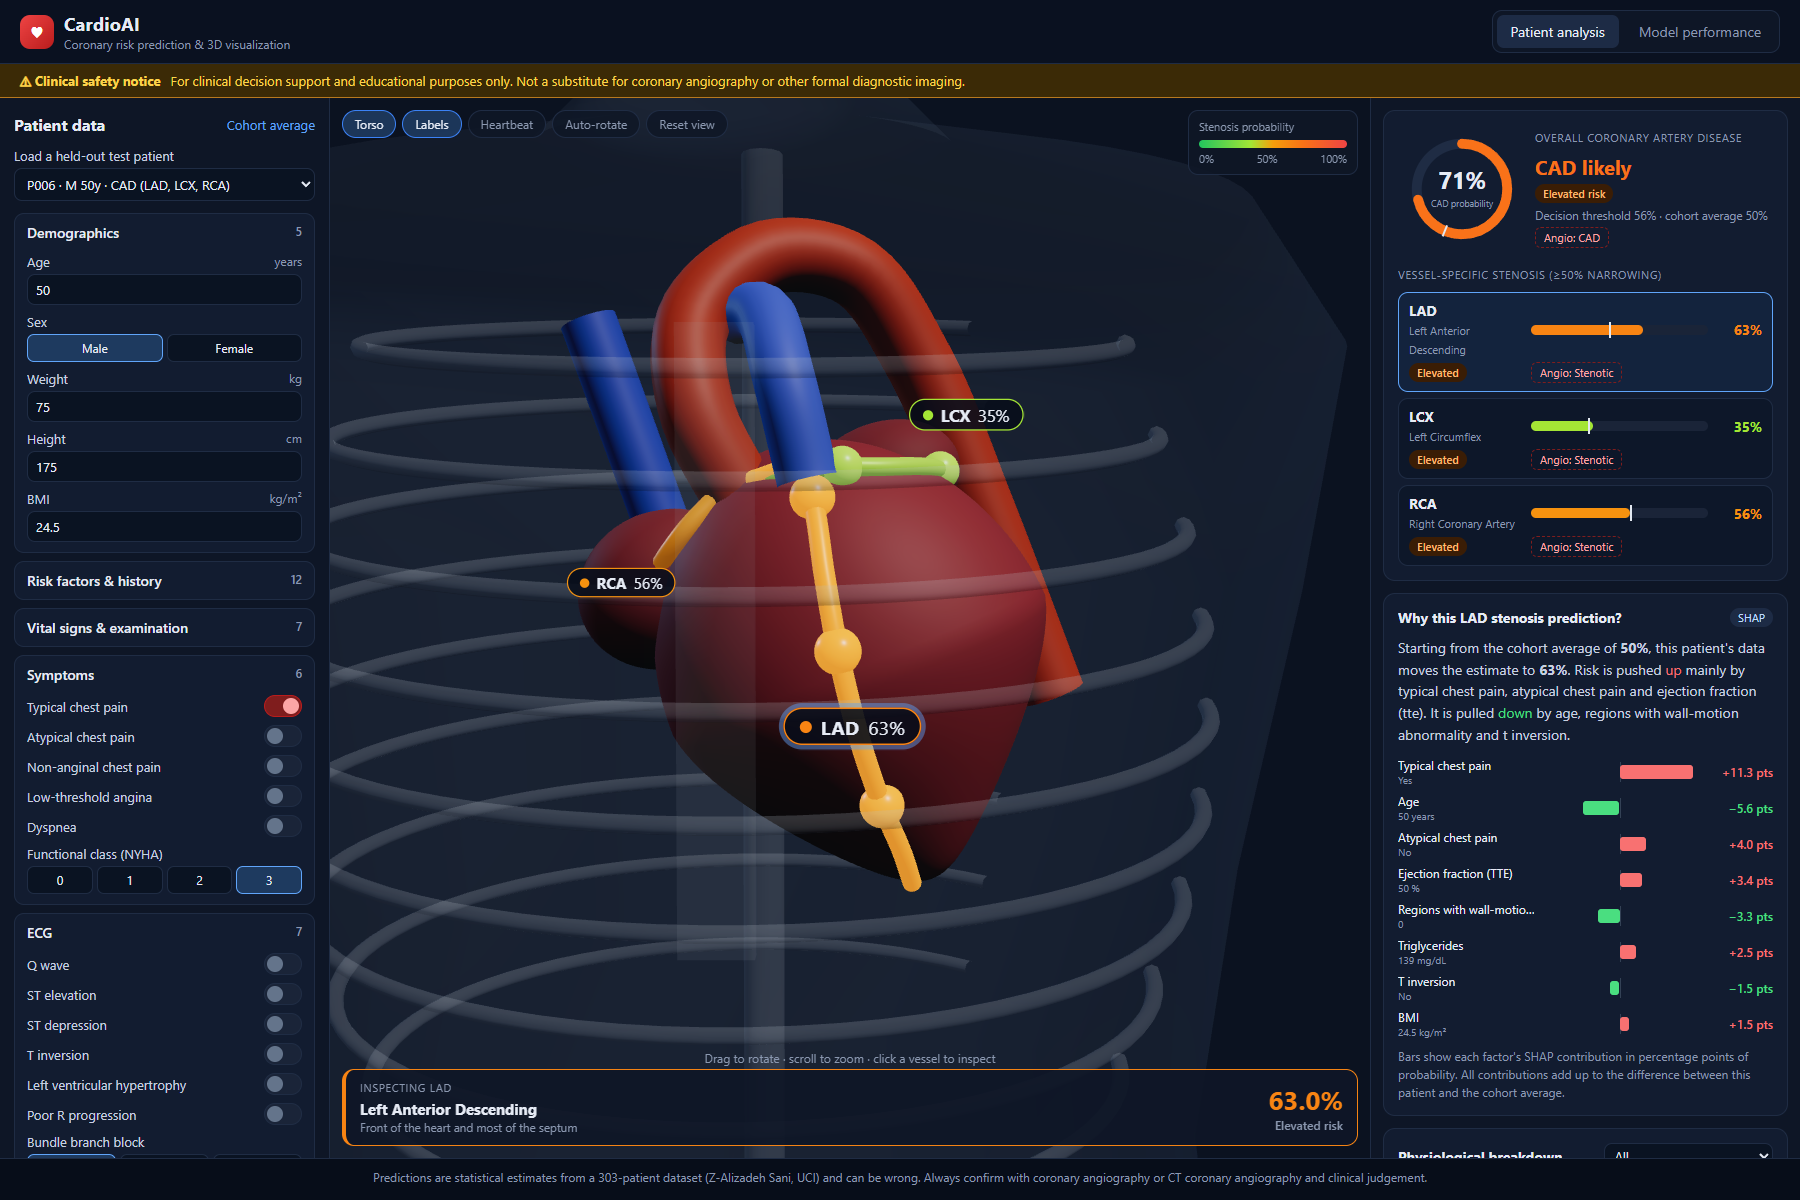
LAD artery selected, with its “Why this LAD prediction?” breakdown
Inspiration
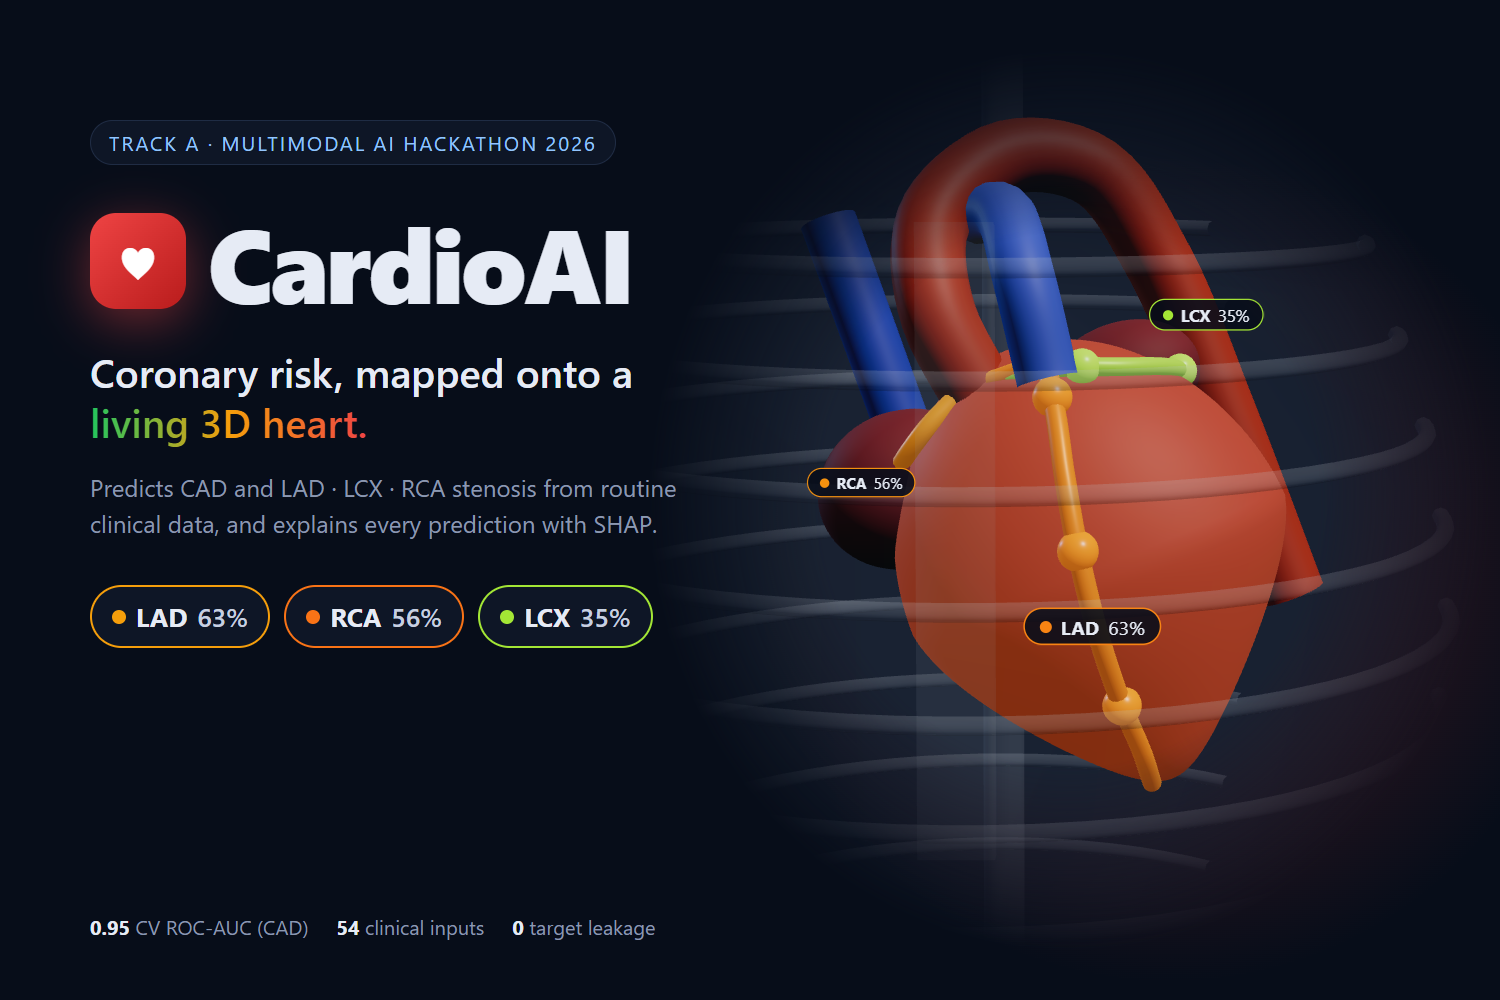
Cardiovascular disease is the leading cause of death worldwide. Risk calculators give a single percentage, but they don't show where in the heart the problem is likely to be, or why the model thinks so. We wanted a tool that turns clinical numbers into a picture a clinician or patient understands at a glance.
What it does
- Takes 54 routine clinical inputs: demographics, risk factors, vital signs, symptoms, ECG, labs and echocardiography.
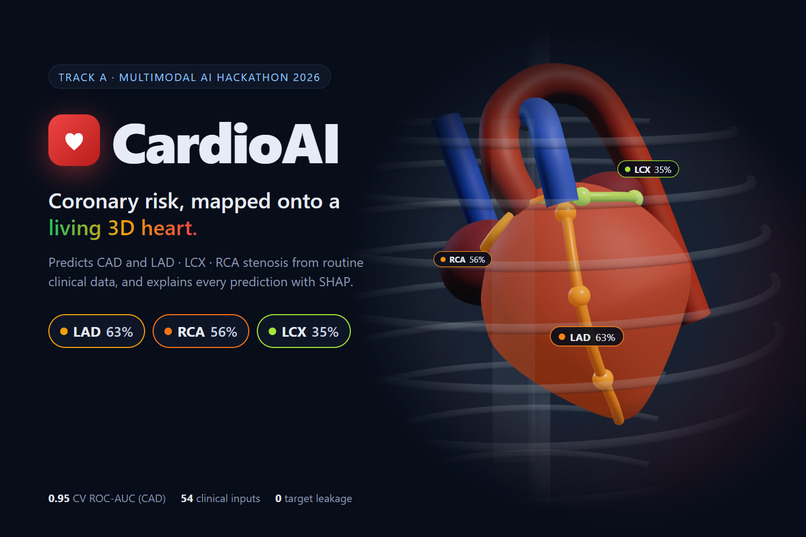
- Predicts overall CAD and stenosis in each of the three major coronary arteries (LAD, LCX, RCA).
- Colours each artery on an interactive 3D heart (green → amber → red) by its own predicted probability. Positive vessels pulse.
- Lets users rotate and zoom, hover for details, and click a vessel to inspect it. The heart beats at the patient's recorded pulse rate.
- Explains every prediction with SHAP values in percentage points, a plain-English summary, and a table comparing each measurement to the cohort's normal range.
- Updates everything in real time (~0.3 s) as inputs change.
- Includes a Model performance page with ROC curves, confusion matrices and model comparison.
- Shows a permanent clinical-safety disclaimer: decision support and education only, not a substitute for diagnostic imaging.
How we built it
- Data: Extension of the Z-Alizadeh Sani dataset (UCI, 303 patients). LAD, LCX, RCA and Cath are excluded from the inputs to prevent target leakage. This is enforced in code and by a unit test.
- Models: For each of the 4 targets, Logistic Regression, Random Forest, XGBoost and a soft-voting ensemble are compared with repeated stratified 5-fold CV. The best model by ROC-AUC is kept. Its decision threshold is tuned on out-of-fold predictions (Youden's J), and it is scored once on a 20% held-out test set.
- Explainability: SHAP Linear/Tree explainers, rescaled so the contributions add up exactly to the predicted probability minus the cohort average.
- Backend: FastAPI (Python).
- Frontend: React + React Three Fiber (Three.js/WebGL). The heart and coronary anatomy are generated procedurally. The arteries follow the real anatomical grooves, so the model outputs always map to the right vessel. It runs smoothly without a dedicated GPU.
Results (held-out test set, 61 unseen patients)
| Target | Model | CV ROC-AUC | Test ROC-AUC | Test F1 |
|---|---|---|---|---|
| CAD | Random Forest | 0.949 | 0.840 | 0.769 |
| LAD | Random Forest | 0.860 | 0.821 | 0.767 |
| LCX | XGBoost | 0.726 | 0.772 | 0.691 |
| RCA | Logistic Regression | 0.742 | 0.670 | 0.565 |
Challenges we ran into
- With only 303 patients, the results have high variance. We used repeated CV and kept the test set untouched so the numbers are honest.
- Predicting the specific vessel from non-imaging data is hard by nature, especially for RCA.
- We wanted the 3D anatomy to be anatomically meaningful, light enough for laptops, and free of mesh licensing issues.
- SHAP values in log-odds are not intuitive for clinicians, so we converted them to probability points.
Accomplishments that we're proud of
- An end-to-end system: from a raw Excel file to live, explainable 3D predictions.
- Strict leakage prevention and an honest validation methodology.
- Explanations a non-technical person can read.
What we learned
- Validation design matters more than model choice on small clinical datasets.
- Explainability needs a translation layer before it is useful to clinicians.
What's next
- Validate on external, multi-centre datasets.
- Add imaging inputs, such as CT angiography, for lesion localisation within each vessel.
- Use high-fidelity anatomical meshes (BodyParts3D).
Built With
- fastapi
- python
- react
- scikit-learn
- shap
- three.js
- xgboost


Log in or sign up for Devpost to join the conversation.