-
-
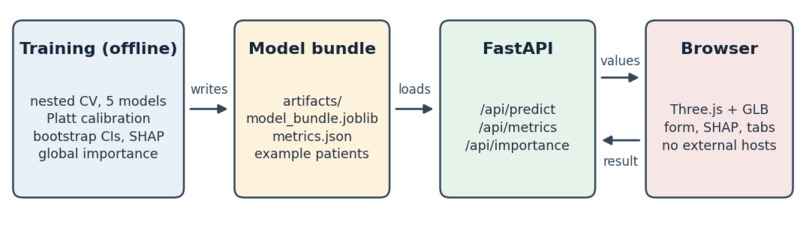
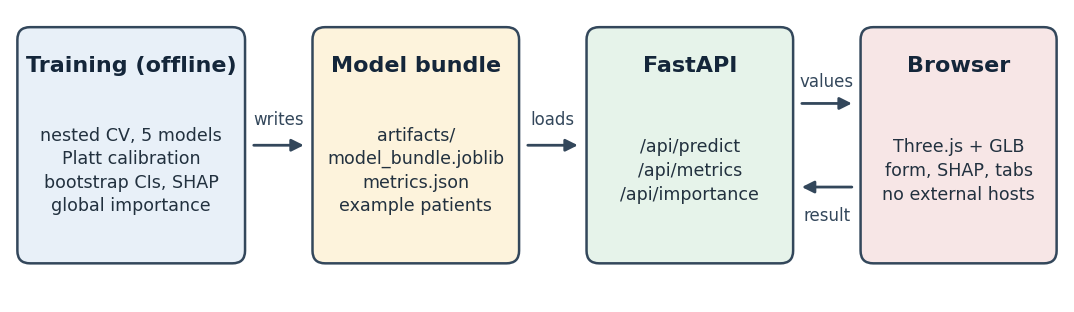
Training runs offline and saves one bundle; the service loads it once. Each edit in the form is debounced by 350 ms and sends one request;
-
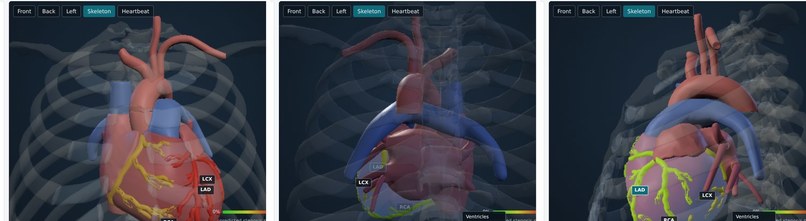
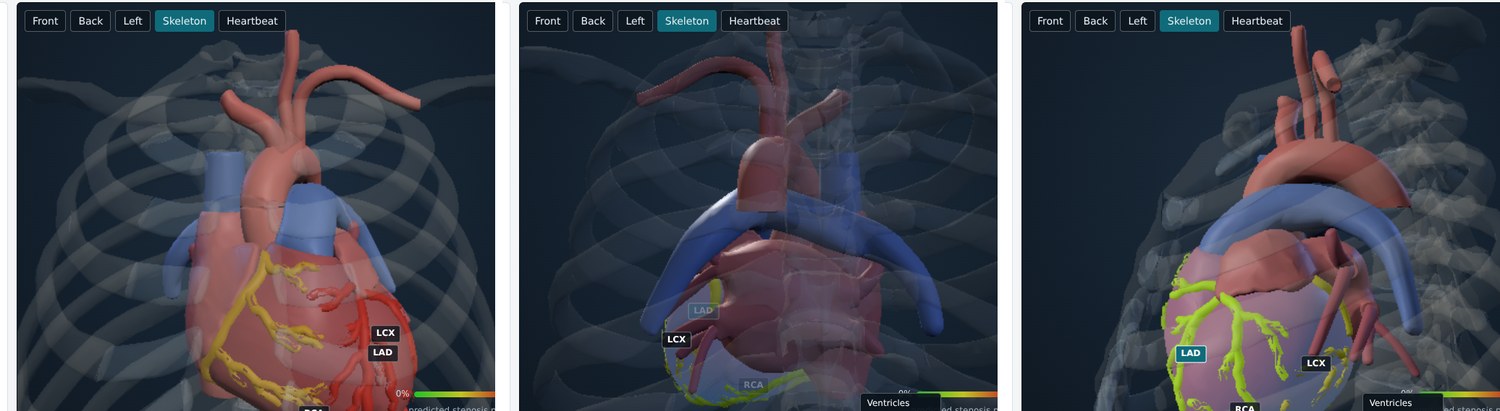
Front, back and left views of patient #174 (CAD-positive in the dataset). Arteries are coloured by predicted stenosis probability.
-
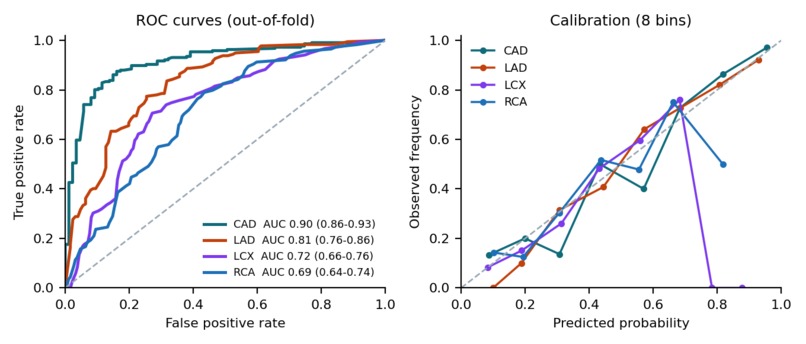
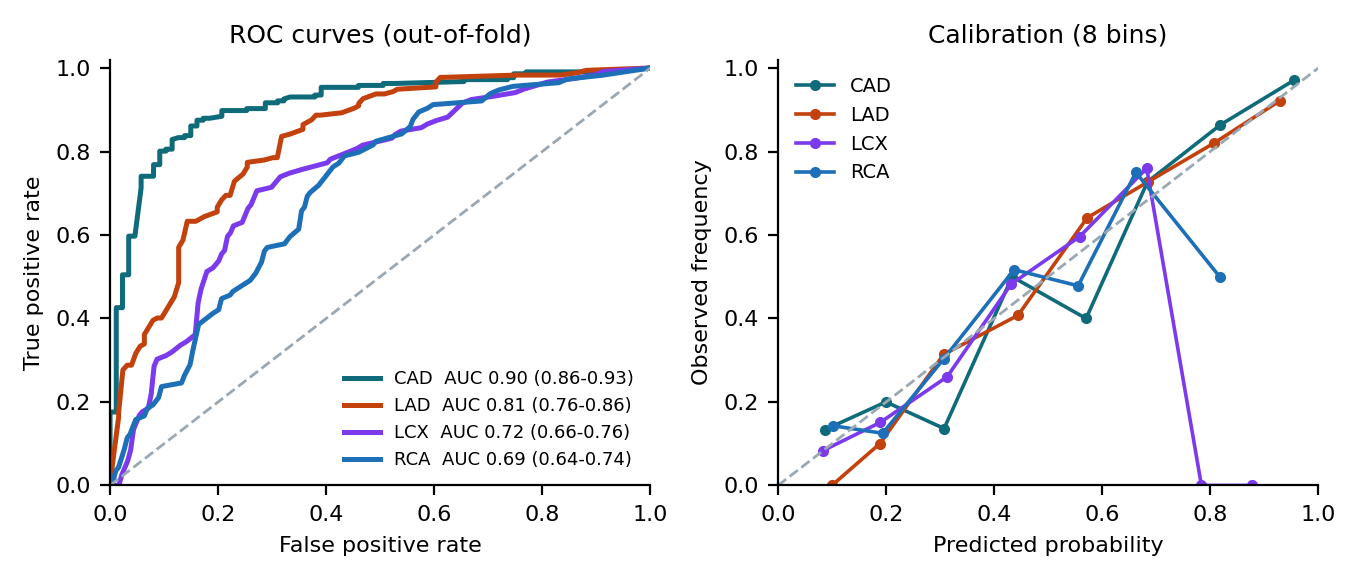
Out-of-fold ROC curves and calibration for the four targets
-
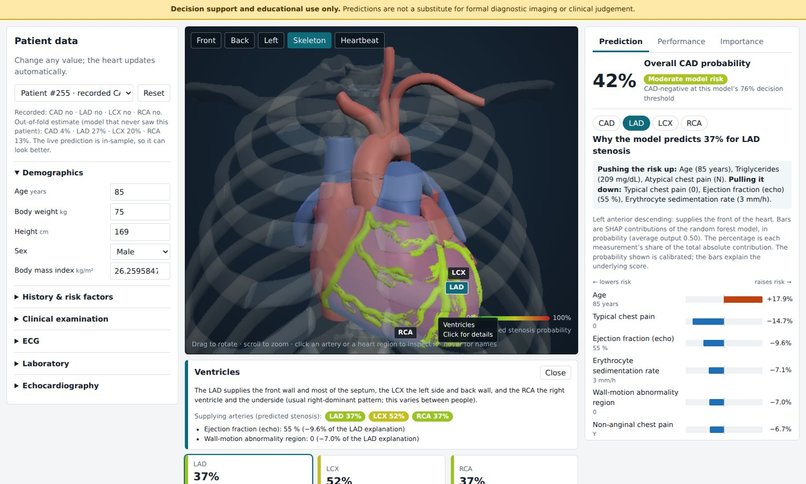
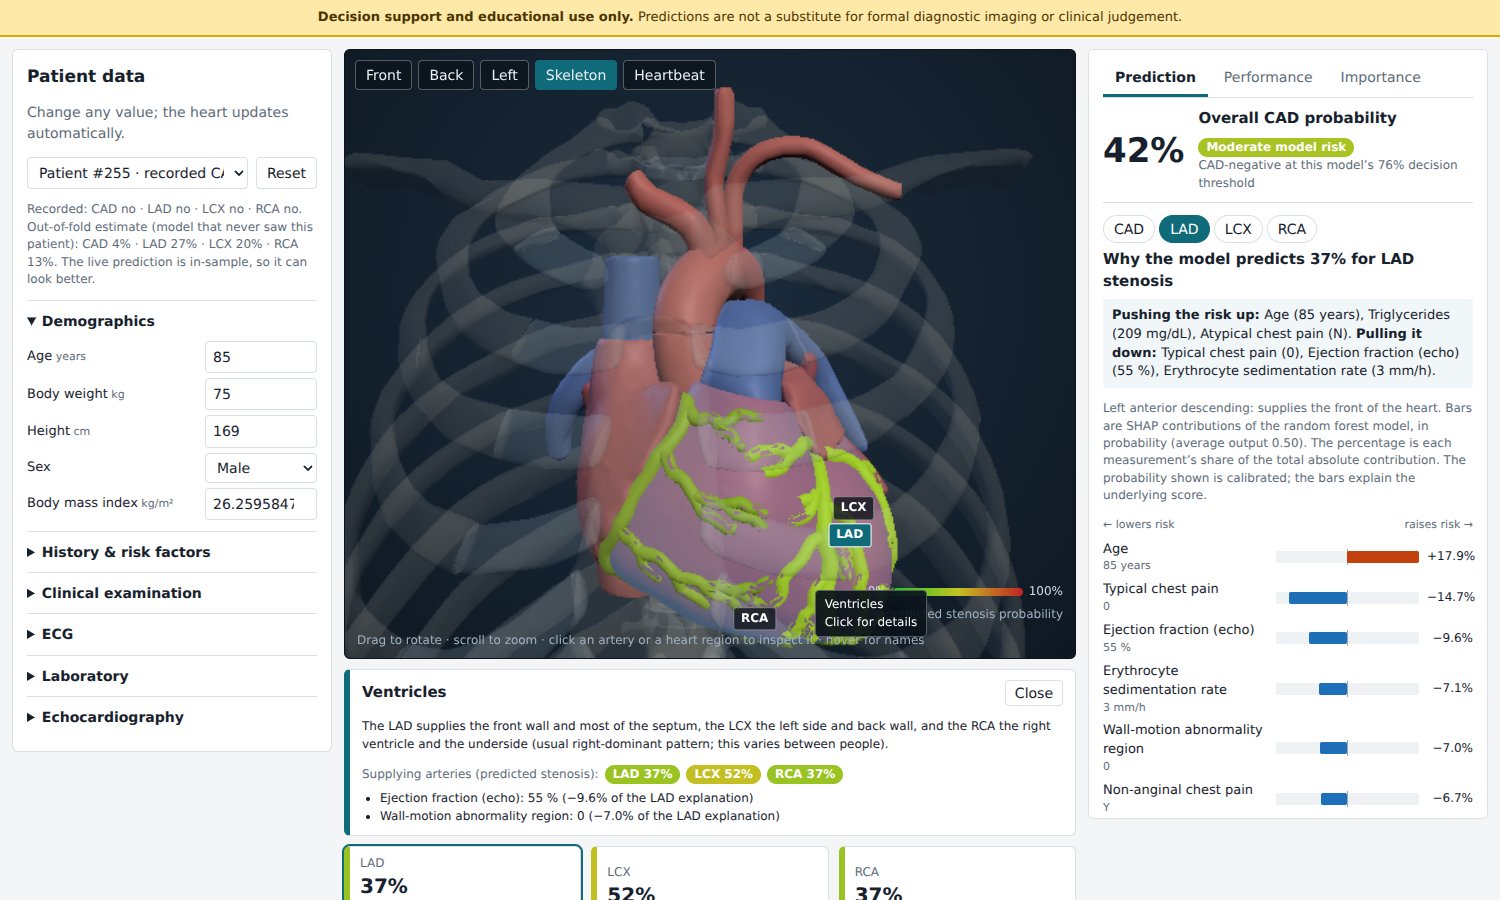
Dashboard with the ventricle region selected and the LAD explanation open (patient #255, with Age edited to 85 in the form)
Inspiration
Cardiovascular disease is difficult to communicate through tables of clinical measurements alone. A prediction such as a probability of coronary artery disease can be useful, but it becomes much easier to understand when the result is connected to the anatomy it describes.
That idea inspired Cardio3D: instead of presenting cardiovascular predictions as numbers alone, we wanted to make them visual, interpretable, and anatomically connected.
We built an interactive 3D heart where predicted stenosis probabilities for the LAD, LCX, and RCA are painted directly onto the corresponding coronary arteries. Alongside the 3D visualization, Cardio3D explains which clinical measurements contributed to each prediction using SHAP.
The project was developed for Track A: Cardiovascular Risk Visualization & Prediction, using the UCI Extension of Z-Alizadeh Sani dataset containing 303 patients and 55 usable clinical input features after removing leakage-prone columns.
Live Demo: https://cardio3d.onrender.com/ GitHub Repository: https://github.com/SoumyadeepChattopadhyay2004/Cardio3D
Important: Cardio3D is an educational and decision-support prototype, not a diagnostic system. Its predictions have not been externally validated and should not replace clinical judgment or medical testing.
What We Learned
The most important lesson was that building a machine-learning application is not simply about obtaining a high accuracy number.
We learned how important it is to design the entire evaluation pipeline correctly. Because the dataset contains only 303 patients, we used repeated nested 5-fold cross-validation. Model selection happens inside the training folds so that the test patients remain unseen.
We also learned about:
- Data leakage prevention and why target-related variables must never enter the feature matrix.
- Probability calibration using Platt scaling rather than treating raw classifier scores as reliable probabilities.
- Threshold selection, because a universal 0.5 threshold is not necessarily appropriate for every target.
- SHAP explanations for both linear and tree-based models.
- Combining machine learning, explainability, backend APIs, and 3D visualization into one application.
- Designing interfaces that communicate uncertainty instead of hiding it.
One particularly useful insight was that model performance depends heavily on the information available in the dataset. CAD and LAD produced stronger signals than LCX and RCA, while the latter remained comparatively difficult to predict. Rather than hiding this limitation, Cardio3D exposes it through the Performance dashboard.
How We Built It
Cardio3D is built as a Python-backed web application with an interactive Three.js frontend.
1. Data and machine learning
We use the UCI Extension of Z-Alizadeh Sani dataset and process demographic, medical-history, examination, ECG, laboratory, and echocardiography features.
The system predicts four targets independently:
- Overall coronary artery disease (CAD)
- LAD stenosis ≥50%
- LCX stenosis ≥50%
- RCA stenosis ≥50%
Before training, leakage-prone variables such as LAD, LCX, RCA, Cath, and CAD are explicitly removed from the model inputs and checked through automated assertions and tests.
We compare several classical machine-learning models:
- L2 Logistic Regression
- L1 Logistic Regression
- Random Forest
- Extra Trees
- Gradient Boosting
Model selection occurs inside the nested cross-validation procedure. The selected models are then calibrated using Platt scaling.
2. Explainability
Prediction alone is not enough for this application.
For every prediction, Cardio3D generates SHAP-based explanations showing which measurements pushed the model's output higher or lower.
The interface provides three levels of explanation:
- Plain-language summary of the strongest factors.
- Per-measurement SHAP contributions, including the patient's value, unit, direction, and relative contribution.
- Global feature importance aggregated across 150 patients.
For tree-based models we use TreeExplainer, while linear models use LinearExplainer.
We also map encoded features back to their original clinical measurements so that the explanation remains understandable.
3. 3D cardiovascular visualization
The anatomical visualization uses BodyParts3D 4.0 anatomy converted into a GLB model and rendered using Three.js.
The 3D viewer contains 139 named anatomical parts, including multiple segments representing the LAD, LCX, and RCA.
Each coronary artery receives a color based on its predicted probability. Users can:
- Rotate and zoom the heart.
- Switch between front, back, and left views.
- Hover over anatomical structures.
- Select individual coronary arteries.
- Select heart regions.
- Toggle skeleton visibility.
- Toggle a heartbeat animation.
- View the corresponding prediction and explanation.
The same probability-to-color function is used by the dashboard and the 3D model, and automated browser tests verify that the rendered vessel colors correspond to the underlying probabilities.
4. Backend and frontend
The backend is implemented with FastAPI.
The model bundle is loaded once by the service, and the browser communicates with it through endpoints such as:
GET /api/schema
GET /api/samples
GET /api/metrics
GET /api/importance
POST /api/predict
The frontend dynamically generates the clinical input form from the model schema, meaning that the interface does not have to be manually rewritten whenever the feature schema changes.
Predictions are requested after a short 350 ms debounce, and stale responses are discarded to prevent outdated predictions from overwriting newer ones.
The application also works without relying on a CDN or external web fonts, making the deployment more self-contained.
Challenges We Faced
Preventing data leakage
This was one of the biggest technical challenges.
The vessel stenosis labels and catheterization outcome are directly related to the prediction targets. Allowing them into the feature matrix could produce artificially strong results.
We therefore implemented an explicit leakage guard in the data pipeline and added tests that verify that these columns cannot enter the fitted pipelines.
Evaluating a small dataset honestly
With only 303 patients, obtaining a seemingly impressive score is relatively easy if the evaluation protocol is not carefully designed.
Instead, we used repeated nested cross-validation, cross-fitted calibration, per-target threshold selection, and patient-level bootstrap confidence intervals.
This made the evaluation more computationally demanding, but it gave us a much more defensible estimate of model performance.
Connecting ML probabilities to anatomy
The machine-learning output and the 3D model are fundamentally different systems: one produces numerical probabilities while the other manipulates anatomical meshes.
We had to create a consistent mapping between GLB groups and the three target arteries and ensure that every relevant artery segment received the correct probability.
We also had to make sure the visualization did not imply information that the dataset does not contain. Because the dataset does not provide lesion locations, Cardio3D displays a whole-vessel probability rather than inventing a specific blockage location.
Making explanations understandable
Raw SHAP values are not particularly useful to a general user.
We therefore built a glossary containing descriptions and units for the clinical variables and converted the model's numerical contributions into signed visual bars and plain-language summaries.
Keeping the 3D interface responsive
Interactive 3D visualization can become expensive in a browser, especially on machines without a dedicated GPU.
Cardio3D therefore renders on demand, lowers rendering resolution while the user is dragging, avoids unnecessary idle rendering, and provides a lightweight rendering mode for software-only graphics.
Results
Using the complete evaluation protocol, the shipped models achieved the following mean ROC-AUC values:
| Target | ROC-AUC |
|---|---|
| CAD | 0.899 |
| LAD | 0.811 |
| LCX | 0.717 |
| RCA | 0.691 |
The results also demonstrated an important limitation: LCX and RCA are substantially harder to predict from the available measurements.
We consider communicating that limitation an important part of the project rather than simply optimizing for a single headline metric.
What Makes Cardio3D Different
Cardio3D combines four components that are often developed separately:
Clinical data → Machine-learning prediction → Explainable AI → 3D anatomical visualization
Instead of asking a user to interpret an isolated probability, the application connects the probability to:
- the patient's clinical measurements,
- the model's reasoning,
- the relevant coronary artery,
- and the limitations of the underlying data.
The goal is not to replace medical expertise. It is to explore how machine-learning predictions can be presented in a way that is more transparent, contextual, and understandable.
Future Work
The current prototype has several important limitations.
The dataset contains only 303 patients from a single source, and the models have not undergone external or prospective validation. The anatomy is also a generic adult thorax rather than patient-specific imaging.
Future versions could explore:
- External multi-center validation.
- Larger and more diverse clinical datasets.
- Patient-specific CT or angiography-derived anatomy.
- More detailed lesion localization when appropriate data are available.
- Better uncertainty estimation.
- Prospective clinical evaluation.
- More comprehensive accessibility and usability testing.
Any clinical deployment would also require appropriate regulatory review and clinician involvement.
Transparency
Cardio3D does not use a generative AI or LLM at runtime.
Predictions are generated by classical machine-learning models using scikit-learn, while explanations are generated using SHAP. The natural-language explanation shown in the interface is produced through deterministic templates based on SHAP contributions.
AI assistants were used during development as coding, documentation, and debugging helpers, but the final implementation, experiments, tests, and reported metrics were reviewed and run as part of the project.
Cardio3D is an experiment in making cardiovascular machine learning easier to inspect: not just showing what the model predicts, but also showing where that prediction belongs anatomically and which measurements contributed to it.
Built With
- 3d-visualization
- data-science
- data-visualization
- explainable-ai
- fastapi
- healthcare
- healthtech
- javascript
- machine-learning
- medical-ai
- python
- scikit-learn
- shap
- three.js
- web

Log in or sign up for Devpost to join the conversation.