-
-
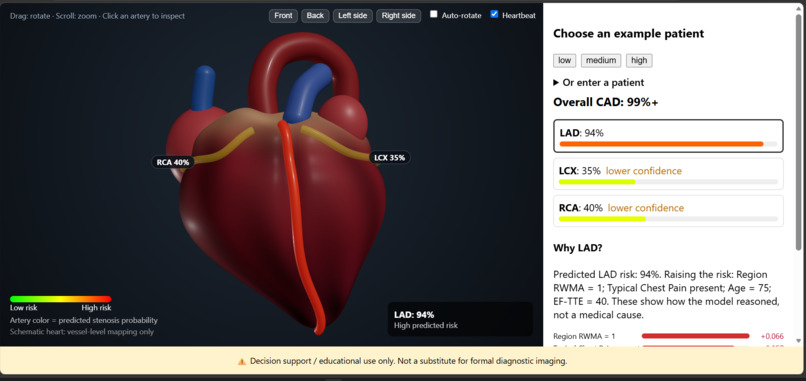
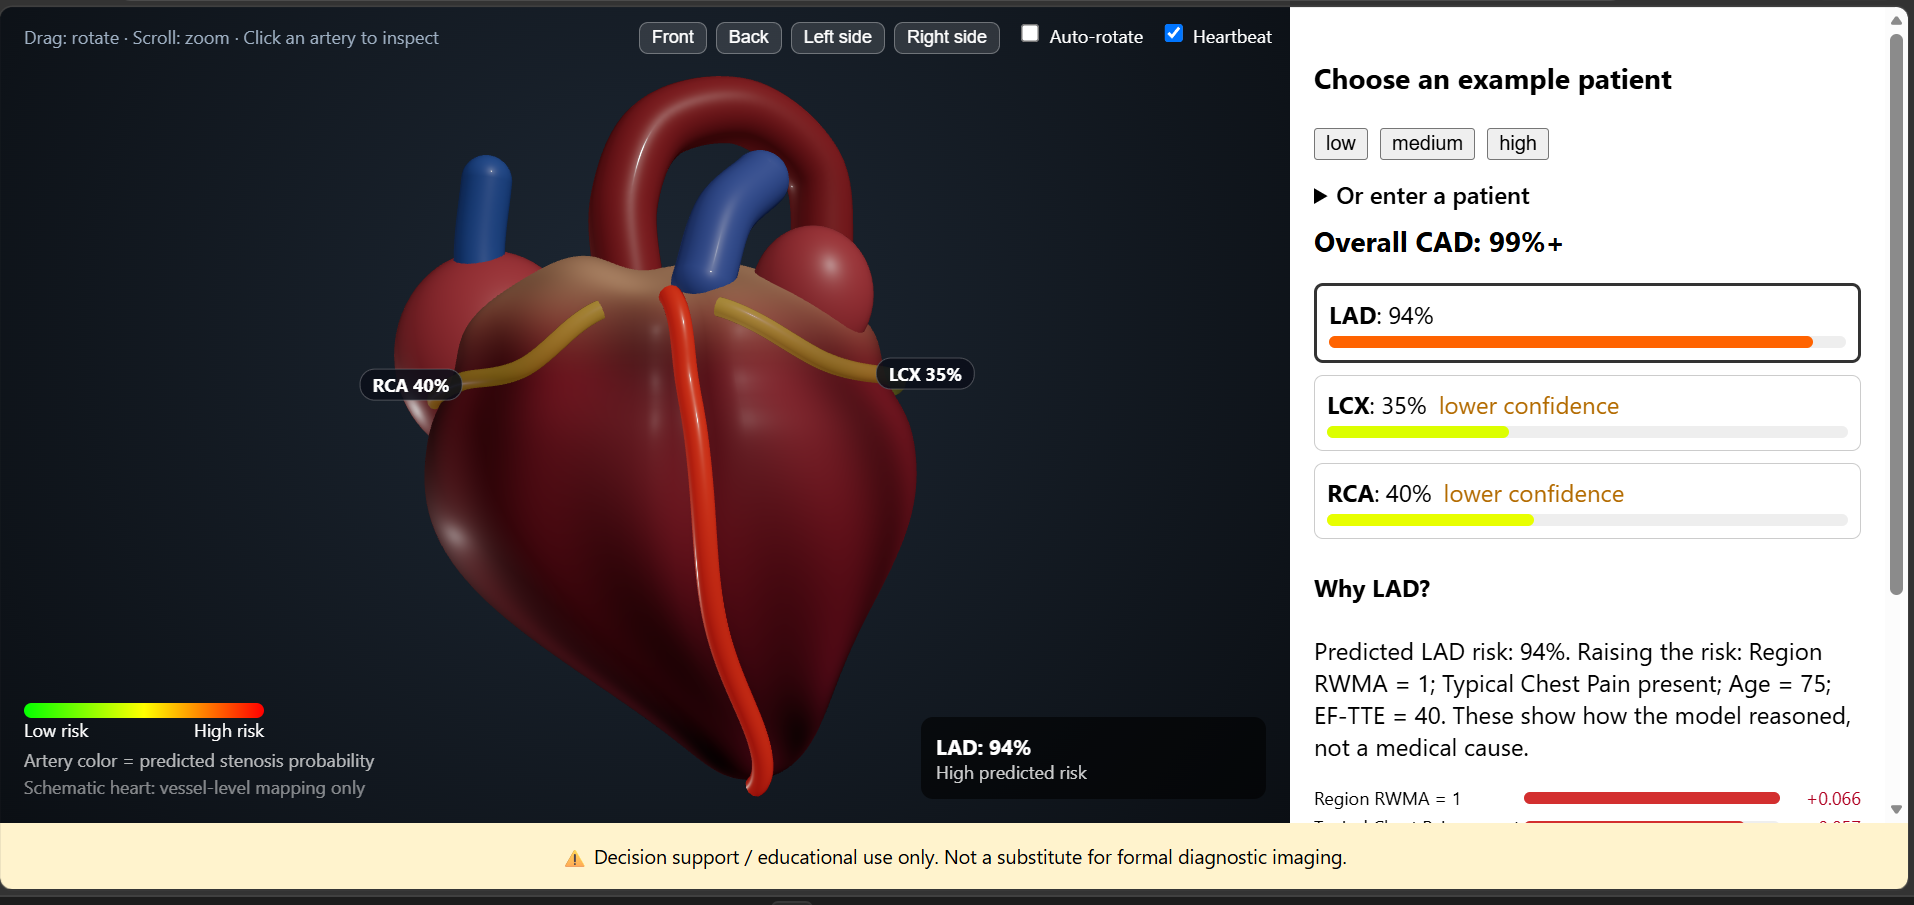
3D Heart with colored arteries and results panel
-
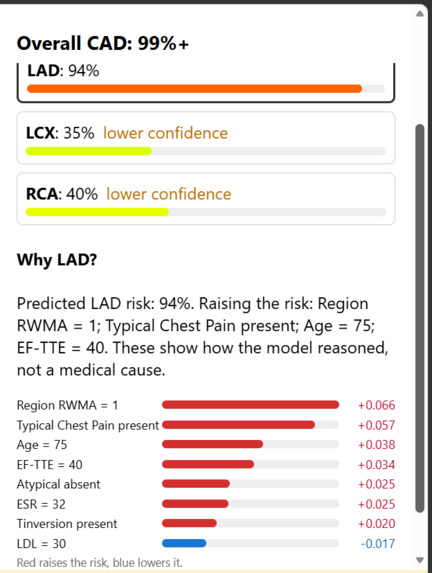
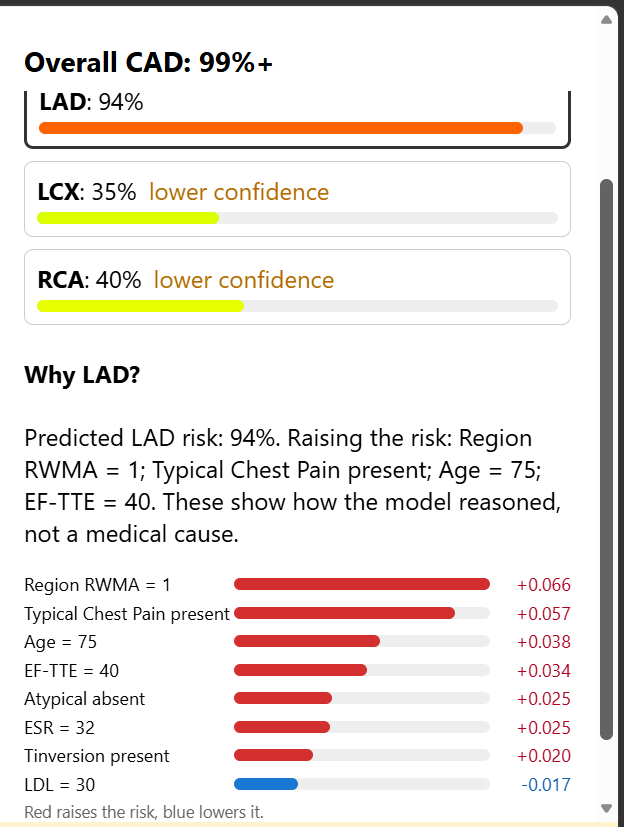
SHAP bars with the explanation
-
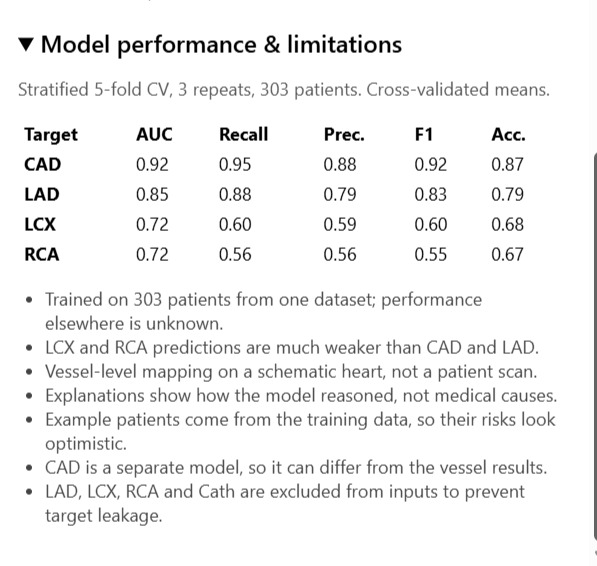
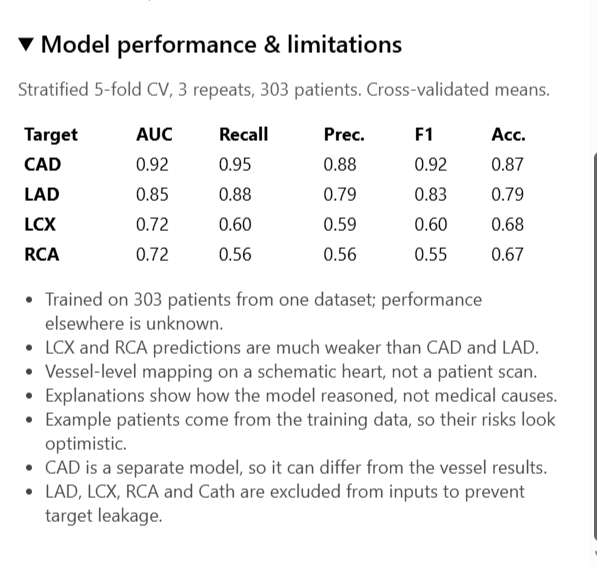
Metrics table
-
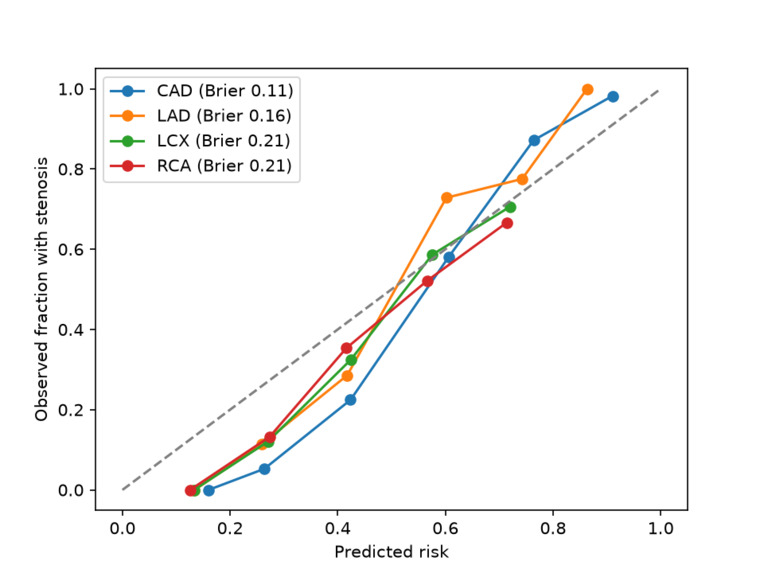
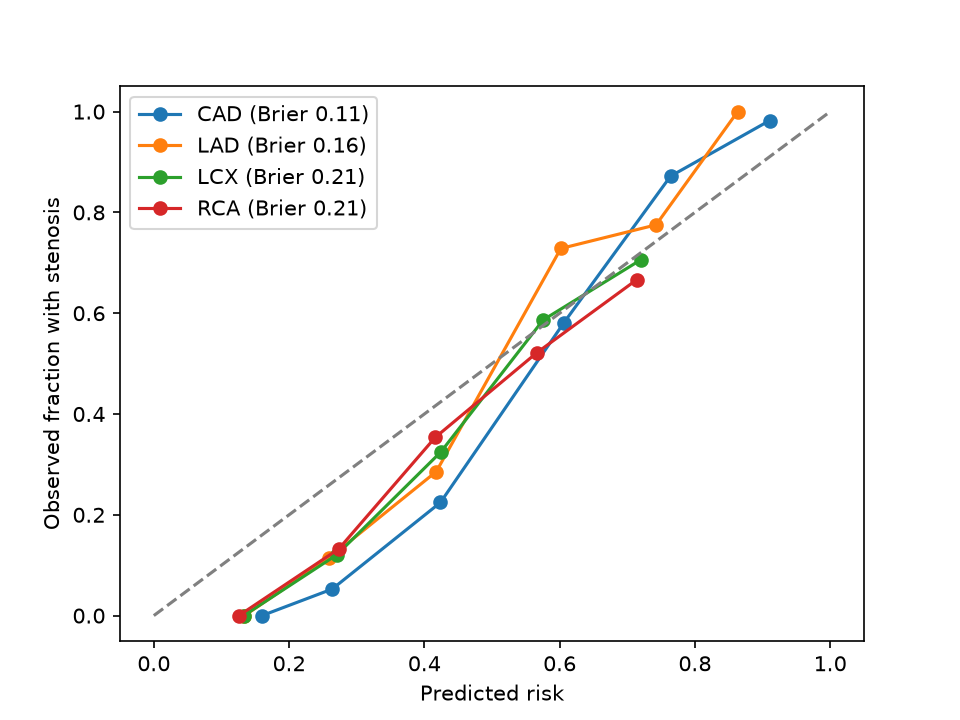
Calibration plot
Inspiration
Risk percentages alone don't show a clinician or student where in the heart the problem may be, or why the model thinks so. I wanted a tool that connects a prediction to the anatomy, explains it in plain language, and is honest about how far it can be trusted.
What it does
Enter a patient's demographic, clinical, ECG, lab and echo values (or load an example patient). The app predicts:
- overall coronary artery disease (CAD), and
- stenosis of the three main coronary arteries: LAD, LCX and RCA.
Each artery is colored on an interactive 3D heart from green (low risk) to red (high risk). You can rotate, zoom, jump to front, back and side views, and click an artery to see its risk, a plain-language explanation, and SHAP bars showing which measurements pushed the risk up or down.
How we built it
- Data: Extension of the Z-Alizadeh Sani dataset (303 patients). Text fields were converted to numbers, with 56 input features after cleaning.
- Leakage control: LAD, LCX, RCA and Cath are removed from the inputs of every model, so no model sees the answer.
- Models: four separate random forests (CAD, LAD, LCX, RCA), compared against logistic regression and XGBoost. LCX and RCA use class-balanced forests, which raised recall (LCX 0.37 to 0.61, RCA 0.35 to 0.56) at a similar AUC.
- Validation: stratified 5-fold cross-validation repeated 3 times; accuracy, precision, recall, F1 and ROC-AUC are reported for all four targets.
- Explanations: SHAP values per patient, turned into a plain sentence and a bar chart.
- Backend: FastAPI serves the predictions and explanations.
- Frontend: React and React Three Fiber. The heart is built from code (low-poly, no GPU needed), and each artery is placed on its surface so the colors map directly to the model outputs.
- Safety features: a visible educational-use disclaimer on every screen, a warning when most inputs were assumed, and a "lower confidence" tag on the weaker vessels.
Results (cross-validated ROC-AUC)
| Target | ROC-AUC |
|---|---|
| CAD | 0.92 |
| LAD | 0.85 |
| LCX | 0.72 |
| RCA | 0.72 |
CAD and LAD are predicted well from clinical data. LCX and RCA are much weaker, and the app flags this instead of hiding it.
Challenges we ran into
- Preventing target leakage in a dataset where the answers sit next to the inputs.
- A very small dataset, so I used repeated cross-validation instead of a single split.
- Keeping the 3D view responsive in a normal browser without a GPU.
Accomplishments that we're proud of
- A leakage-free pipeline: the four answer columns are removed from every model, and the check is printed in the notebook.
- Honest validation: repeated cross-validation with accuracy, precision, recall, F1 and ROC-AUC for CAD, LAD, LCX and RCA, instead of one lucky split.
- A complete path from clinical inputs to a colored 3D heart, with a plain-language explanation and SHAP bars for every artery.
- A tool that says when it is unsure: weaker vessels are tagged "lower confidence", and the app warns when most inputs were assumed.
- A 3D view that runs smoothly in a normal browser without a GPU.
What we learned
- In a dataset where the answers sit beside the inputs, leakage is the first thing to check, and it decides whether any result can be trusted.
- With 303 patients, a single train/test split is unreliable, so repeated cross-validation gives a more honest picture.
- Class balancing raised recall for the harder vessels (LCX 0.37 to 0.61, RCA 0.35 to 0.56) without hurting AUC.
- Forest probabilities for patients the model was trained on look better than they really are, so example patients must be labeled as such.
- Explaining a model is not the same as proving a cause, and a good interface should say so.
Limitations
- Trained on 303 patients from one dataset; performance on other populations is unknown.
- LCX and RCA predictions are weak (ROC-AUC about 0.72).
- The 3D mapping is vessel-level on a schematic heart, not a patient-specific scan.
- SHAP explains how the model reasoned, not medical causes.
- Example patients come from the training data, so their risks look better than real use.
- The CAD model is separate from the vessel models, so their outputs can differ.
- This is an educational and decision-support prototype, not a diagnostic tool.
What's next for Cardio Risk Visualizer
- Validate on an external dataset and calibrate the probabilities.
- Add more clinical features and try methods that suit small datasets better.
- Replace the schematic heart with an anatomical mesh that has labeled coronary vessels.
- Get feedback from clinicians on the explanations and the interface.
Running it
Setup and run instructions are in the GitHub README.
Built With
- fastapi
- pandas
- python
- react
- scikit-learn
- shap
- three.js
- threefiber

Log in or sign up for Devpost to join the conversation.