Inspiration
Cardiovascular disease is the leading cause of death worldwide, yet early risk detection is often limited to clinical environments. I wanted to explore how machine learning can make cardiovascular risk prediction more accessible and understandable.
My goal was to build an interpretable AI-based system using real biomedical data and turn it into an interactive tool that demonstrates how predictive modeling can support preventive healthcare.
What it does
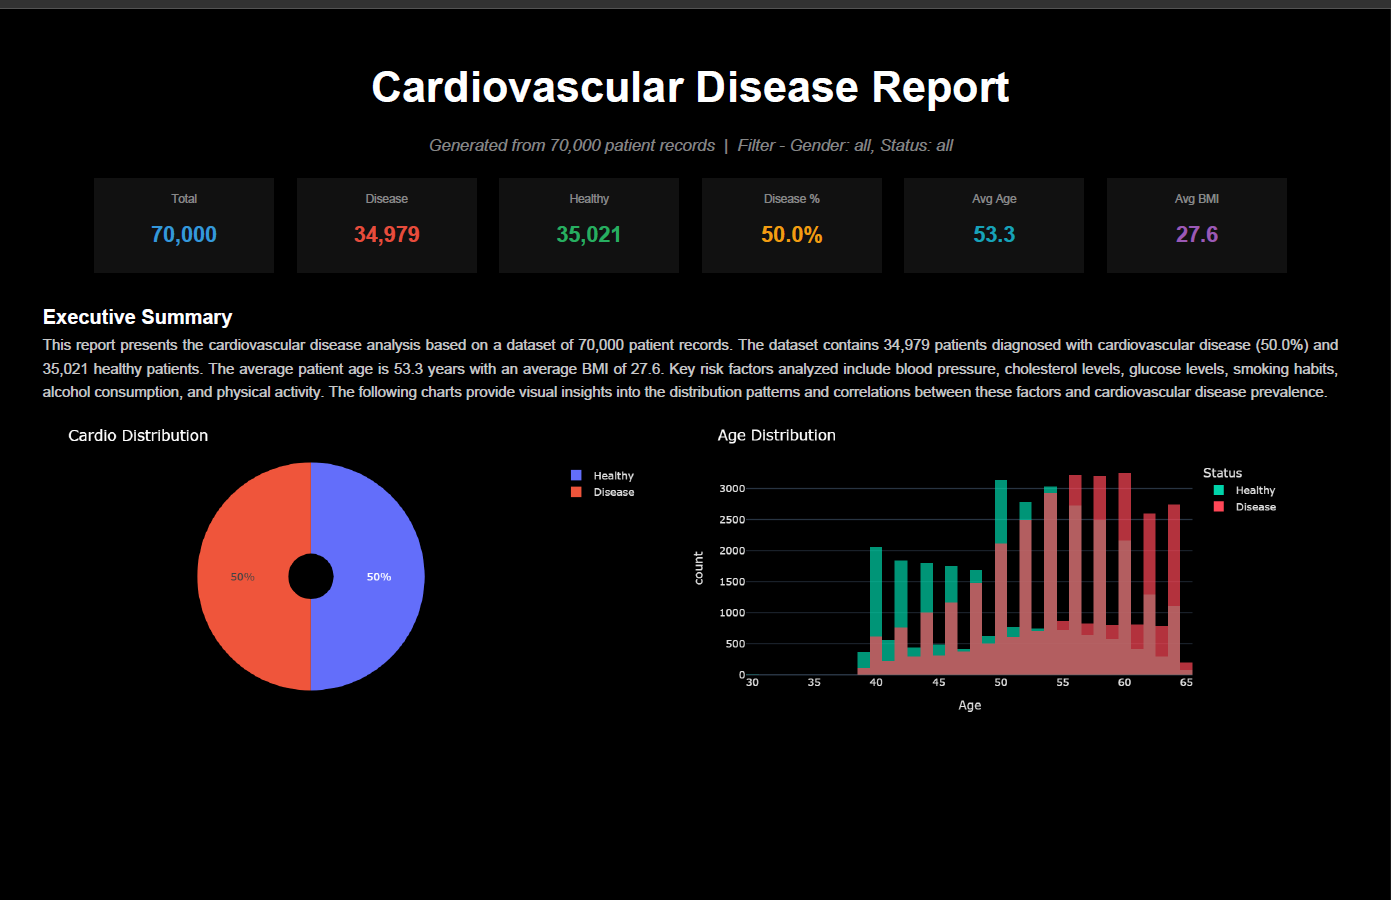
Cardiovascular Disease Dashboard is a machine learning-powered web application that predicts cardiovascular disease risk based on patient health metrics.
The system:
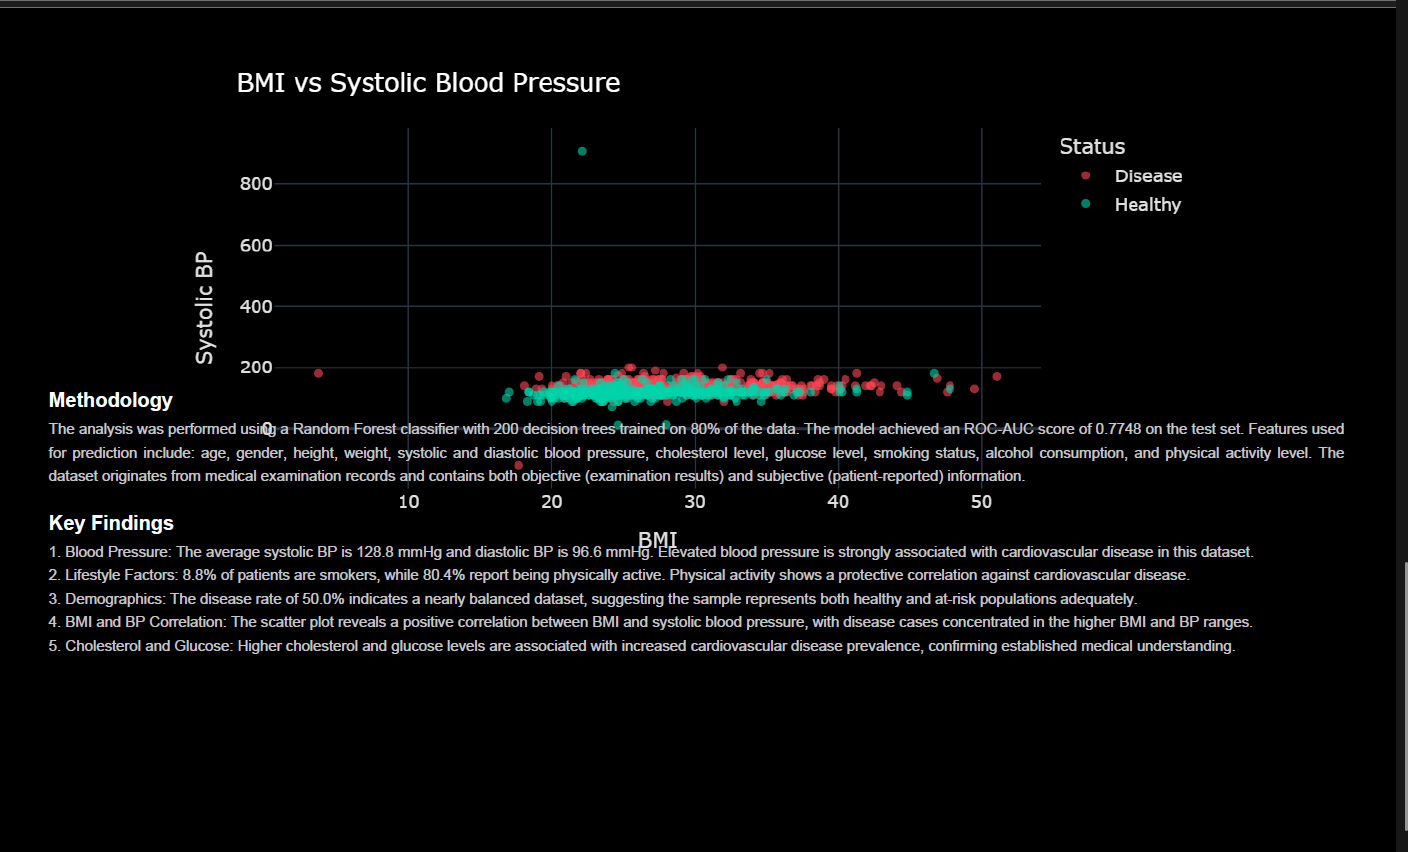
- Trains a Random Forest classifier on 70,000 real patient records
- Achieves a ROC-AUC score of 0.787
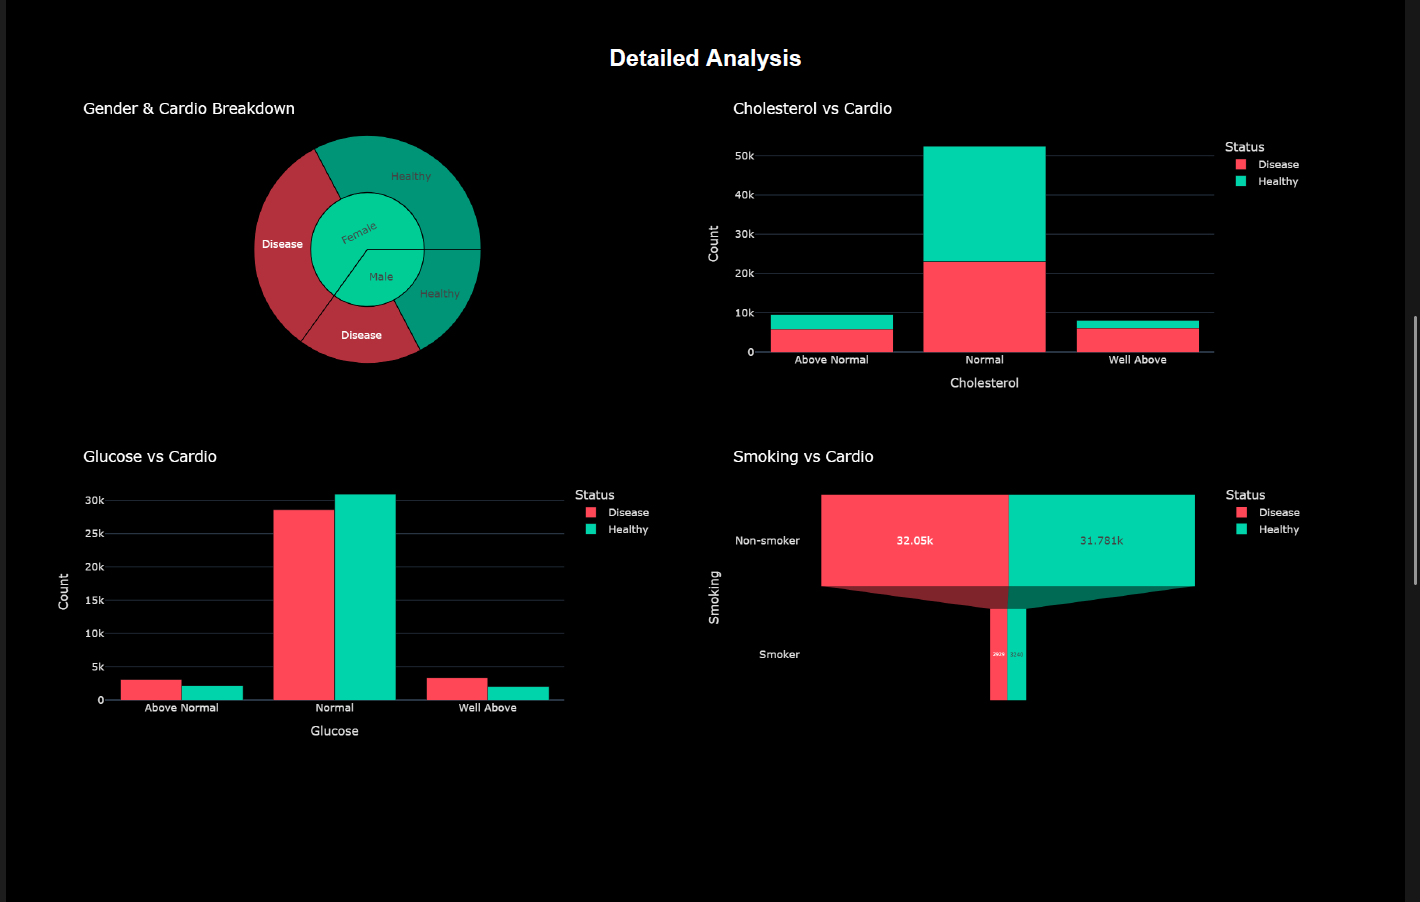
- Identifies key predictors such as systolic blood pressure and cholesterol
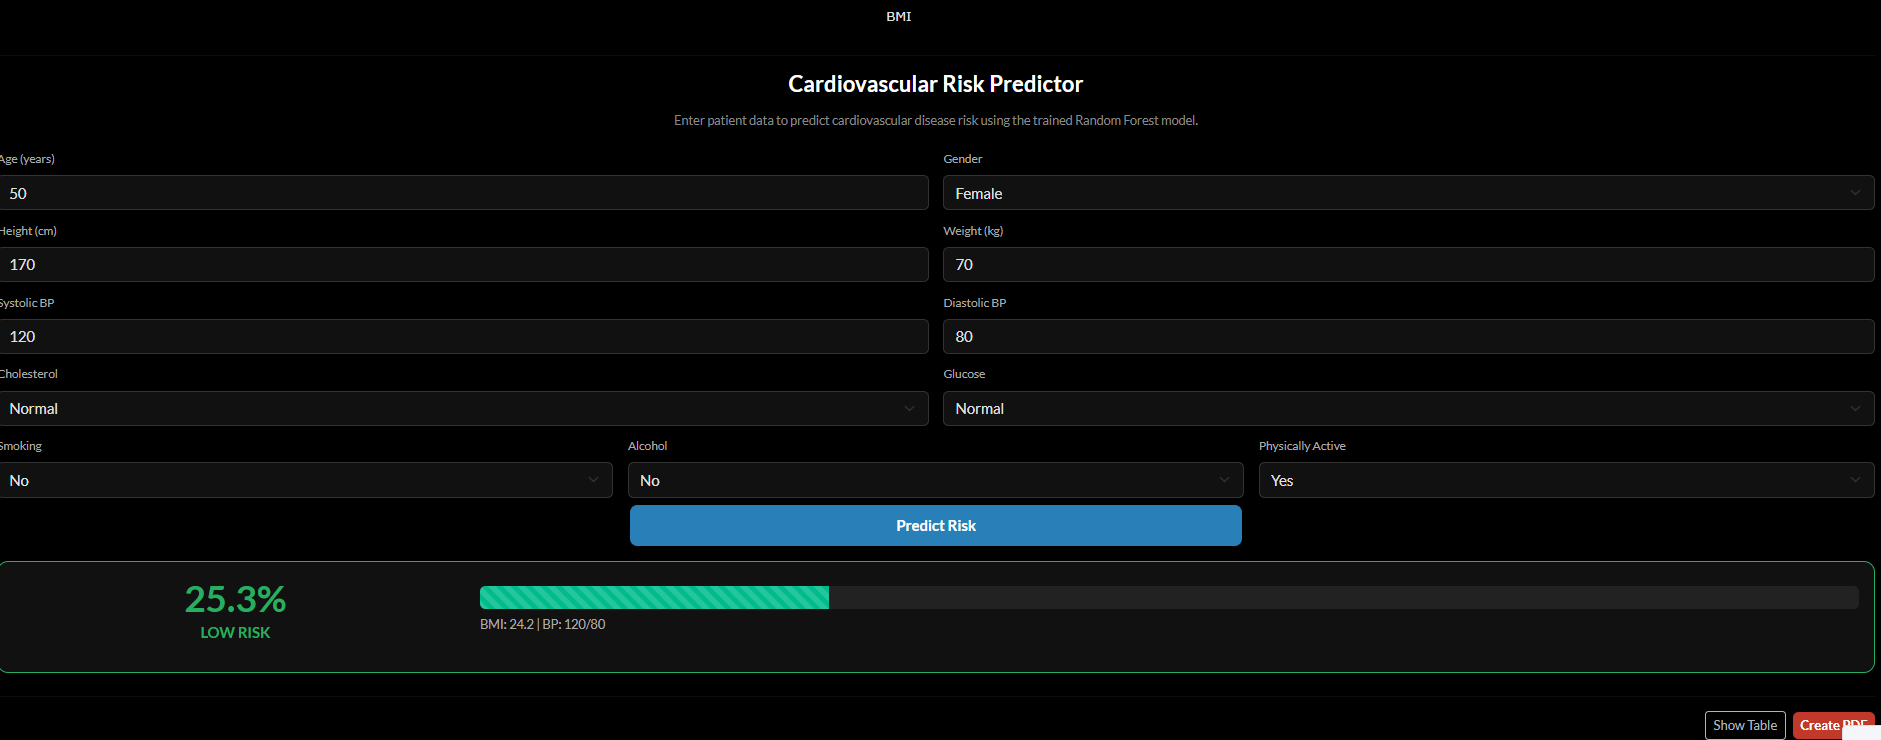
- Provides an interactive web-based risk calculator
Users can input health parameters (age, blood pressure, cholesterol, glucose level, lifestyle factors), and the application returns a predicted cardiovascular risk probability.
How I built it
I built the project using:
- Python
- Pandas for data preprocessing
- Scikit-learn for machine learning
- Random Forest classifier
- Matplotlib for feature importance visualization
- Joblib for model serialization
- Streamlit for deploying the web interface
Steps:
- Cleaned and processed a semicolon-separated biomedical dataset
- Removed irrelevant features (such as ID)
- Split the data into training and testing sets (80/20)
- Trained a Random Forest model
- Evaluated performance using ROC-AUC
- Analyzed feature importance
- Saved the trained model and deployed it in a Streamlit web app
Challenges I ran into
Some of the main challenges included:
- Handling non-standard CSV formatting
- Debugging feature mismatches between training and deployment
- Ensuring the model received exactly the same input structure in the web app
- Understanding how small preprocessing mistakes affect predictions
These challenges significantly improved my understanding of real-world ML system design.
Accomplishments that I'm proud of
- Successfully training a predictive model on 70,000 real medical records
- Achieving a solid ROC-AUC score of 0.787
- Building a complete ML pipeline from preprocessing to deployment
- Creating a working AI-powered cardiovascular risk calculator
- Implementing feature importance for interpretability
What I learned
Through this project, I learned:
- How critical proper data preprocessing is in machine learning
- The importance of model interpretability in healthcare applications
- How to deploy a trained model into a functional web application
- The practical challenges of aligning training and inference pipelines
I also gained deeper insight into how cardiovascular risk factors interact and influence predictions.
What's next for Cardiovascular Disease Dashboard
Next, I plan to:
- Perform hyperparameter optimization to improve performance
- Implement SHAP-based explainability for individual predictions
- Conduct fairness analysis across demographic groups
- Categorize predictions into low / medium / high risk levels
- Deploy the application to a scalable cloud environment
My long-term goal is to develop a fully interpretable, accessible AI-based health risk assessment platform.
Built With
- matplotlib
- numpy
- pandas
- python
- scikit-learn
- streamlit
- vscode

Log in or sign up for Devpost to join the conversation.