-
-
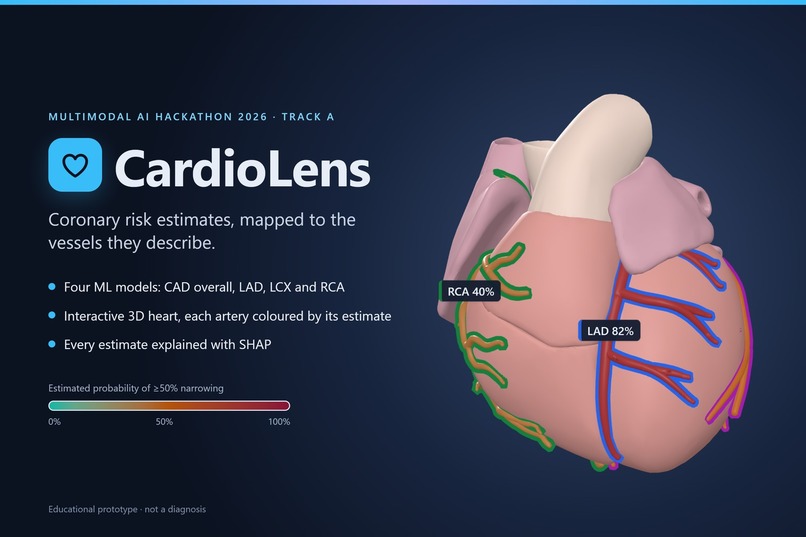
CardioLens: coronary risk estimates, mapped to the vessels they describe
-
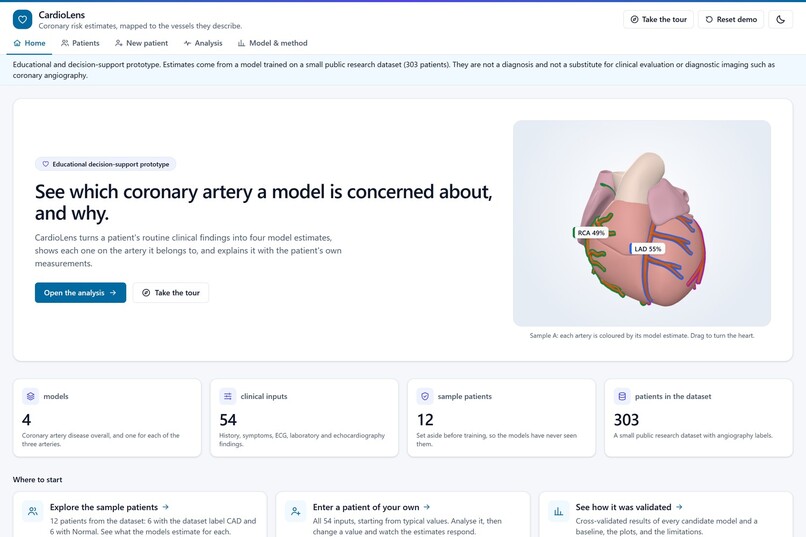
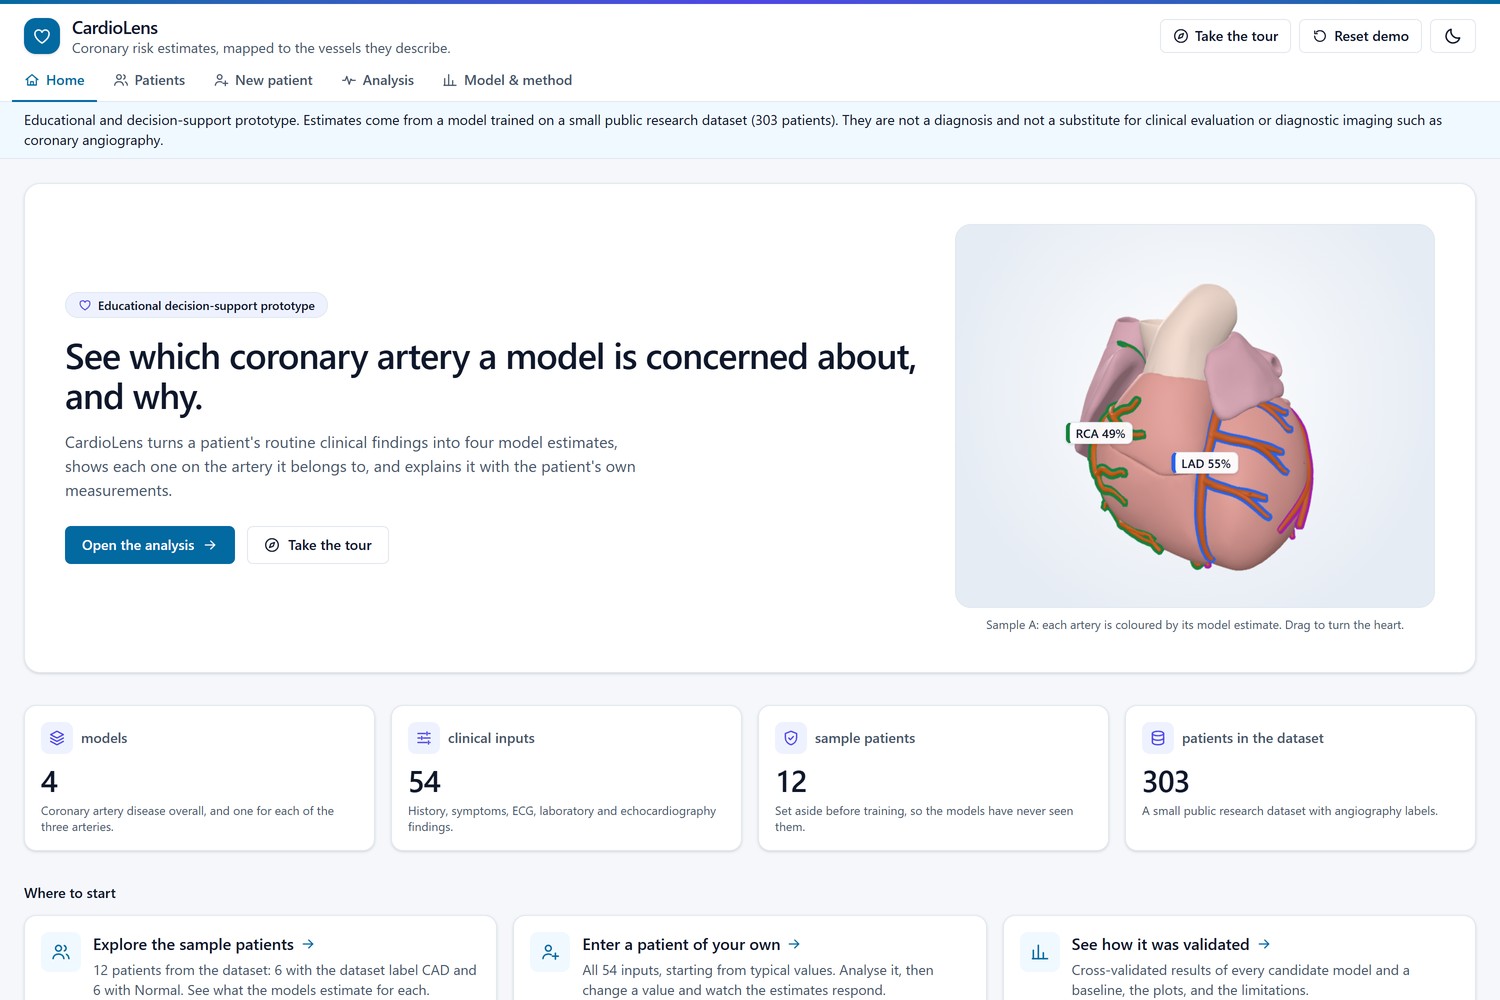
Home page: what CardioLens does, with the 3D heart showing Sample A’s estimates
-
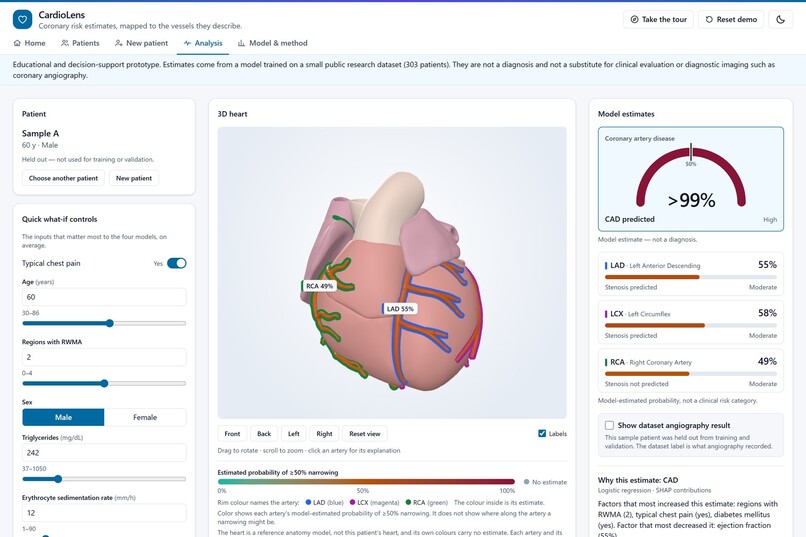
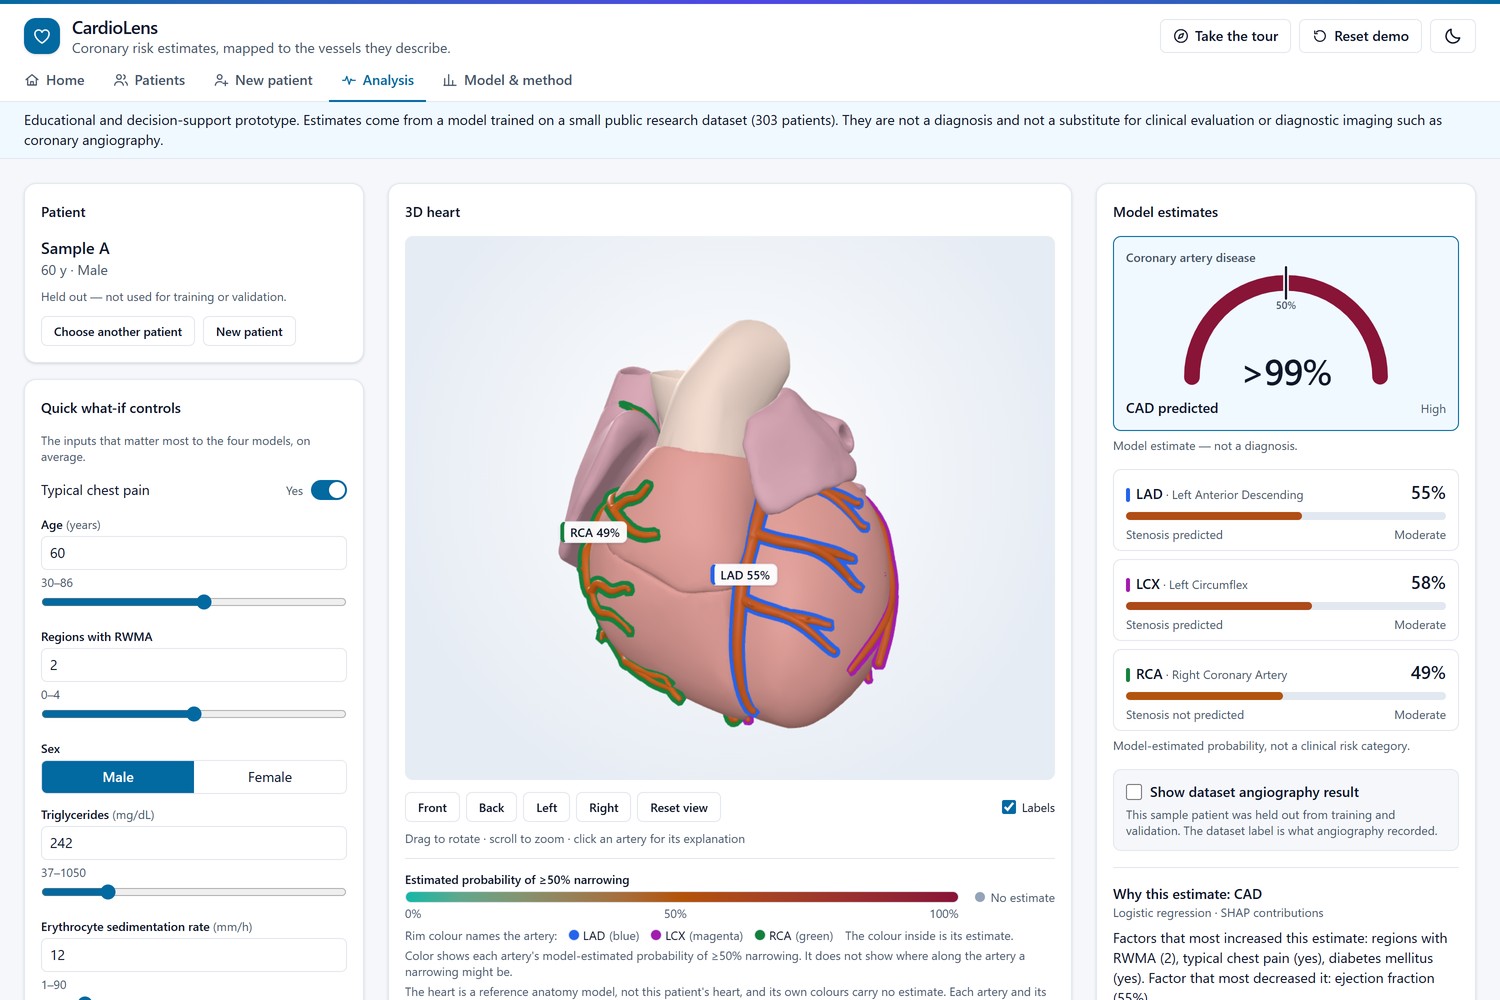
Sample A: CAD gauge, an estimate for each artery, and the 3D heart coloured by them
-
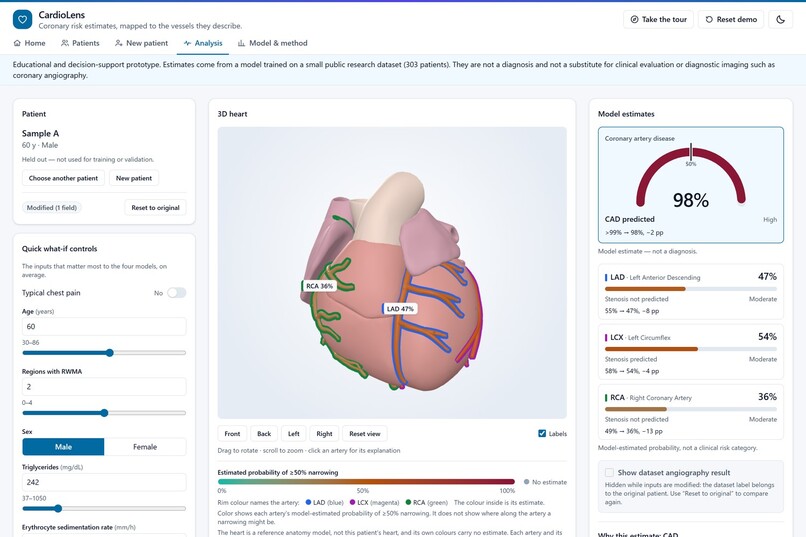
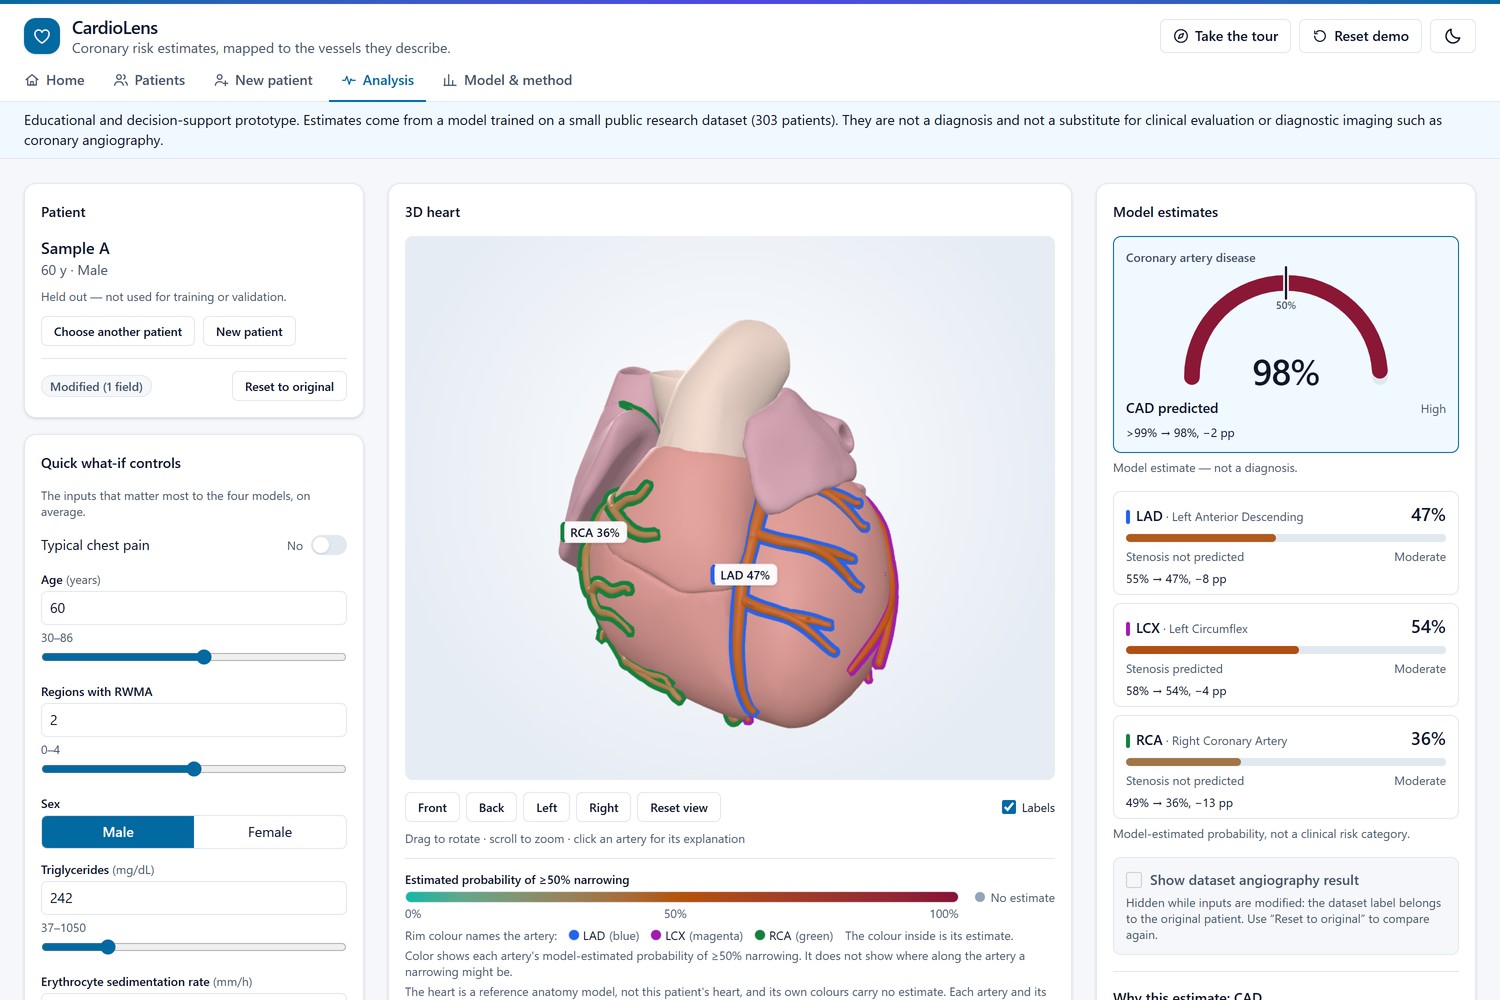
What-if: typical chest pain switched off, with before → after on every estimate (LAD 55% → 47%)
-
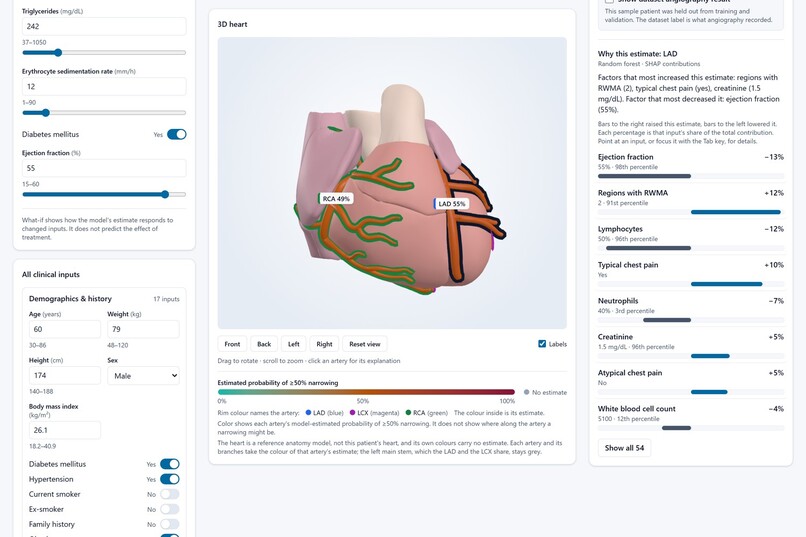
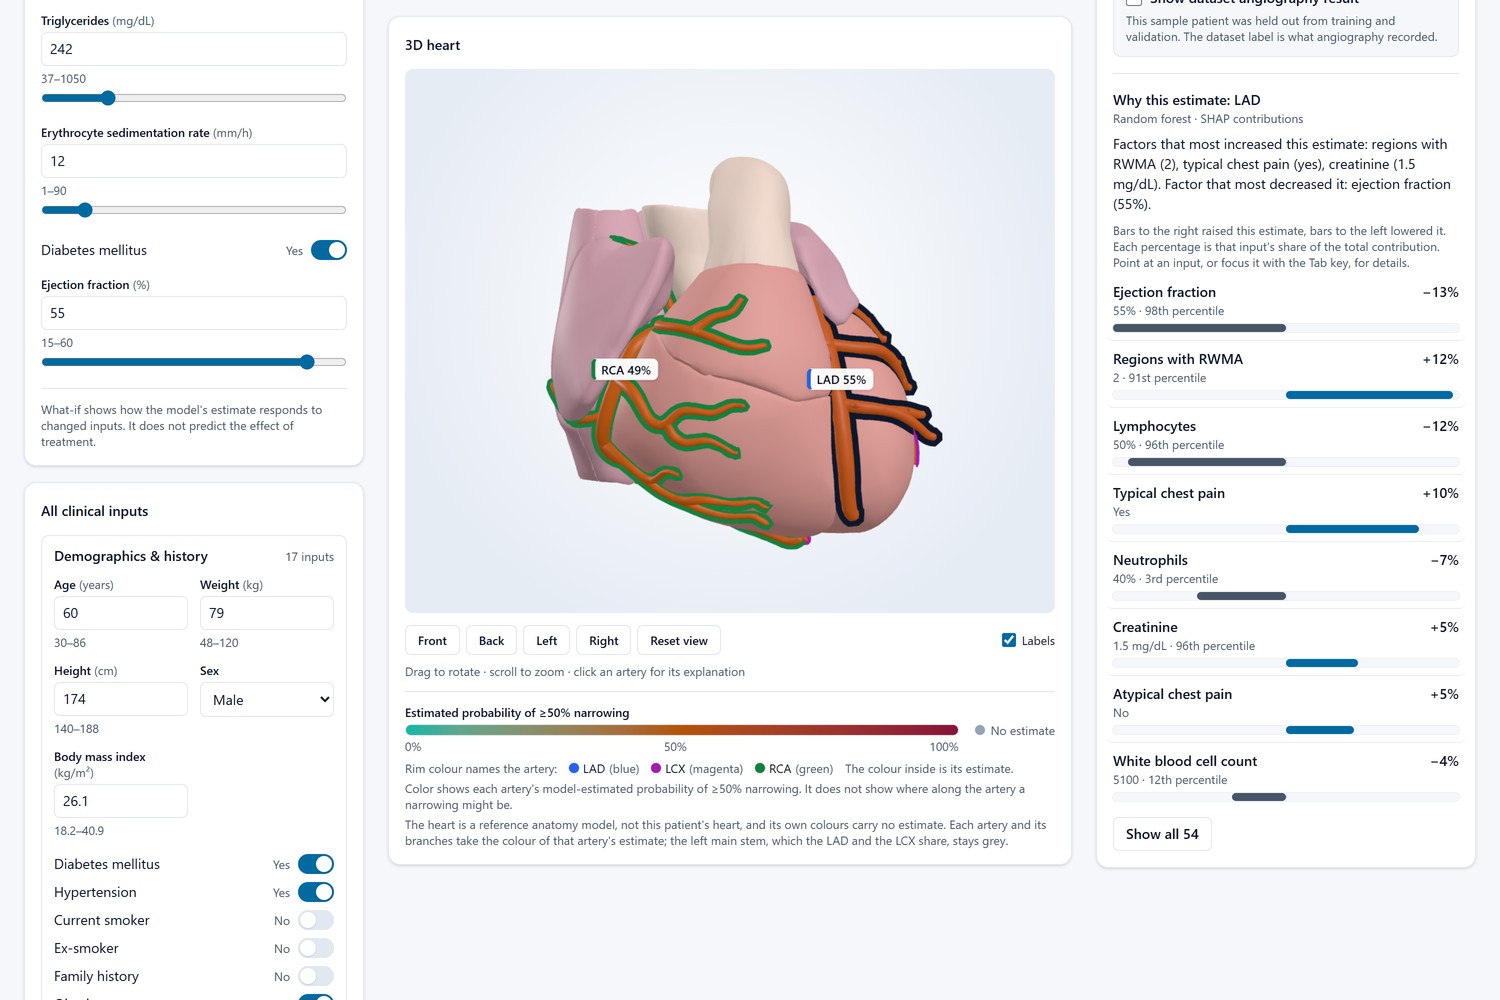
Why this estimate: SHAP contributions for the LAD model, with each input’s value and percentile
-
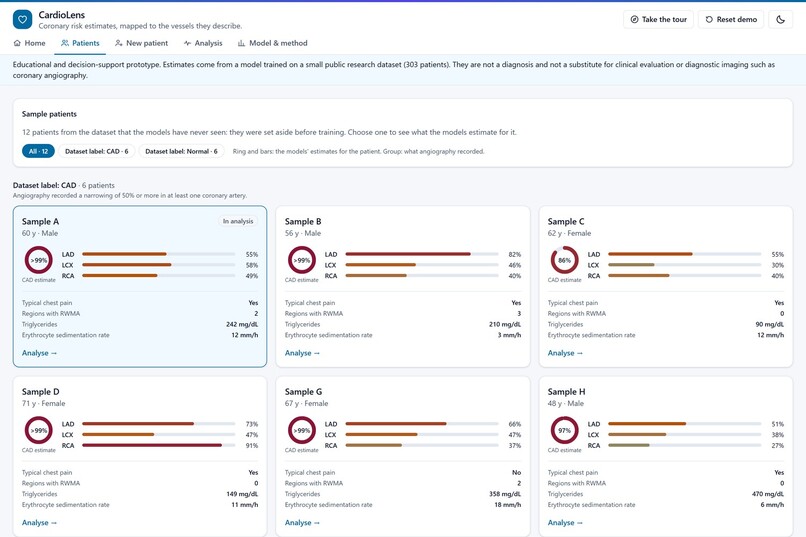
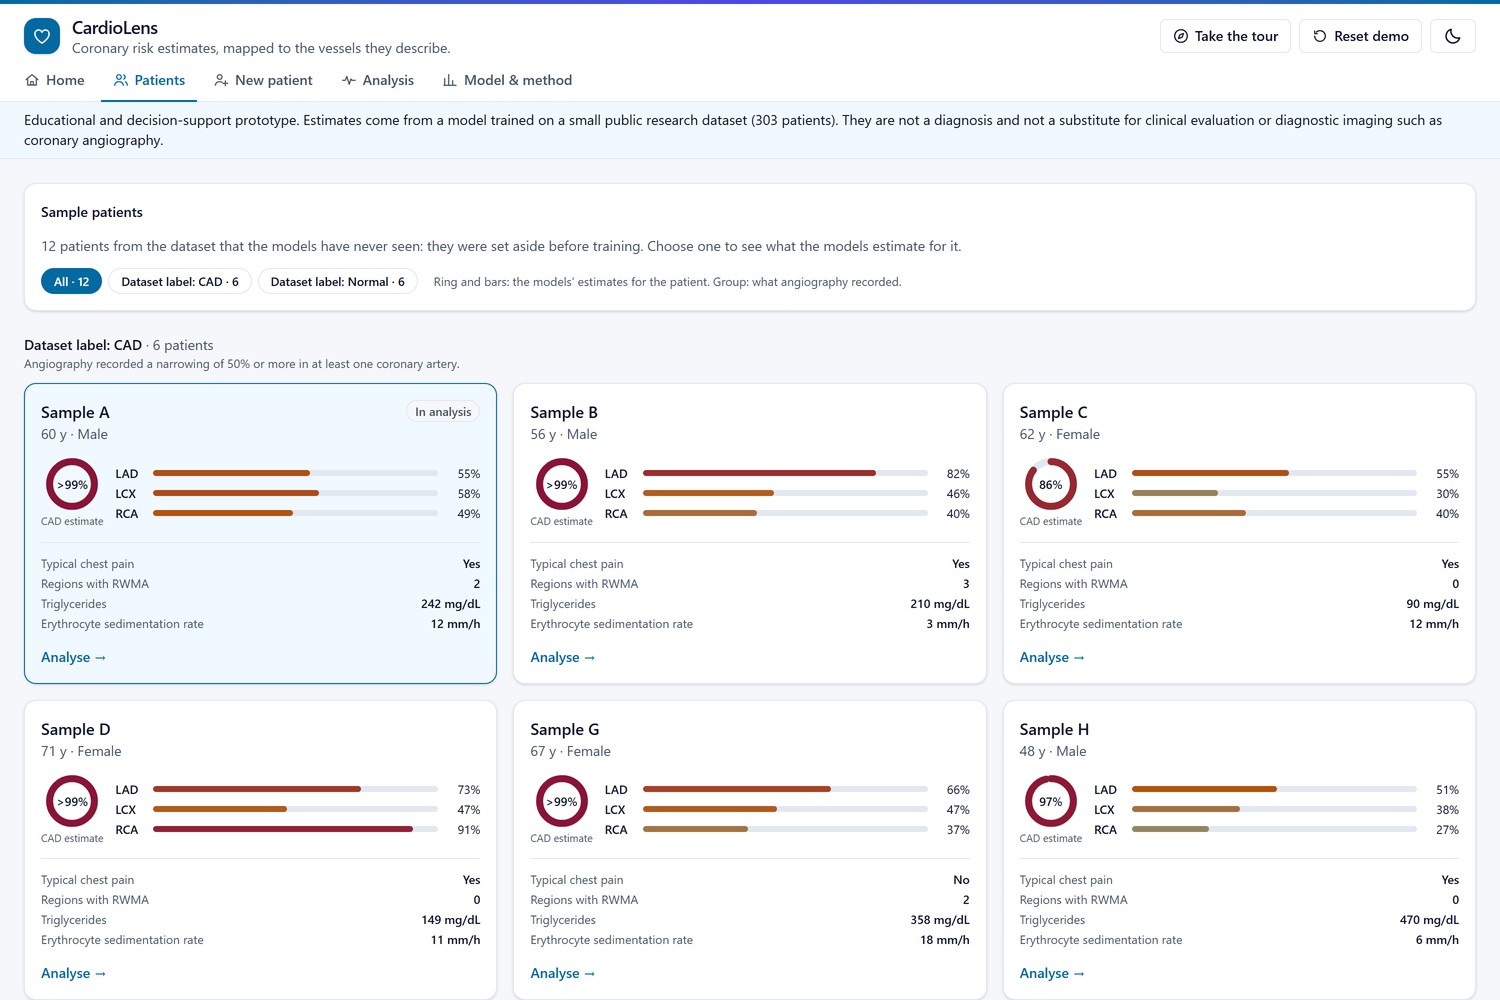
Twelve held-out sample patients, each card showing the CAD estimate and the LAD, LCX and RCA bars
-
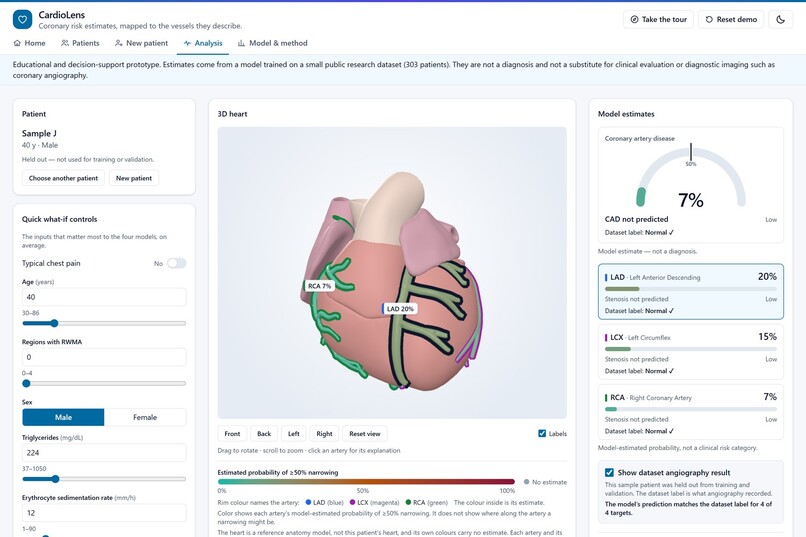
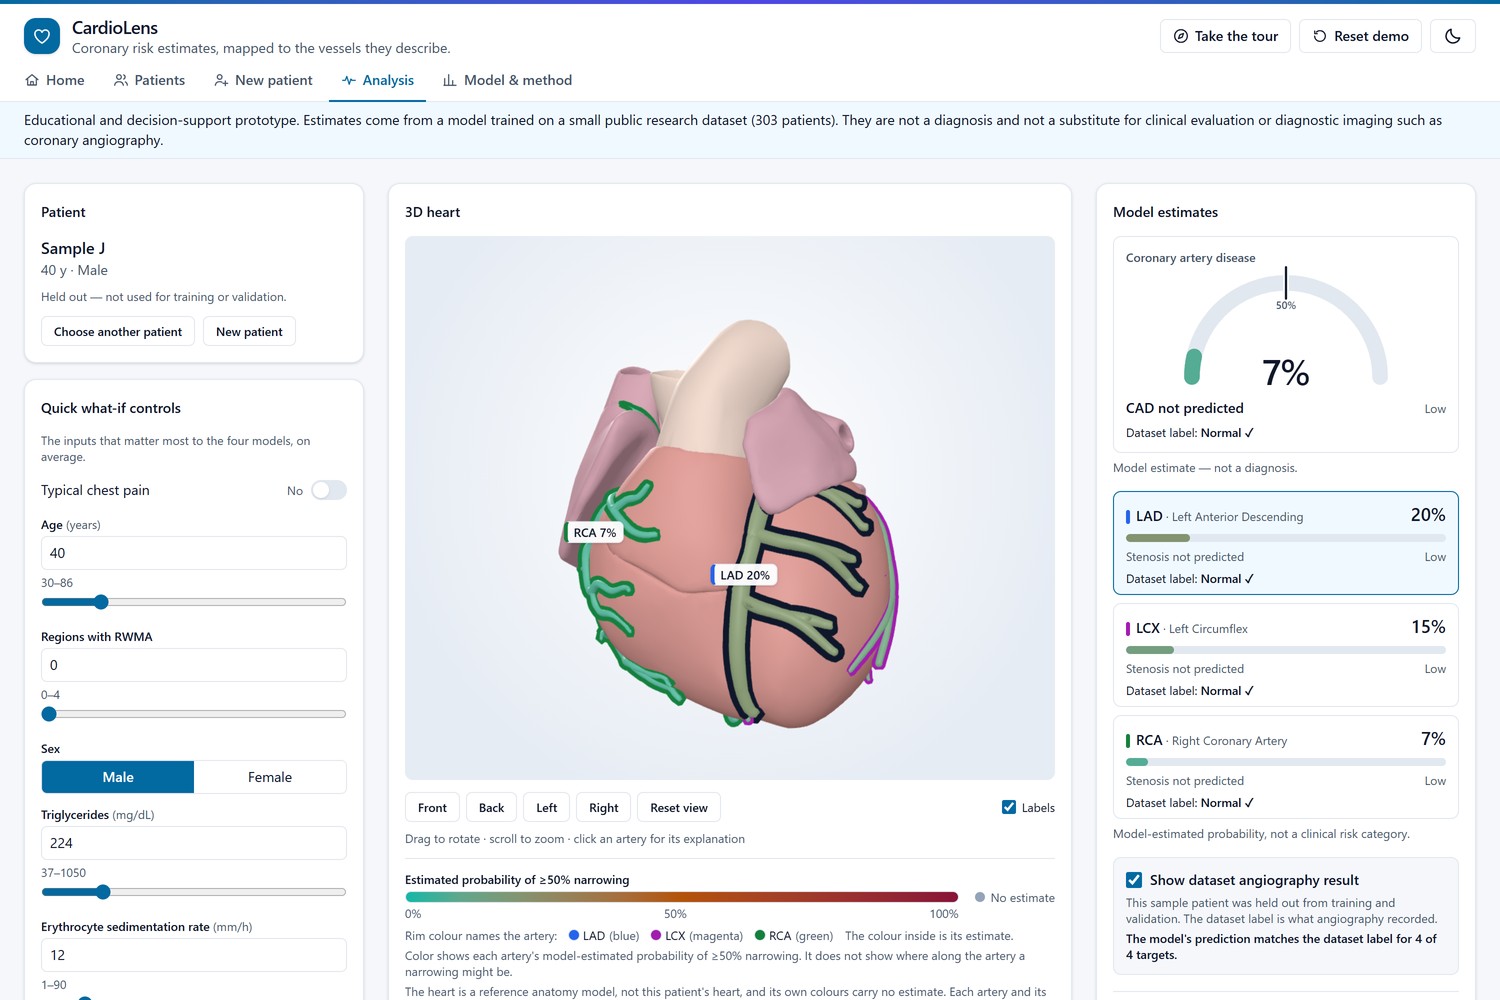
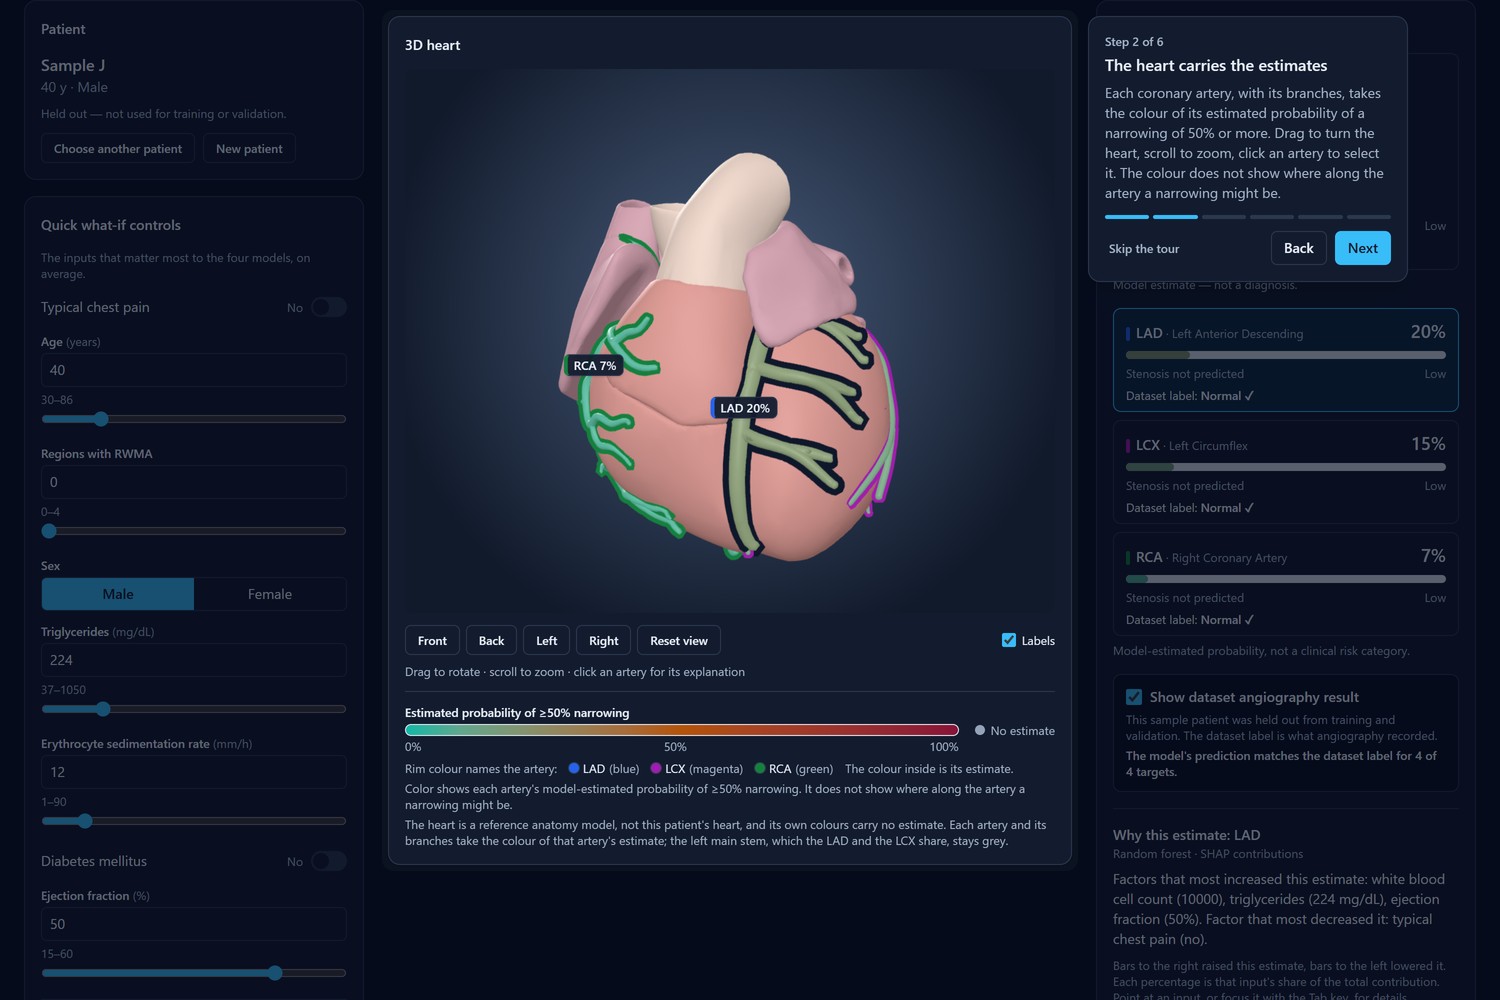
Sample J, a patient without CAD: low estimates, and the model matches all 4 dataset labels
-
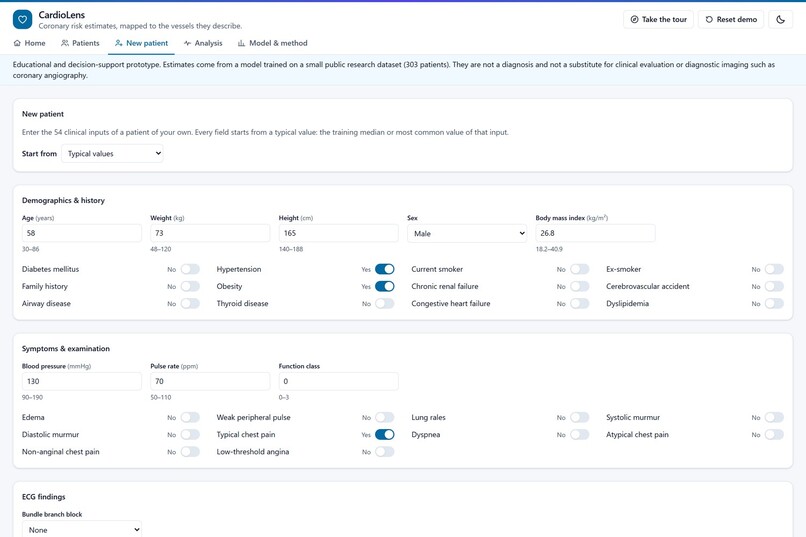
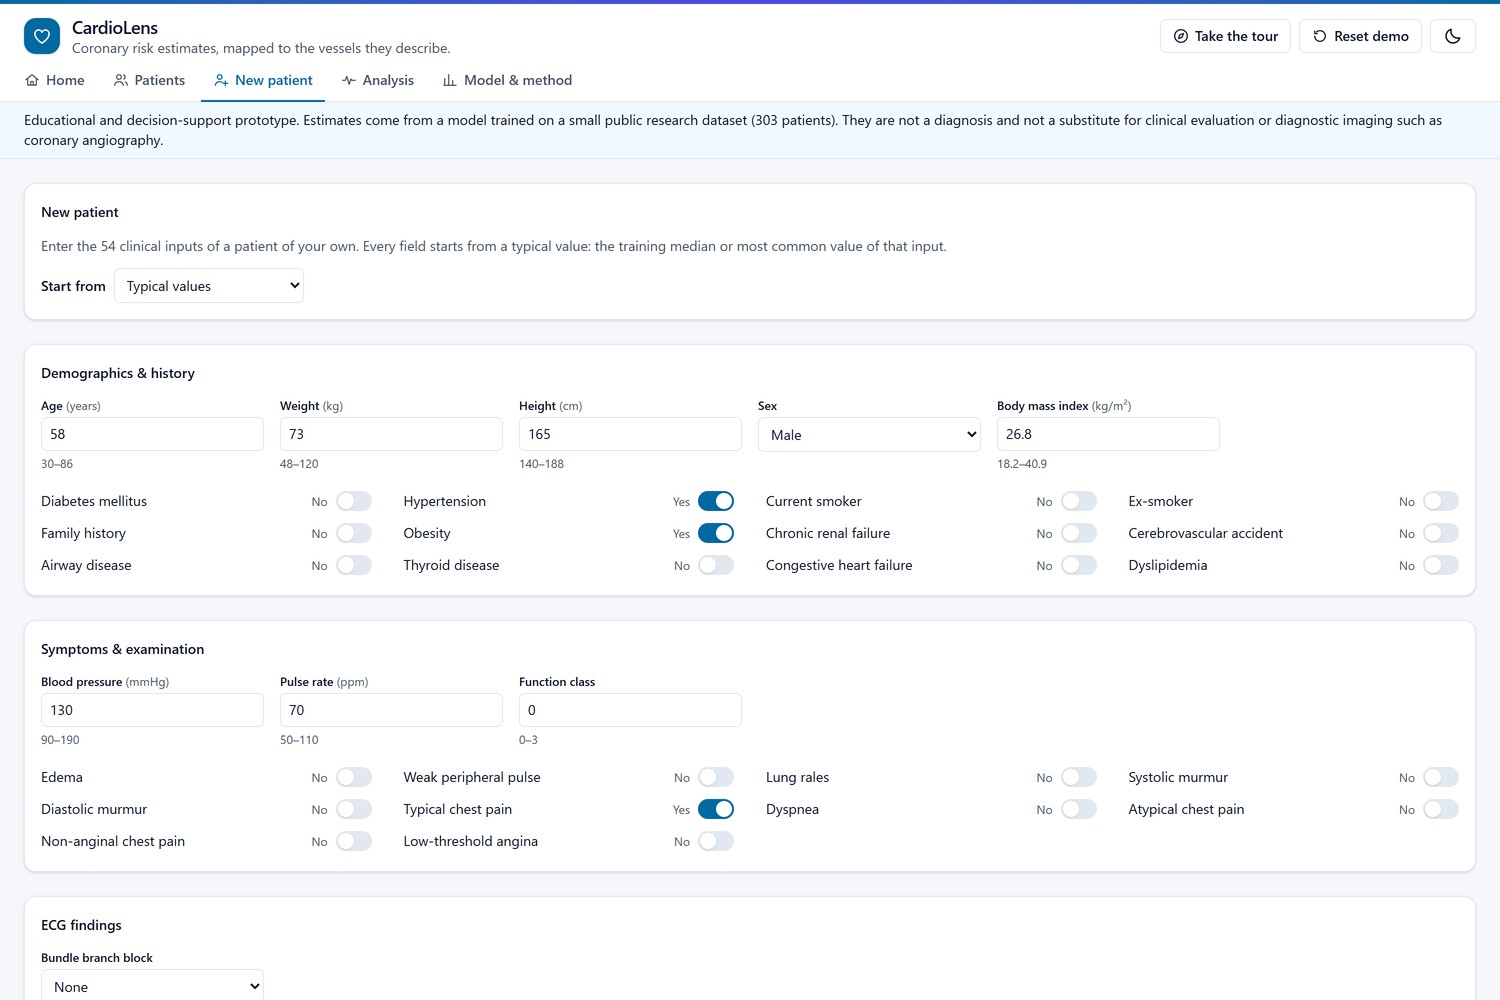
New patient: all 54 clinical inputs, starting from typical values or any sample patient
-
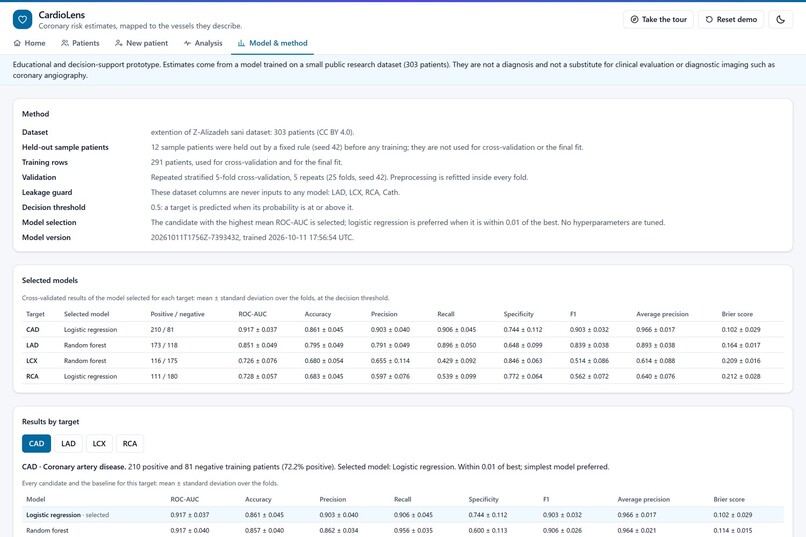
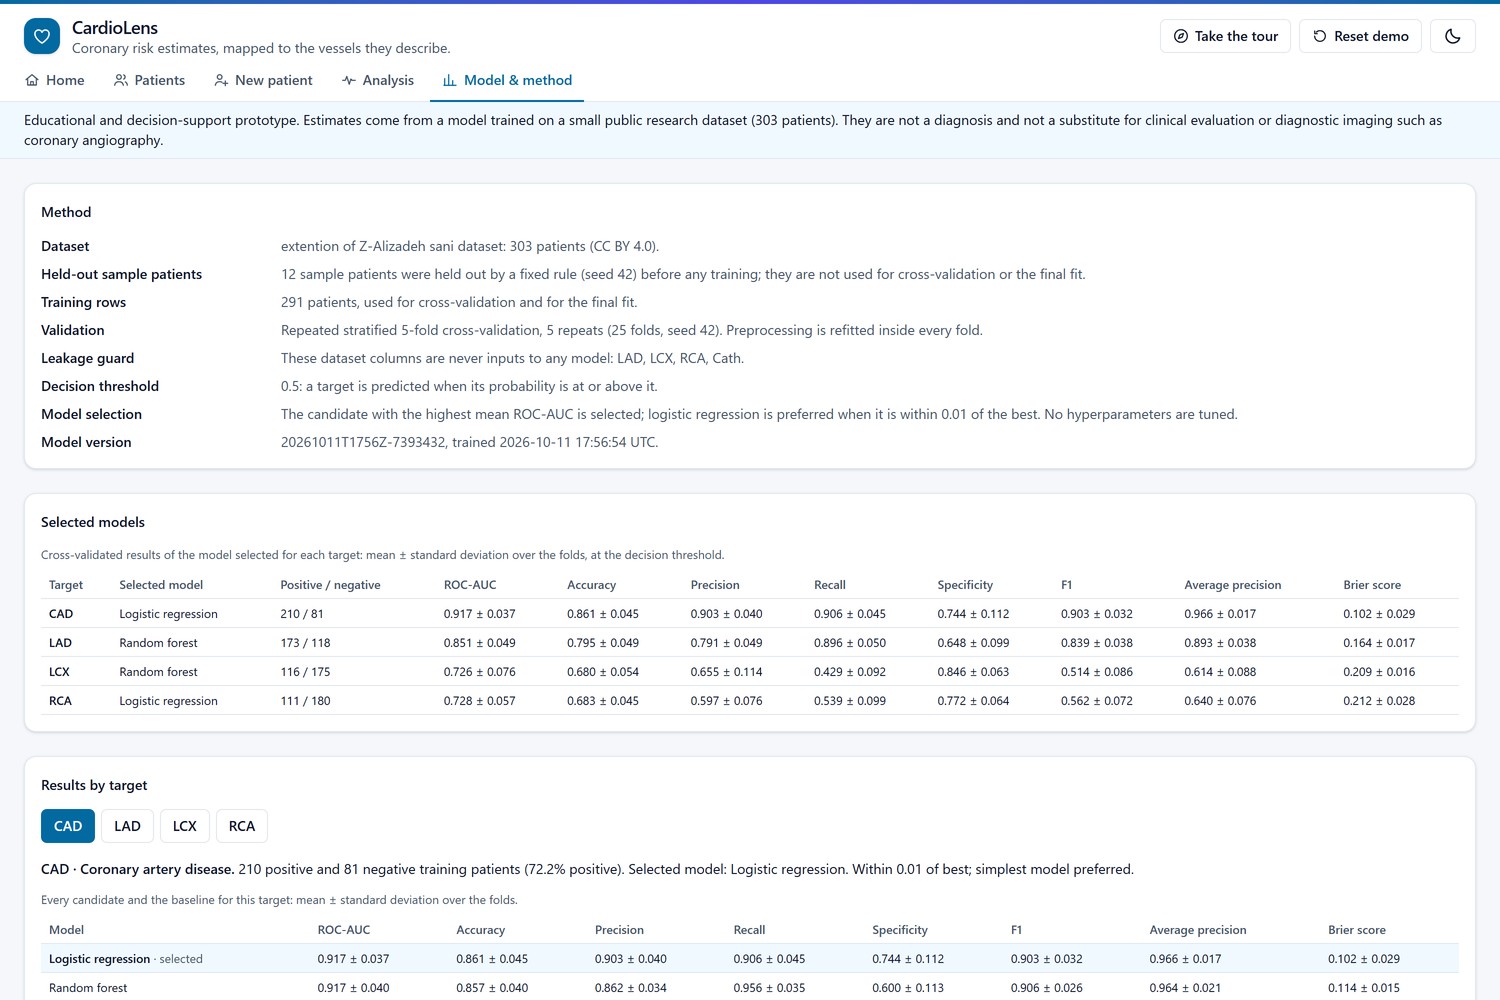
Model & method: validation setup, leakage guard and cross-validated results for each target
-
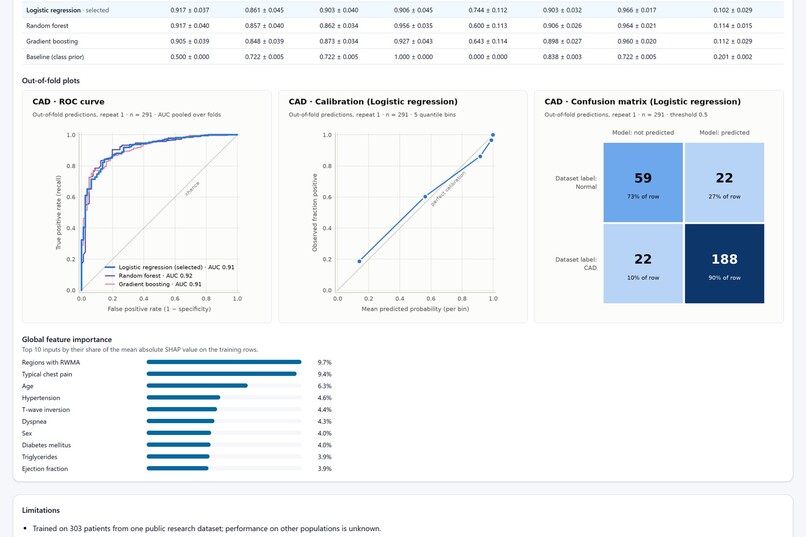
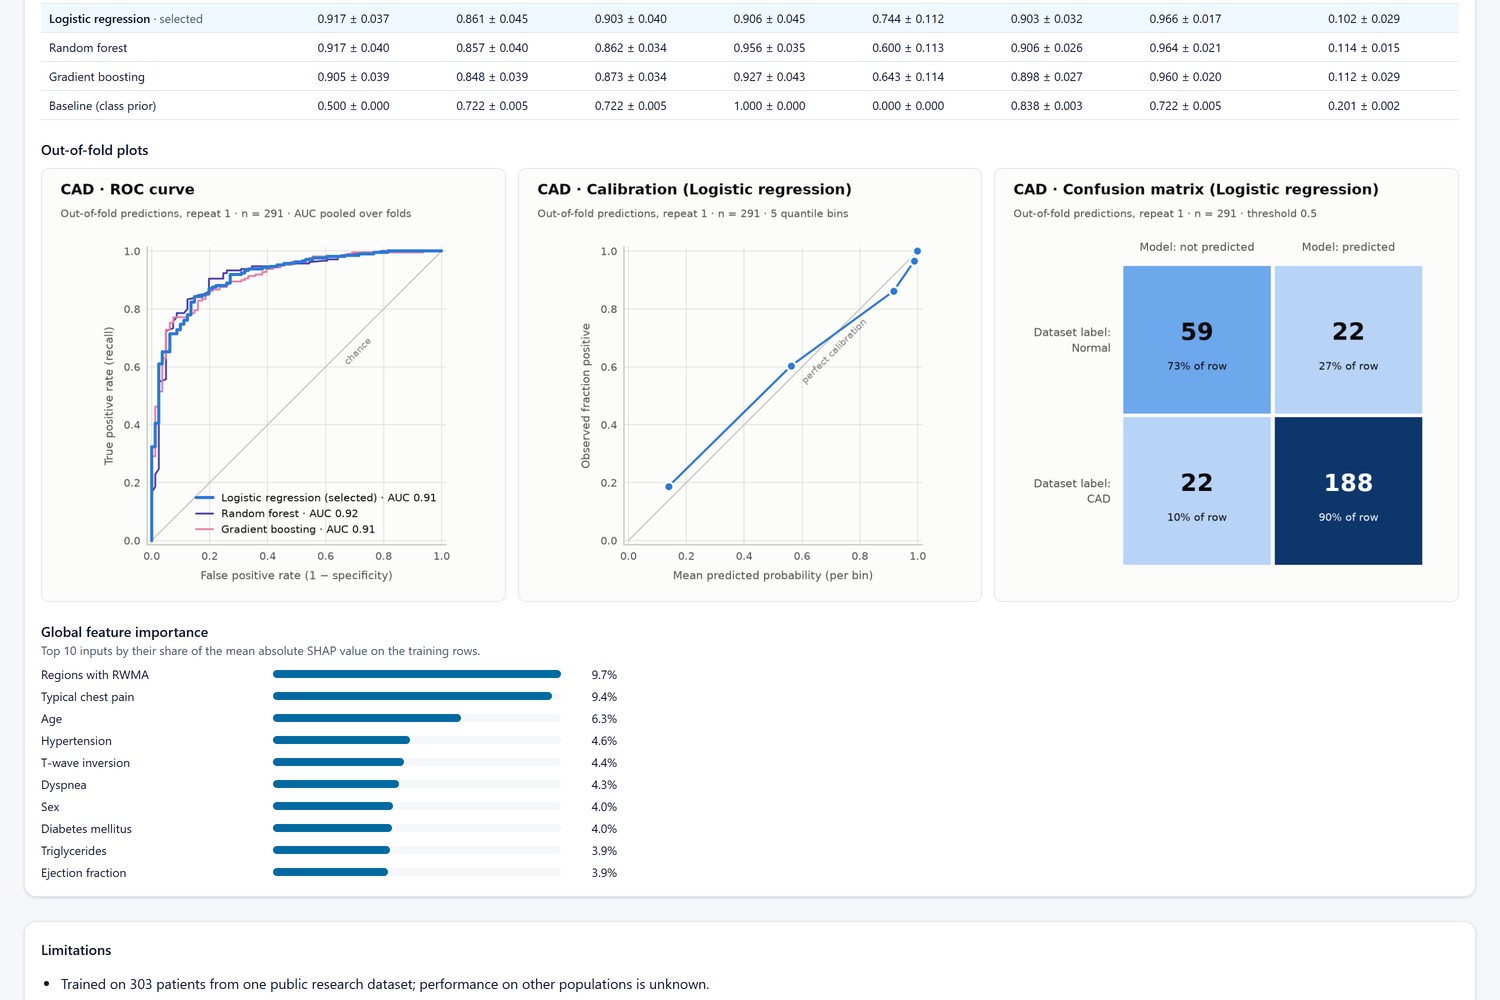
Out-of-fold ROC, calibration and confusion plots for the CAD model, plus its top 10 inputs by SHAP
-
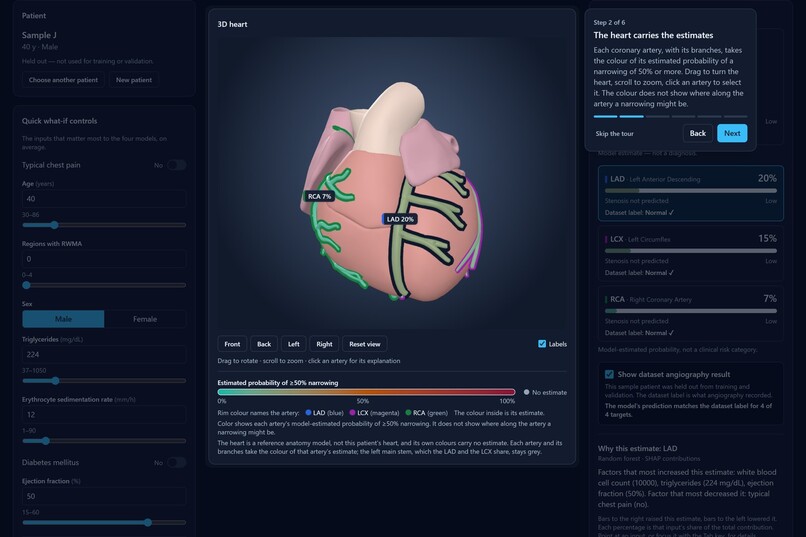
Dark theme with the guided tour, step 2 of 6: how the heart carries the estimates
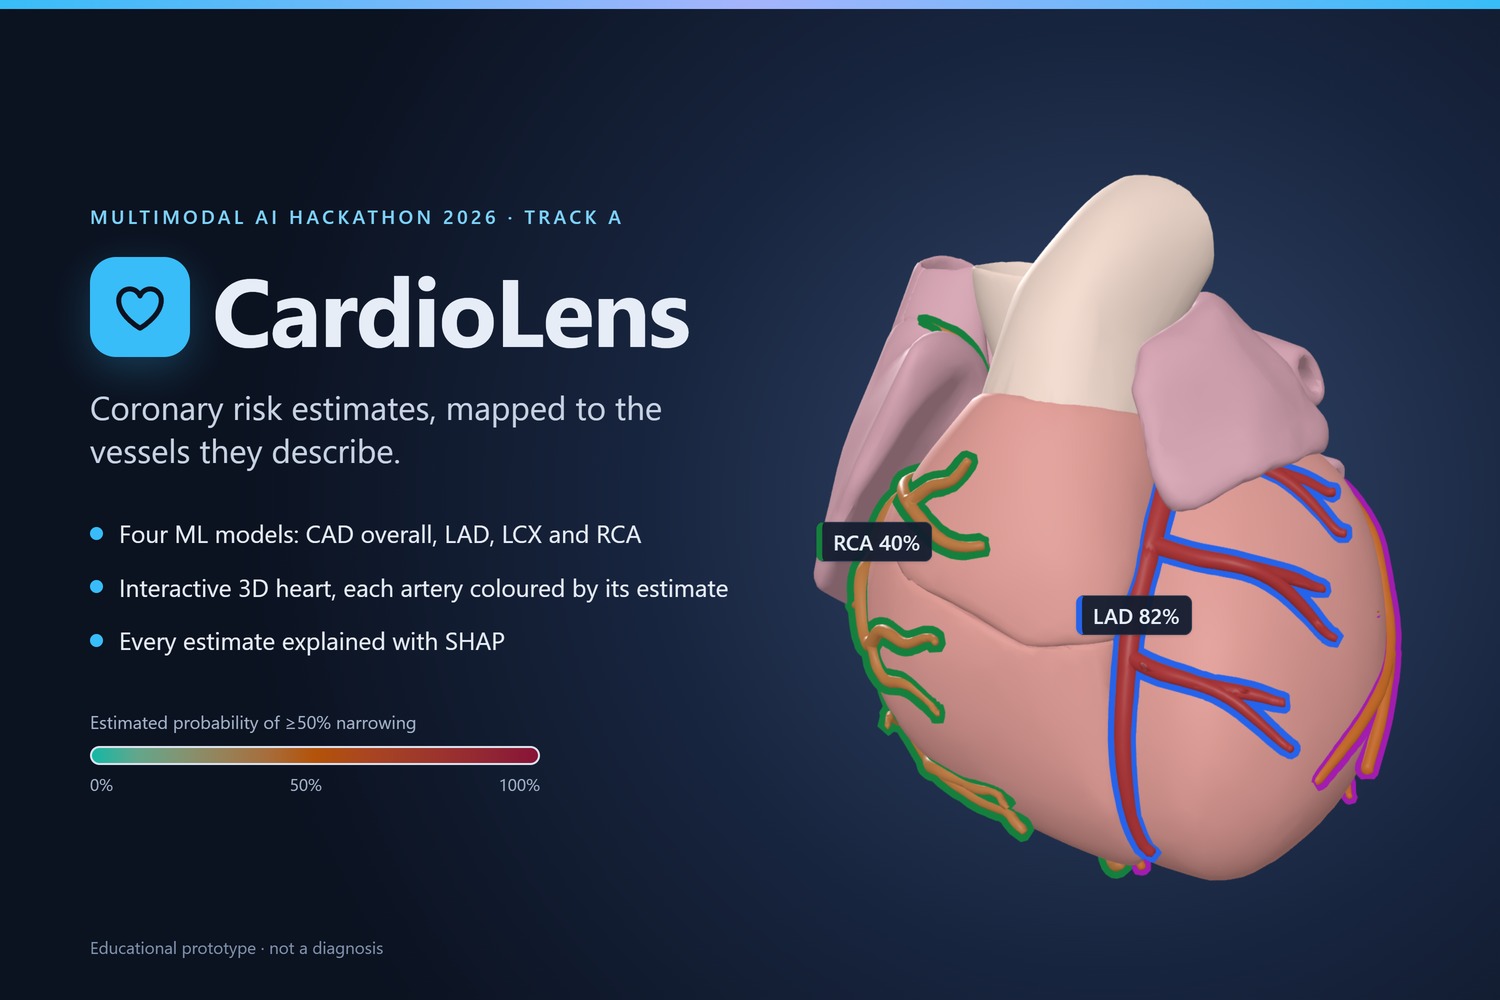
Educational prototype. CardioLens gives model estimates from a small public research dataset. They are not a diagnosis and not a substitute for clinical evaluation or diagnostic imaging such as coronary angiography.
Inspiration
A single risk number does not say which coronary artery a model is concerned about, or why. Track A asks for three things in one tool: vessel-level prediction, a 3D view of where the risk belongs, and an explanation a reader can follow. CardioLens tries to give all three on one screen, and to be open about how far a small dataset can take them.
What it does
From one patient's routine clinical data, CardioLens estimates the probability of coronary artery disease (CAD) overall and of a narrowing of 50% or more in each of the three main coronary arteries: LAD, LCX and RCA.
- Four estimates from four models. Each target has its own classifier, all on the same 54 clinical inputs: demographics and history, symptoms and examination, ECG findings, laboratory values and echo findings.
- A 3D heart that carries the estimates. Each artery, with its branches, takes the colour of its estimated probability (teal → amber → crimson) and keeps a rim of its own colour (LAD blue, LCX magenta, RCA green) so the three can be told apart. Rotate, zoom, hover for a tooltip, click an artery to select it. The legend says what the colour means and what it does not: it is the probability for that artery, not the place of a narrowing.
- An explanation for every estimate. SHAP contributions for the selected target, with each input's value, unit, percentile among the training patients and share of the total contribution, plus a short plain-language summary.
- What-if. Change an input and the estimates, artery colours and explanations update together in about half a second, with "before → after" on every estimate. The app says this shows how the model responds, not the effect of a treatment, and flags combinations of inputs that no patient in the dataset has.
- Twelve sample patients with their real labels. Six with CAD and six without, by the dataset's angiography labels, all held out before training. Each card shows the models' estimates, and the app can show the dataset label next to each estimate, with a mark where the model is wrong.
- A patient of your own. A form of all 54 inputs that starts from typical values or from any sample patient and names every value outside the range seen in the dataset.
- An evaluation page. Cross-validated metrics for every candidate model and a baseline, ROC, calibration and confusion plots, the most important inputs per target, and the limitations.
- Five pages, two themes, one tour. Home, Patients, New patient, Analysis and Model & method; light and dark themes with the same risk colours; a six-step guided tour for a first visit.
How I built it
- Data. The UCI extention of Z-Alizadeh sani dataset: 303 patients, 59 columns, CC BY 4.0. Twelve patients are held out as sample patients by a fixed, seeded rule; the other 291 are the training rows.
- Leakage guard. The four angiography columns (
LAD,LCX,RCA,Cath) are never model inputs. The guard sits in the data loader, the preprocessor, the trainer and the API's start-up check, and tests cover each place. - Models and validation. For each target, logistic regression, a random forest and gradient boosting are compared against a baseline with repeated stratified 5-fold cross-validation (5 repeats, 25 folds), with preprocessing refitted inside every fold. Nothing is tuned; when logistic regression is within 0.01 ROC-AUC of the best model, the simpler model is kept. Seeds and versions are fixed, and one command retrains everything in about a minute.
- Backend. A FastAPI service (scikit-learn, SHAP, pandas) loads the four models once and returns four probabilities and four SHAP explanations per request, with a median of 88 ms from the browser on a laptop. Inputs are not stored or logged, and the app calls no outside service.
- 3D. The heart is built from BodyParts3D anatomy parts into one 0.66 MB glTF file. The arteries are that model's own meshes, a trunk and its named branches per vessel. The same four ids (
cad,lad,lcx,rca) run through the training code, the API and the names of the 3D objects, and tests check that they match. A frame takes about 1 ms on integrated graphics; without WebGL the app falls back to a 2D schematic. - Frontend. React, TypeScript, Vite, Tailwind CSS and React Three Fiber (three.js). The input form is built from the schema the service sends.
- Tests and running. 229 backend tests (pytest) and 391 frontend tests (Vitest).
docker compose up --buildstarts both parts; the trained models are in the repository, so nothing has to be trained first.
Results
Cross-validated on 291 patients, mean ± standard deviation over 25 folds, threshold 0.5:
| Target | Selected model | ROC-AUC | Recall | Specificity |
|---|---|---|---|---|
| CAD | Logistic regression | 0.917 ± 0.037 | 0.906 ± 0.045 | 0.744 ± 0.112 |
| LAD | Random forest | 0.851 ± 0.049 | 0.896 ± 0.050 | 0.648 ± 0.099 |
| LCX | Random forest | 0.726 ± 0.076 | 0.429 ± 0.092 | 0.846 ± 0.063 |
| RCA | Logistic regression | 0.728 ± 0.057 | 0.539 ± 0.099 | 0.772 ± 0.064 |
A baseline that always predicts the class prior scores 0.500 on every target. On the twelve held-out patients, 39 of the 48 predictions match the dataset labels. Twelve patients are an illustration, not an evaluation.
Challenges I ran into
- Keeping each estimate on the right artery. One id per target from the training code to the 3D object names, with tests that load the shipped heart model and check each vessel's mesh.
- Labels on real anatomy. The circumflex artery runs behind the heart. Labels sit where an artery can be seen and hide when the heart covers it, and choosing a vessel in the list turns the heart to a view that shows it.
- A small dataset. With 291 training rows, every choice had to avoid fitting noise: no tuning, repeated cross-validation with the spread reported, a baseline next to every model, and the weaker results shown as they are.
Accomplishments that I'm proud of
- Every estimate is tied to its artery end to end, from the training code to the 3D object names, and tests check it.
- The evaluation is honest: the weaker LCX and RCA models are shown as they are, and the held-out patients show the model's misses, not only its hits.
- It is fast and private: about 88 ms per prediction, about 1 ms per 3D frame, no stored inputs and no outside services.
What I learned
- Routine clinical findings say much more about whether a patient has CAD (ROC-AUC 0.917) than about which artery is affected (0.73 for LCX and RCA).
- On a small dataset the spread across folds matters as much as the mean, and a baseline belongs next to every model.
- A SHAP value means little on its own. It becomes readable with the input's value, unit and percentile beside it.
What's next
- Reading a medical report. Today the inputs are typed in or taken from a sample patient. Filling them in from an uploaded report is not built yet; every value read that way would have to be confirmed by the user before it is analysed.
- Evaluation beyond one dataset. The models have only been tested on one public dataset of 303 patients; their performance on other populations is unknown.
Limitations
- Trained on 303 patients from one public research dataset.
- Inputs are recorded clinical findings, not raw ECG, echo or imaging data.
- Vessel predictions are per artery; the dataset contains no location of narrowing within an artery.
- Cross-validated metrics have wide uncertainty at this sample size (shown as ± std).
- What-if changes show model sensitivity, not the effect of any treatment.
Credits
- Dataset: Alizadehsani, R., Roshanzamir, M., & Sani, Z. (2013). extention of Z-Alizadeh sani dataset. UCI Machine Learning Repository. https://doi.org/10.24432/C5461K. CC BY 4.0.
- 3D anatomy: BodyParts3D.
- Libraries: scikit-learn, SHAP, pandas, NumPy, FastAPI, Uvicorn, React, Vite, Tailwind CSS, three.js, React Three Fiber, drei.
Built With
- fastapi
- pandas
- pytest
- python
- react
- scikit-learn
- shap
- three.js
- typescript
- vitest


Log in or sign up for Devpost to join the conversation.