Inspiration
While exploring machine learning in healthcare, we came across several heart disease prediction projects. Most of them could generate a prediction, but we felt something was missing: understanding why the model made that prediction.
A number on a screen doesn't tell the whole story. We wanted to make the results easier to understand, especially for students and people who are not familiar with medical machine learning.
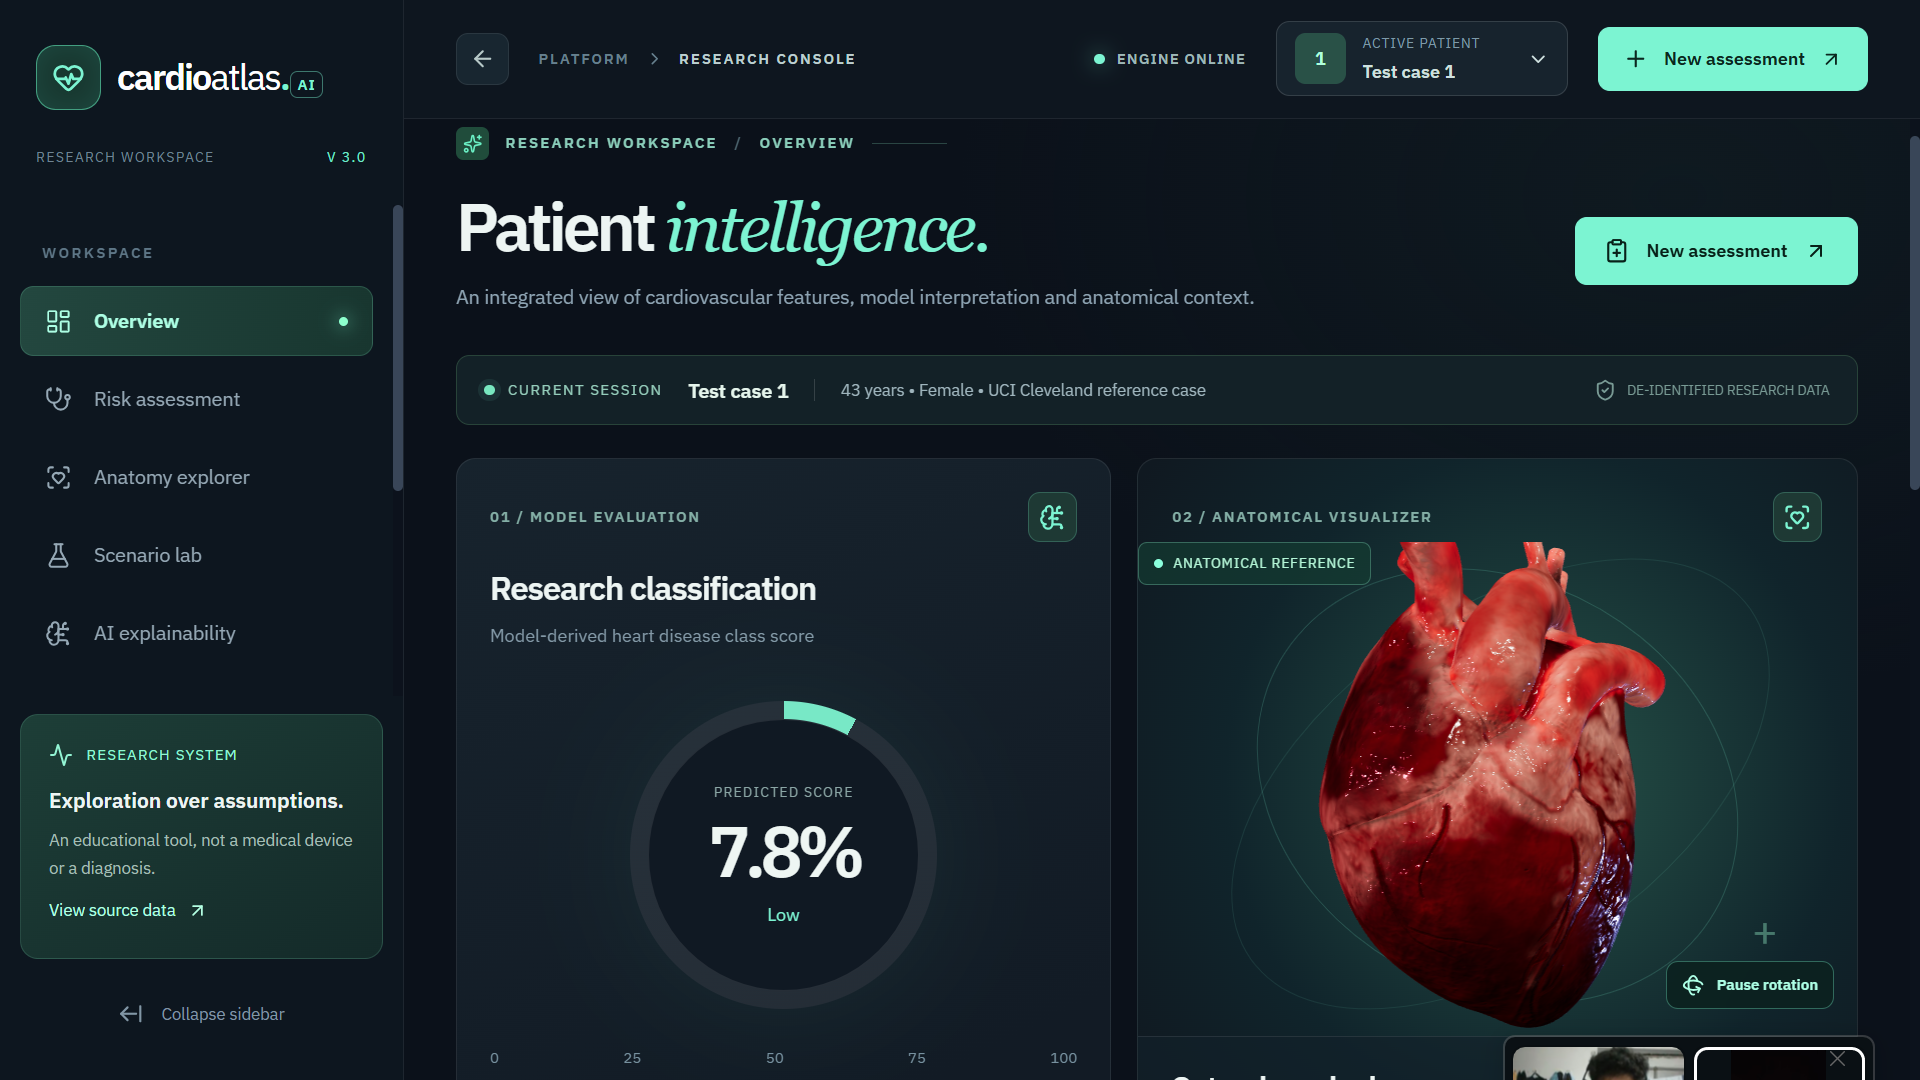
This inspired us to build Cardio Atlas AI, a platform that combines heart disease classification, explainable AI, and interactive 3D heart visualization.
What it does
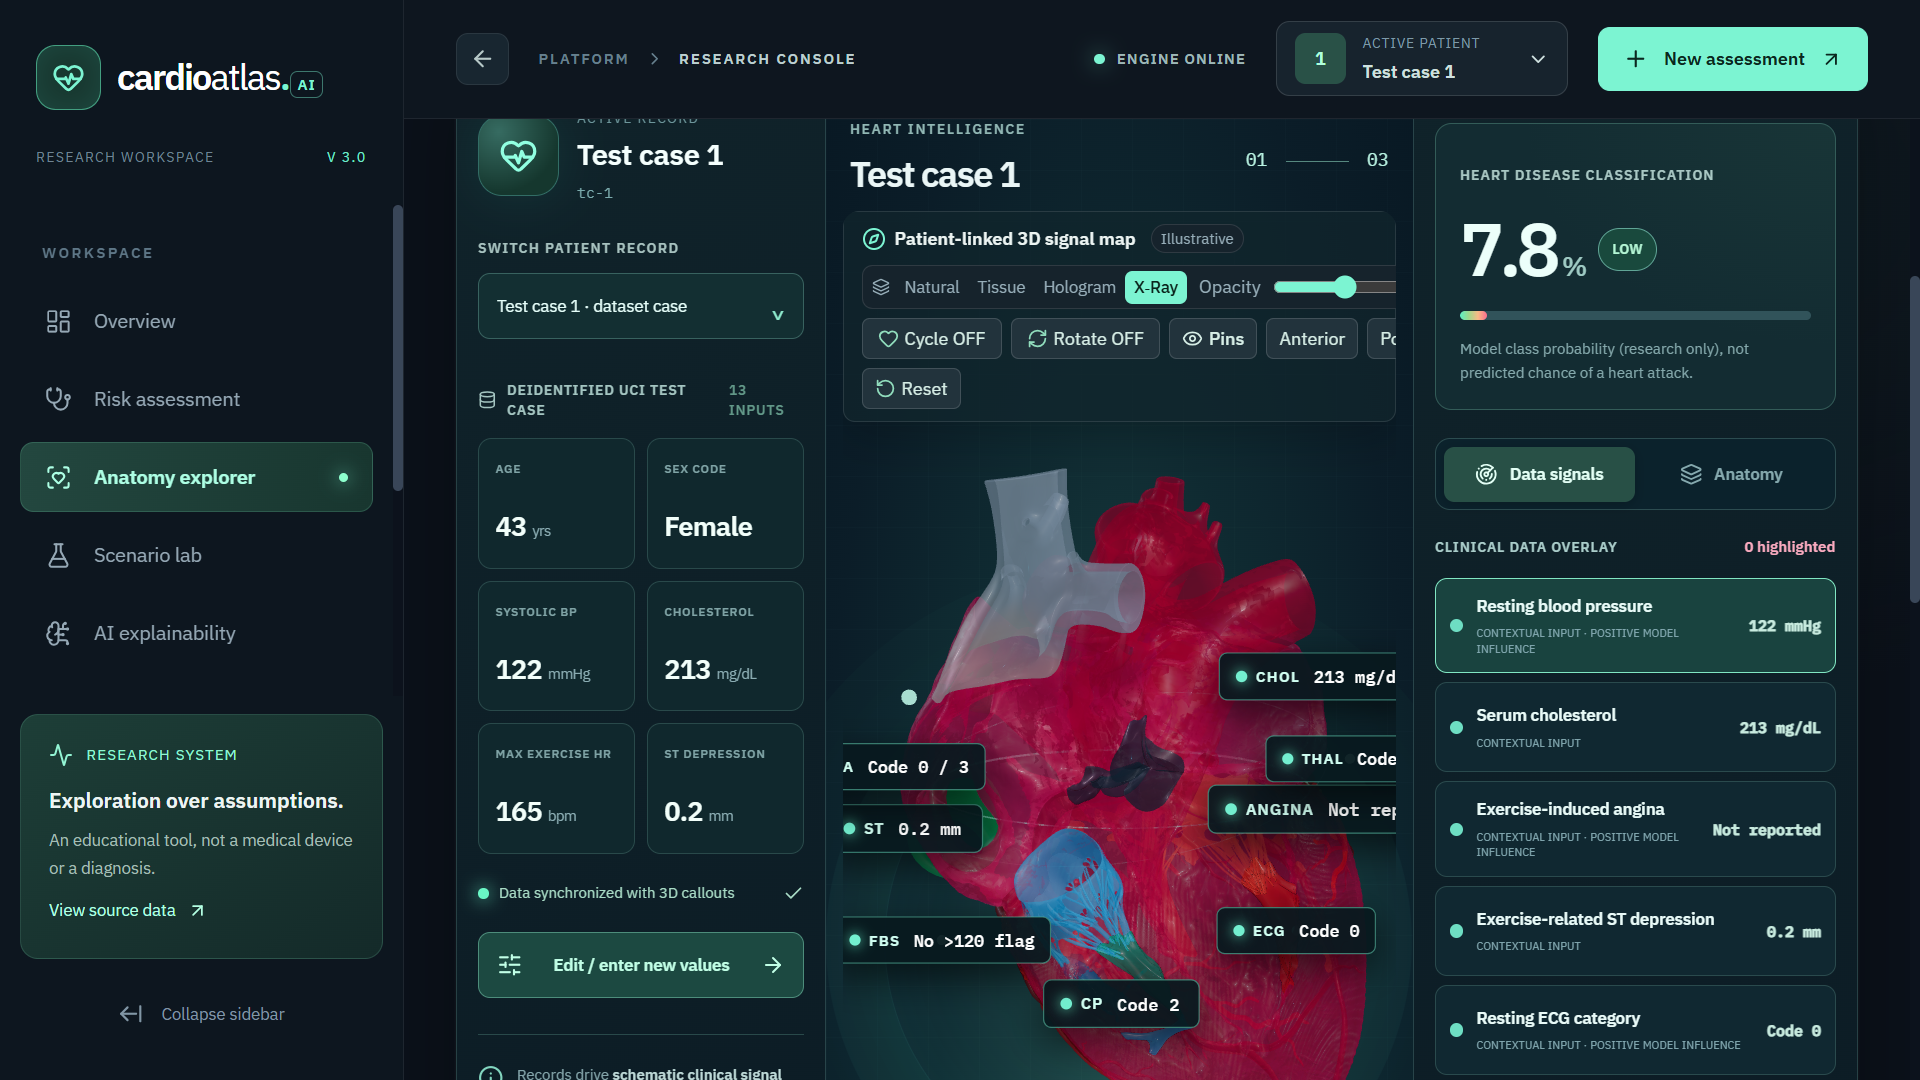
Cardio Atlas AI is a web-based platform that helps users explore cardiovascular data and understand machine-learning predictions.
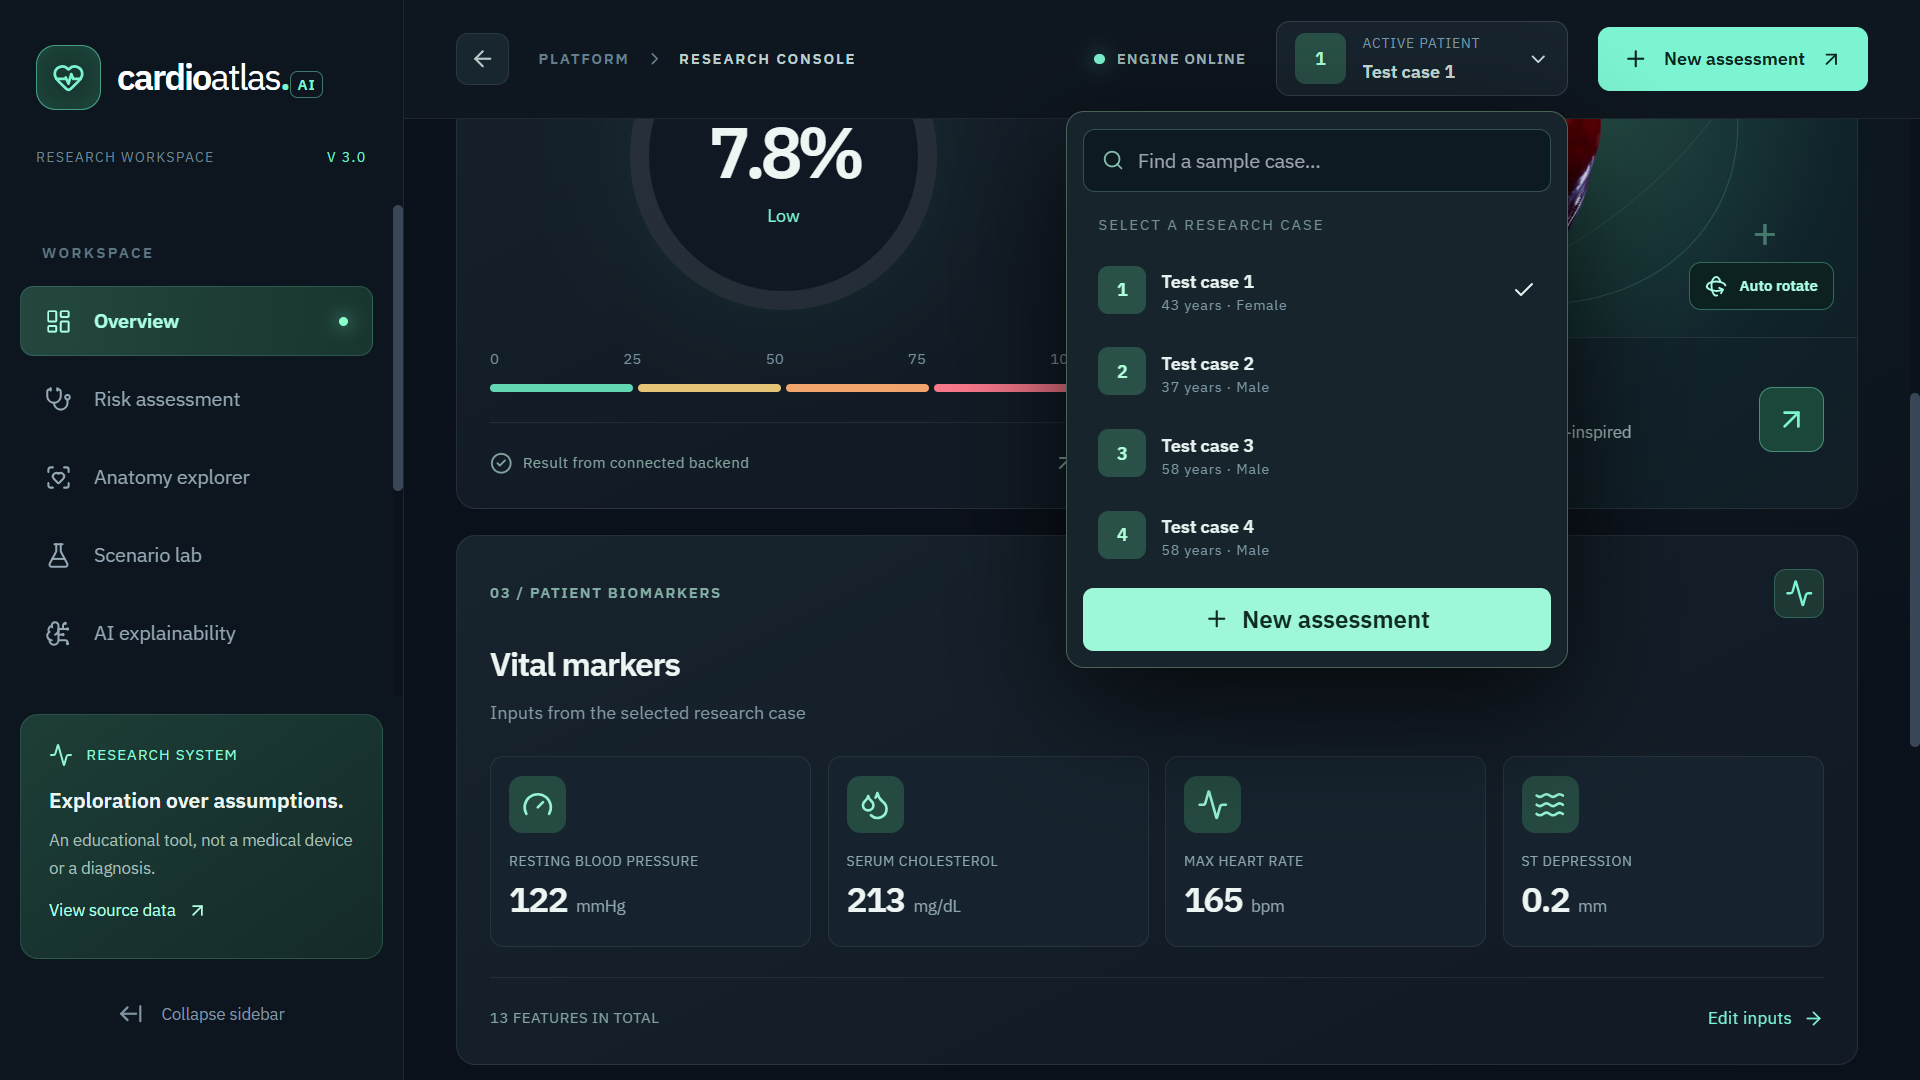
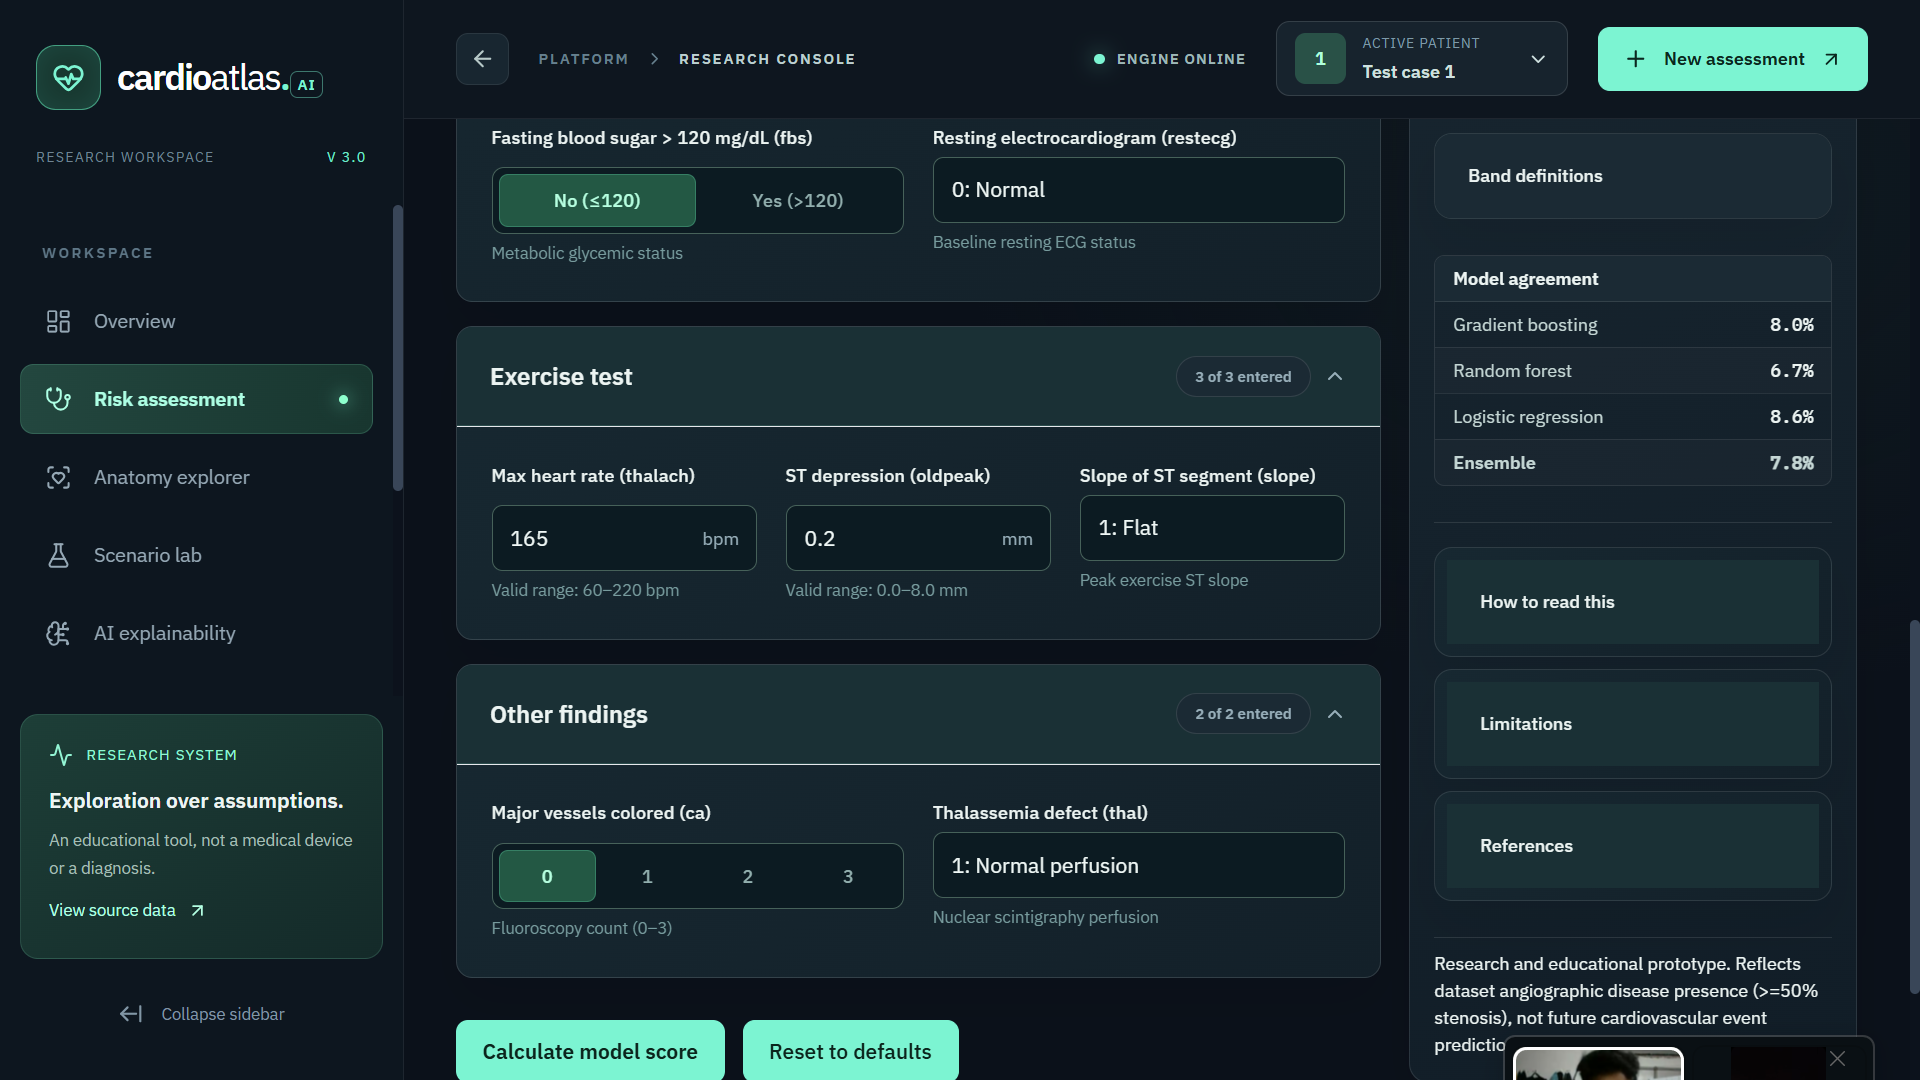
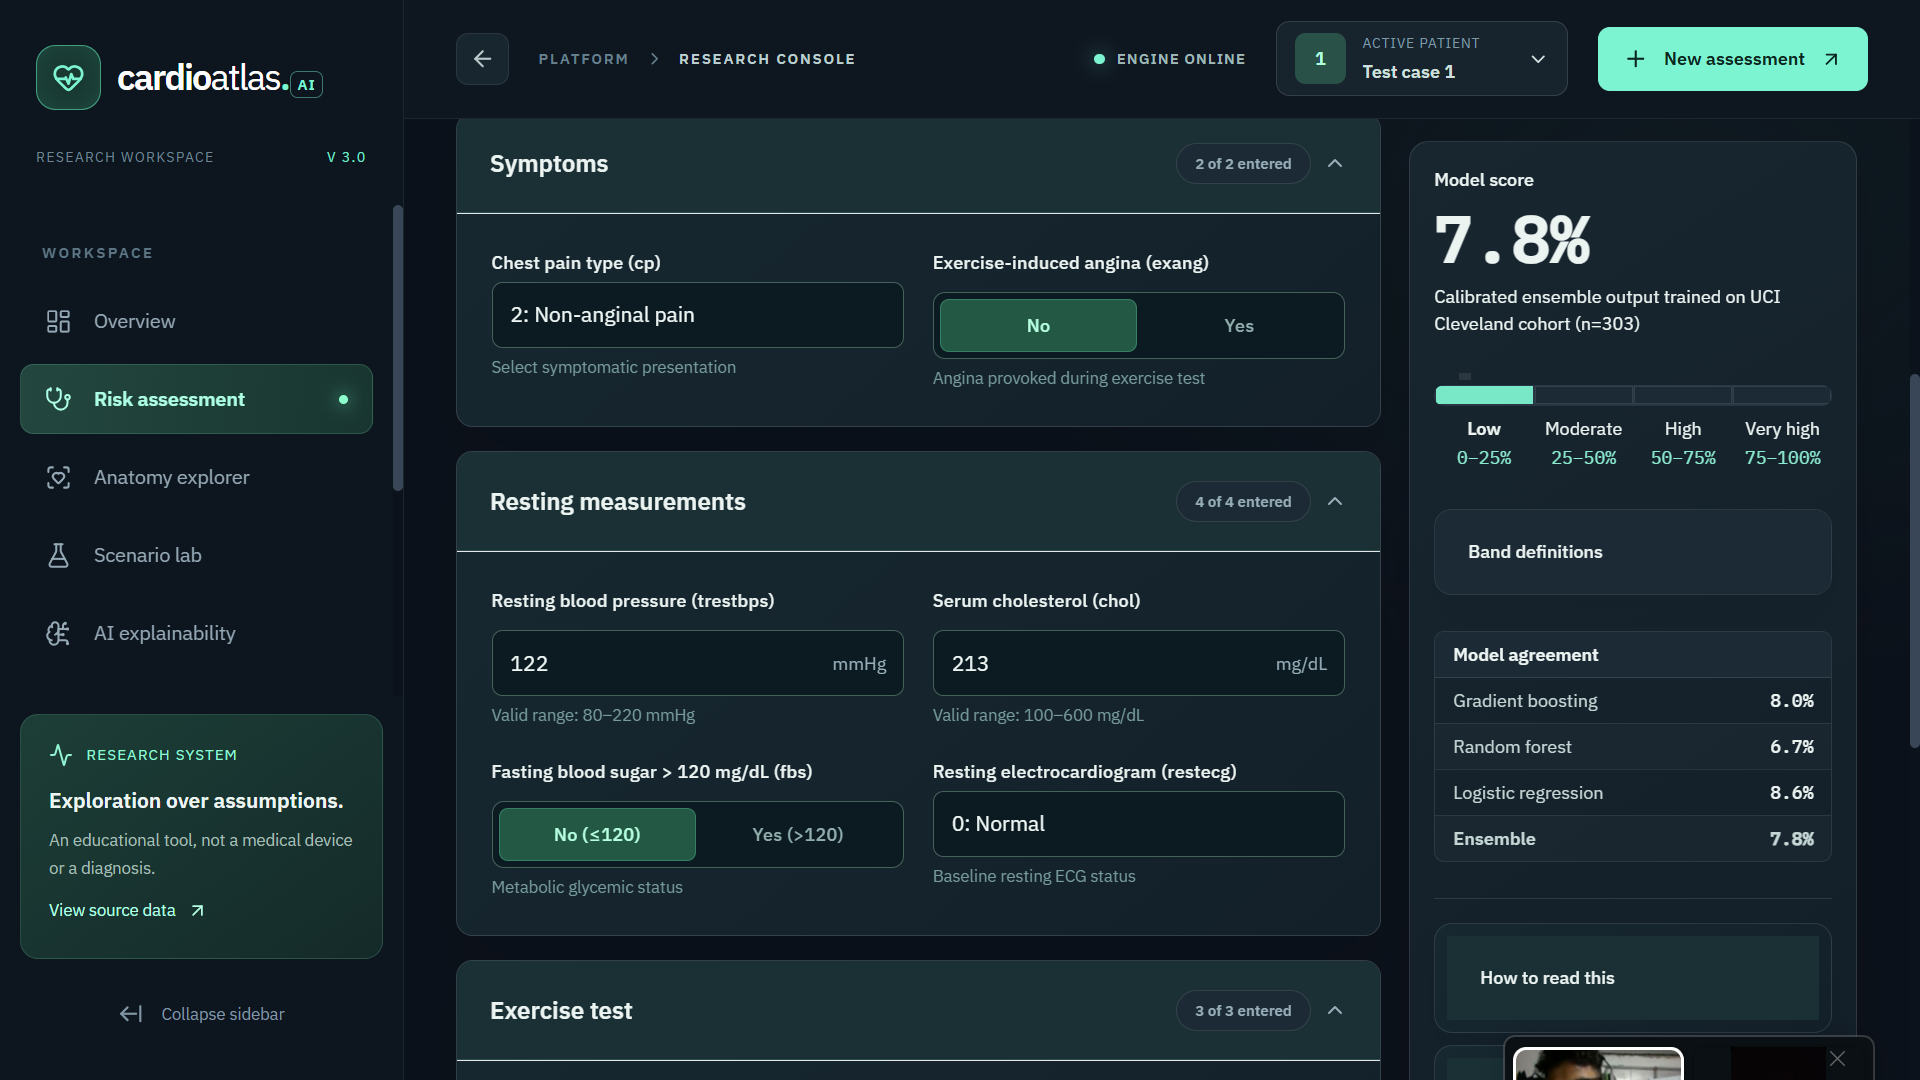
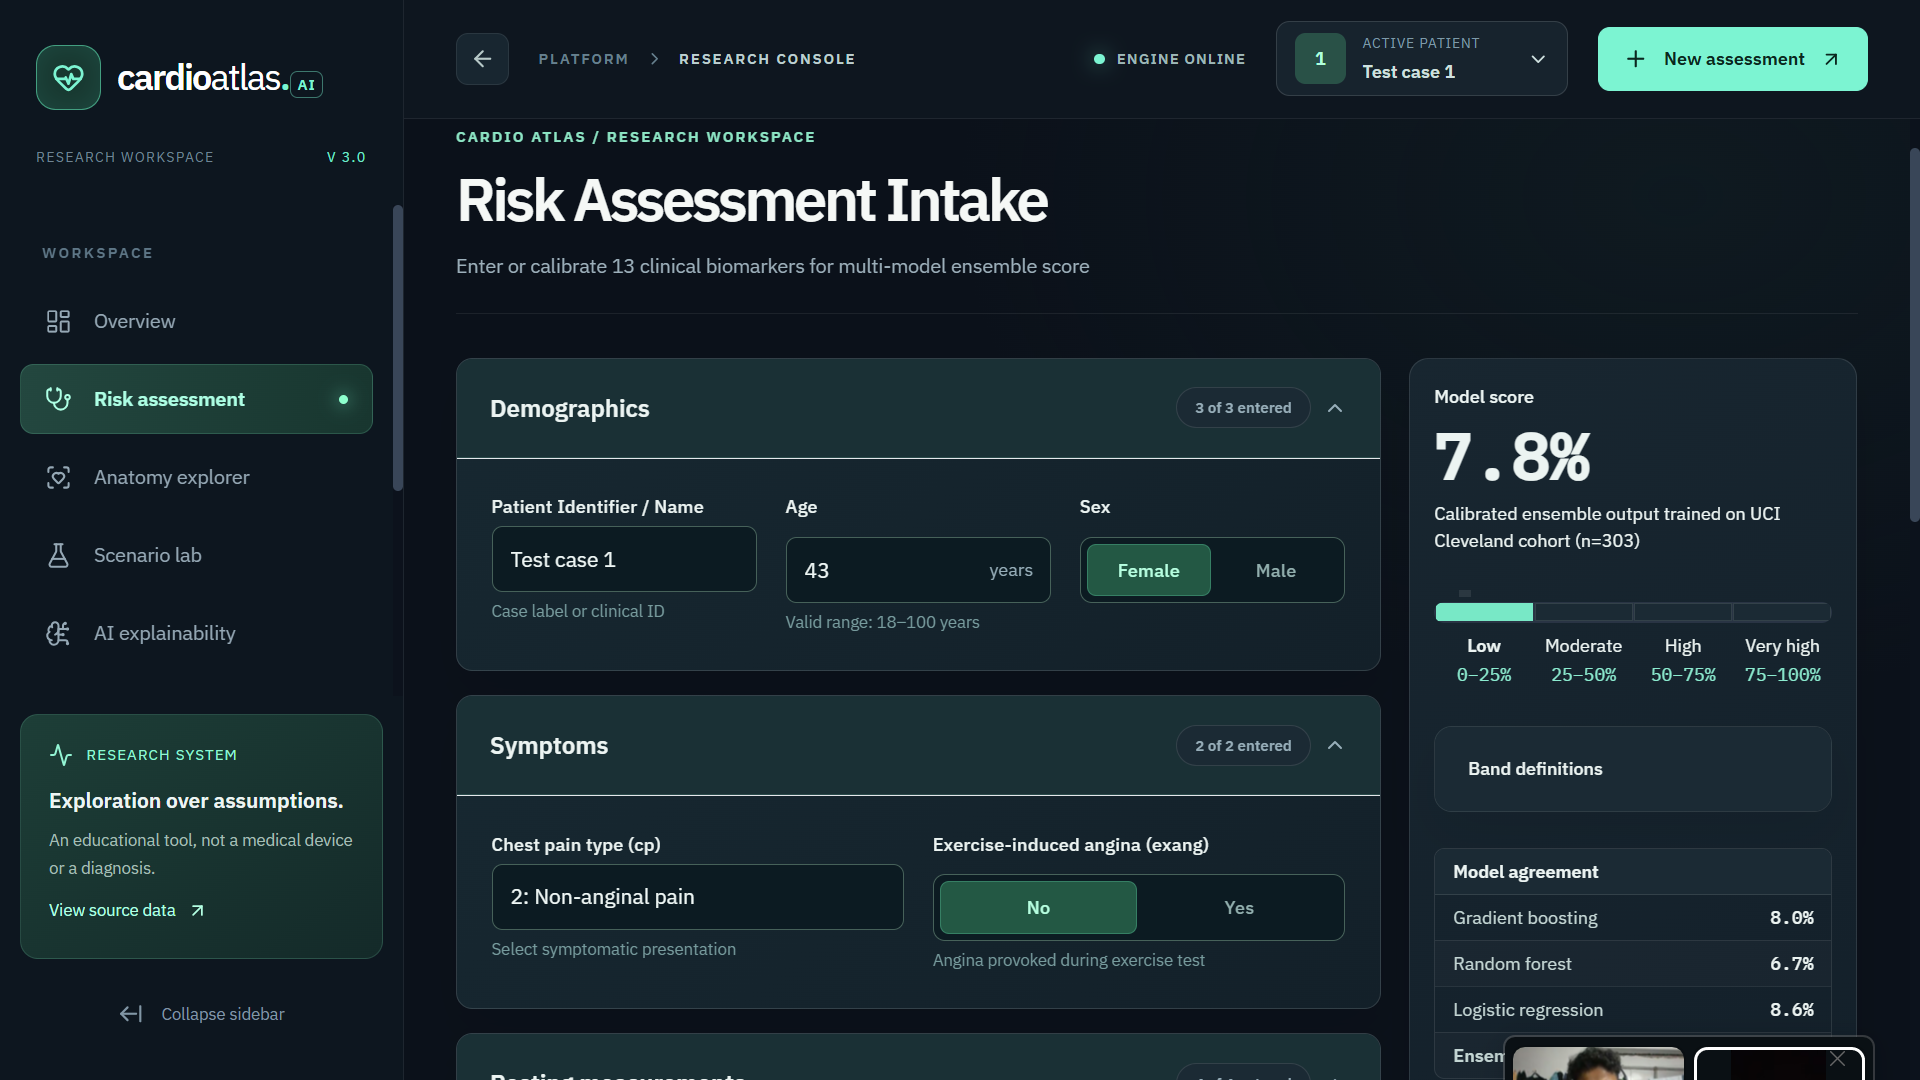
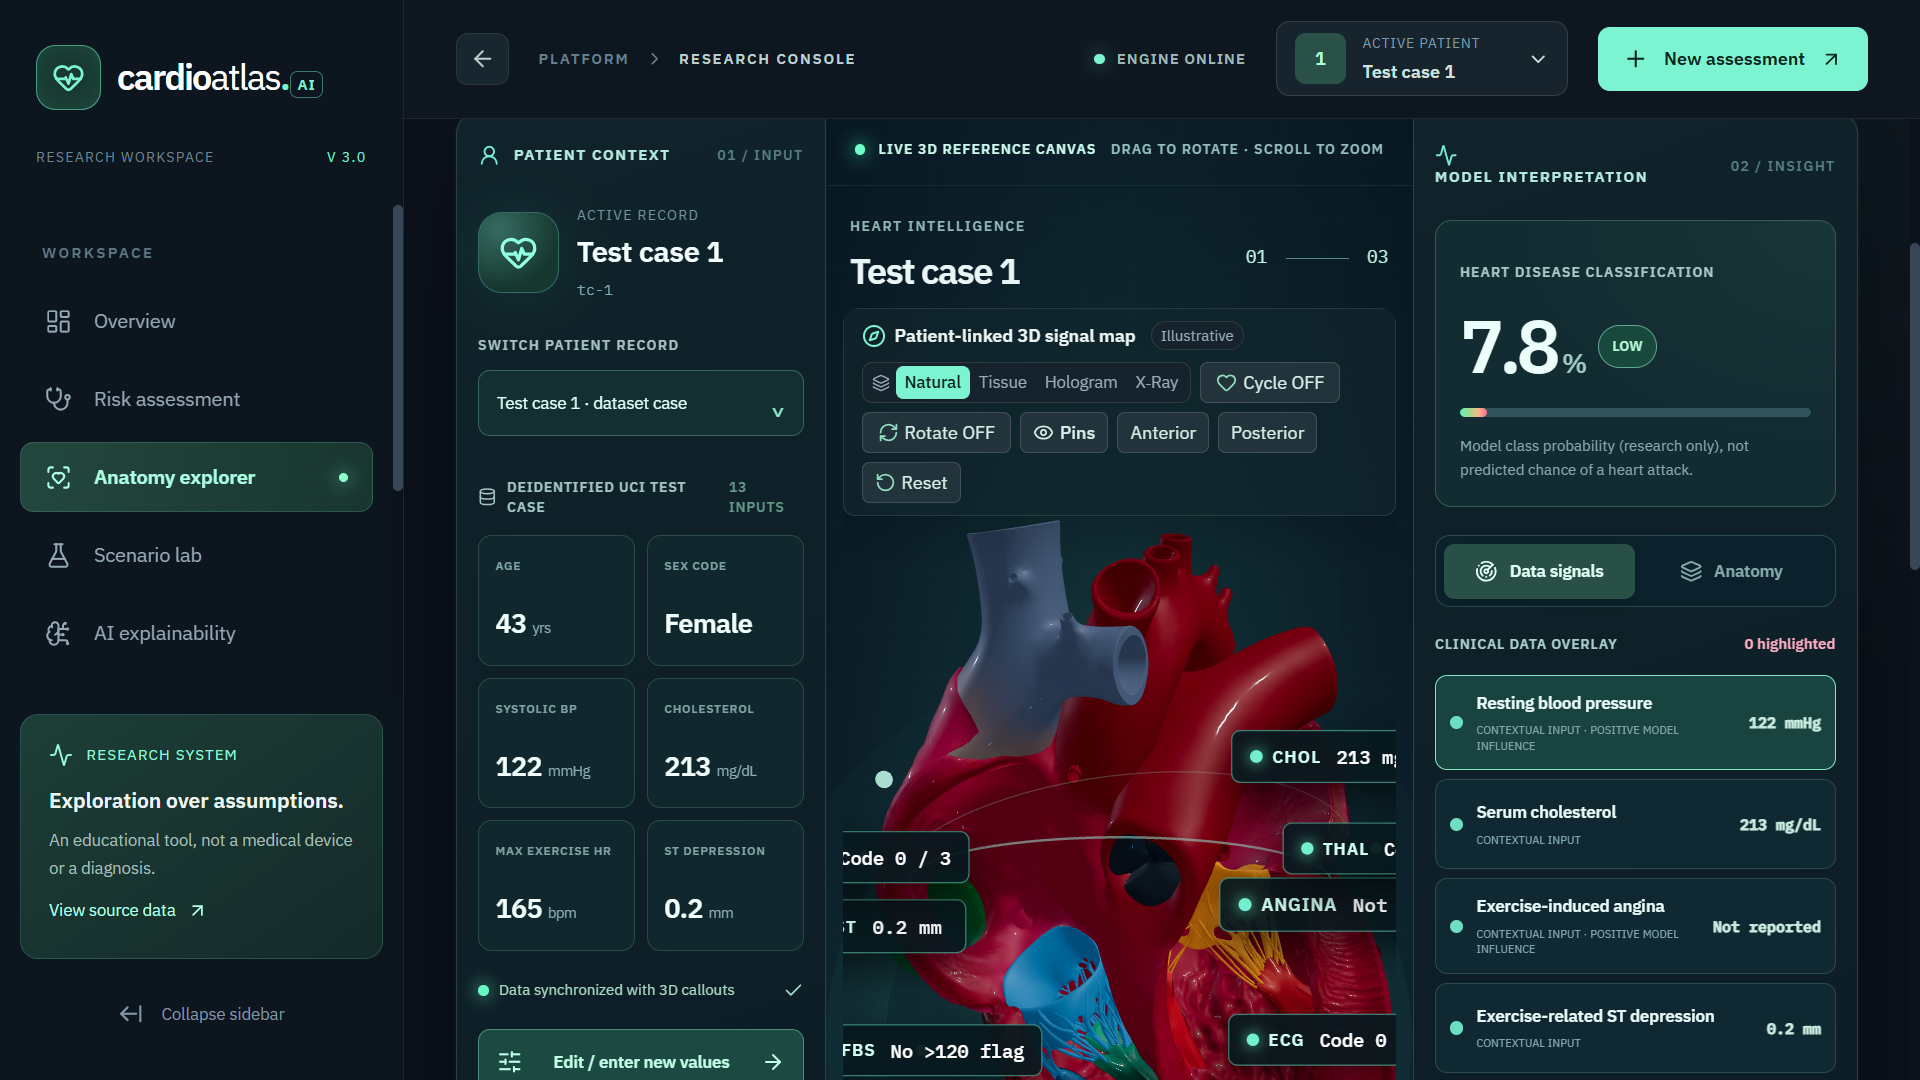
Users can enter 13 clinical parameters, including age, blood pressure, cholesterol, chest pain type, and ECG-related information.
The platform offers:
- Heart Disease Classification: Three machine-learning models work together to generate a classification score.
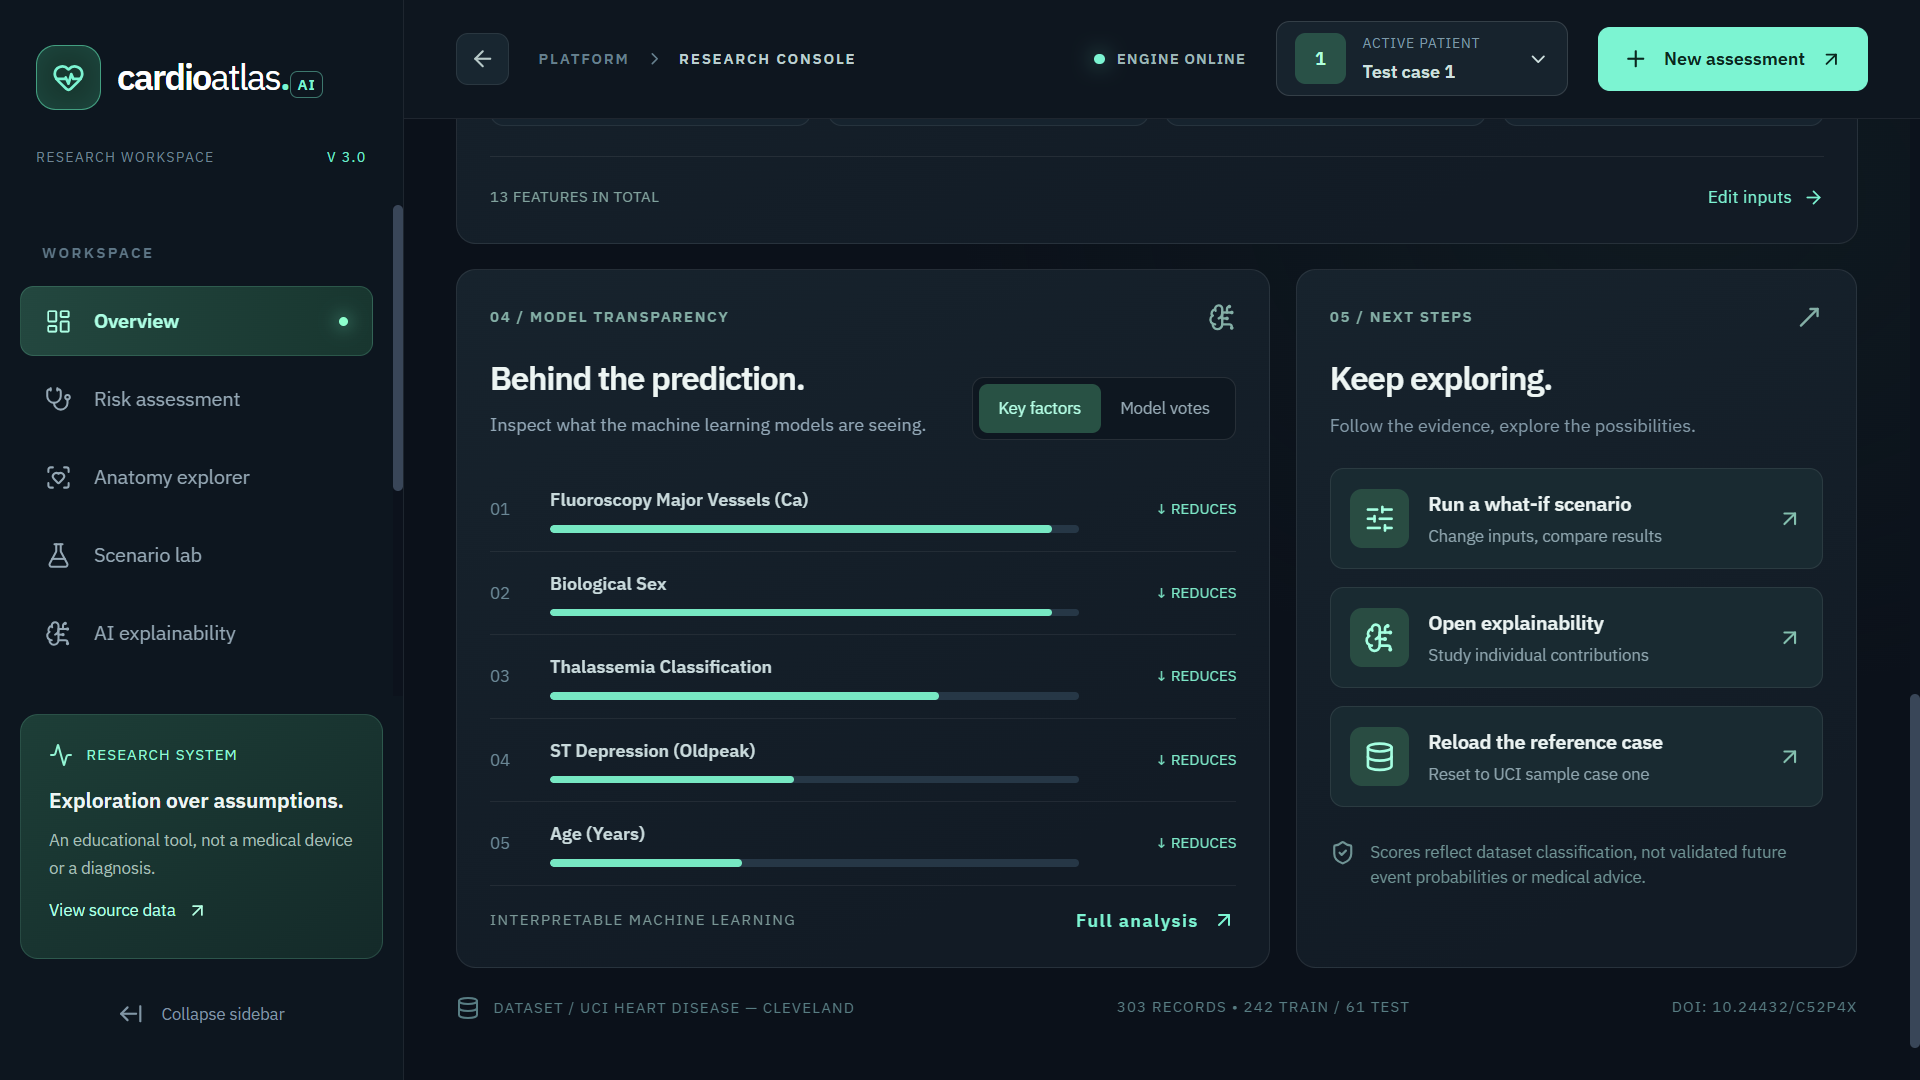
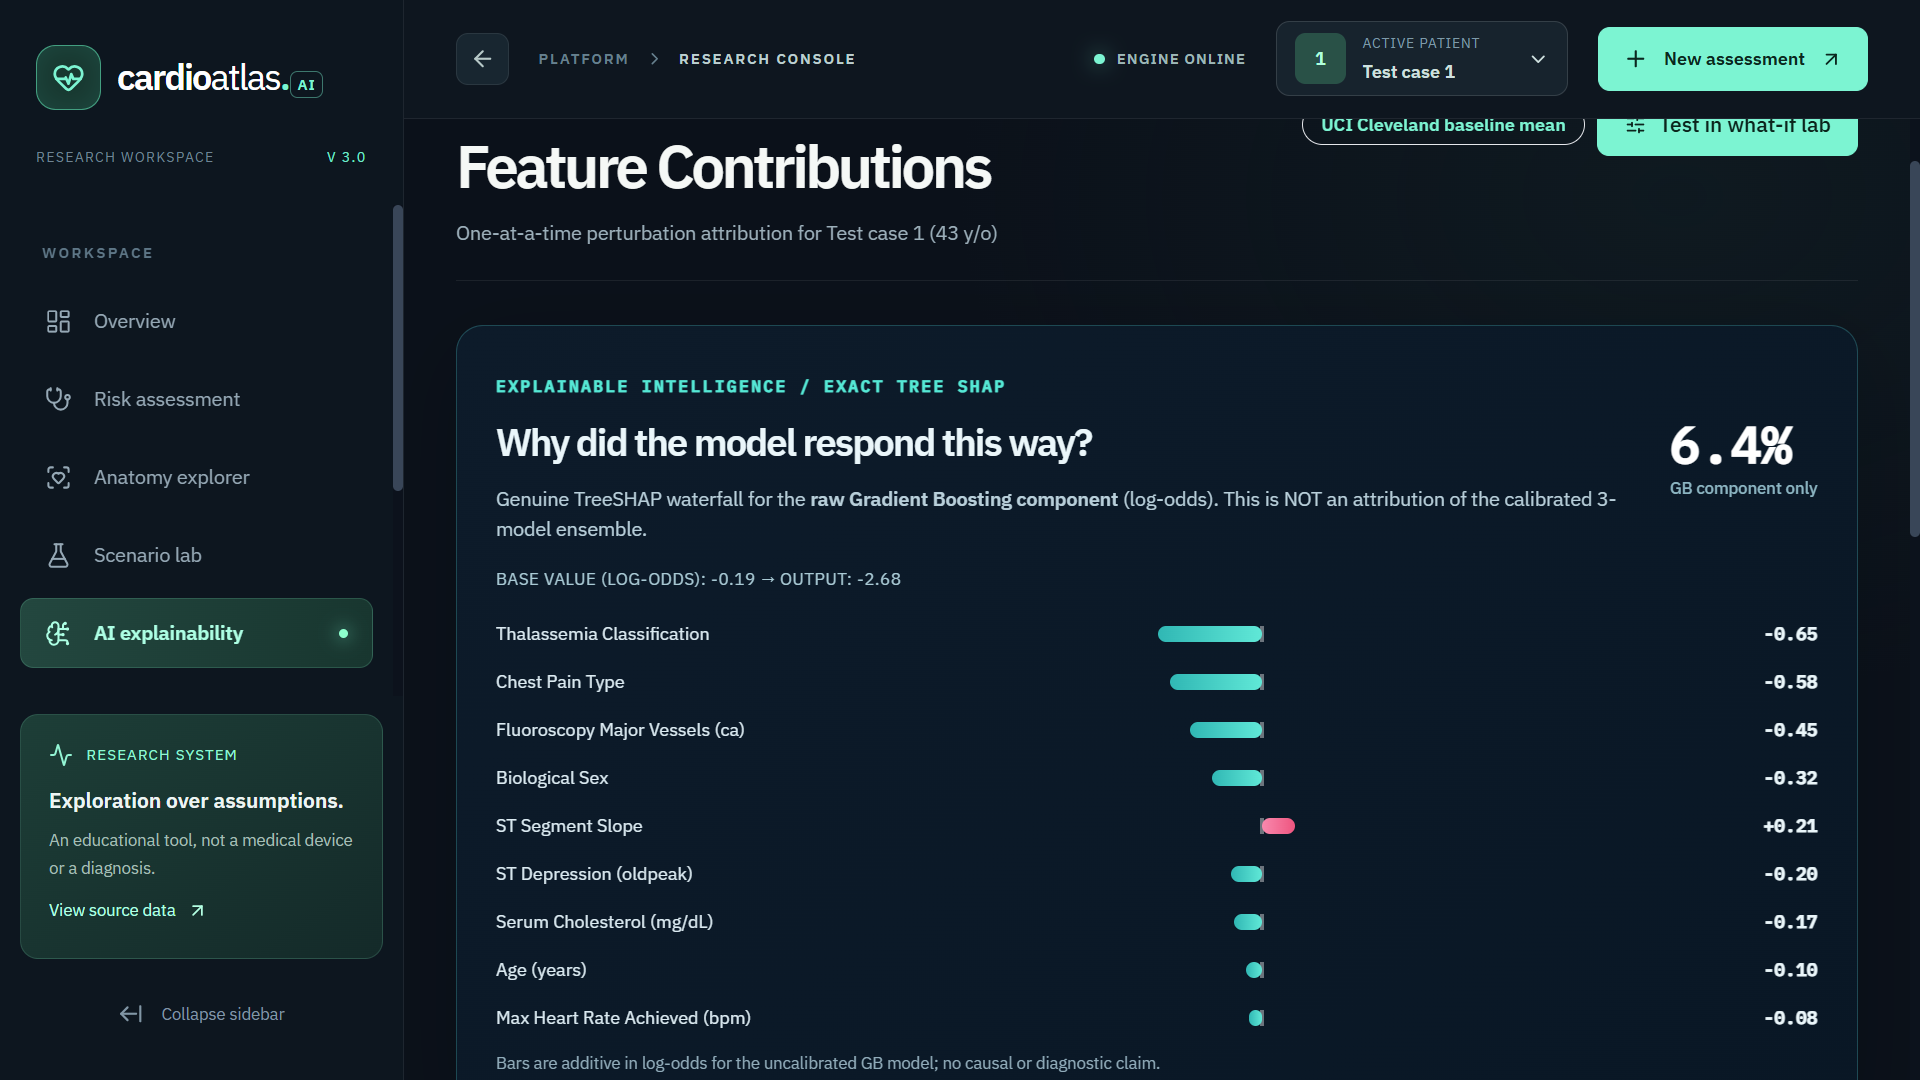
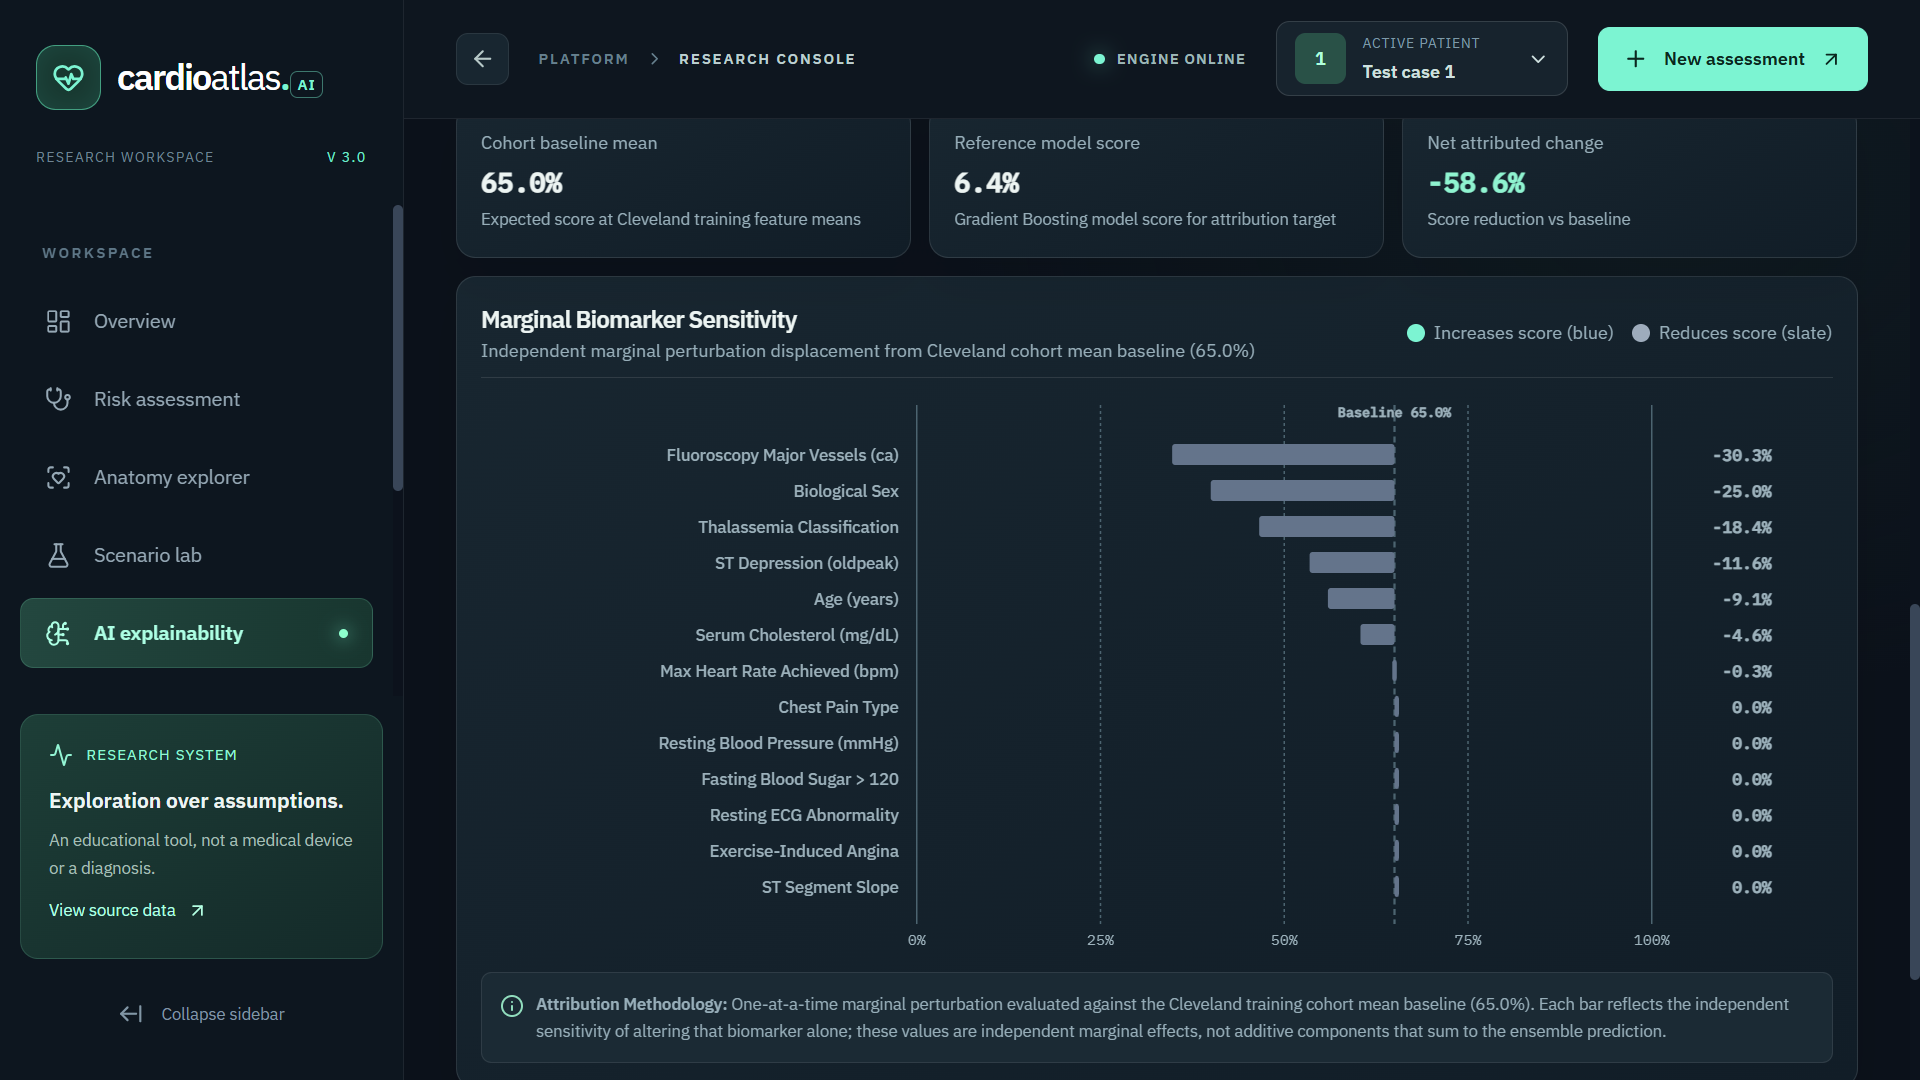
- Explainable AI: Feature explanations and SHAP analysis help users understand which inputs influence the prediction.
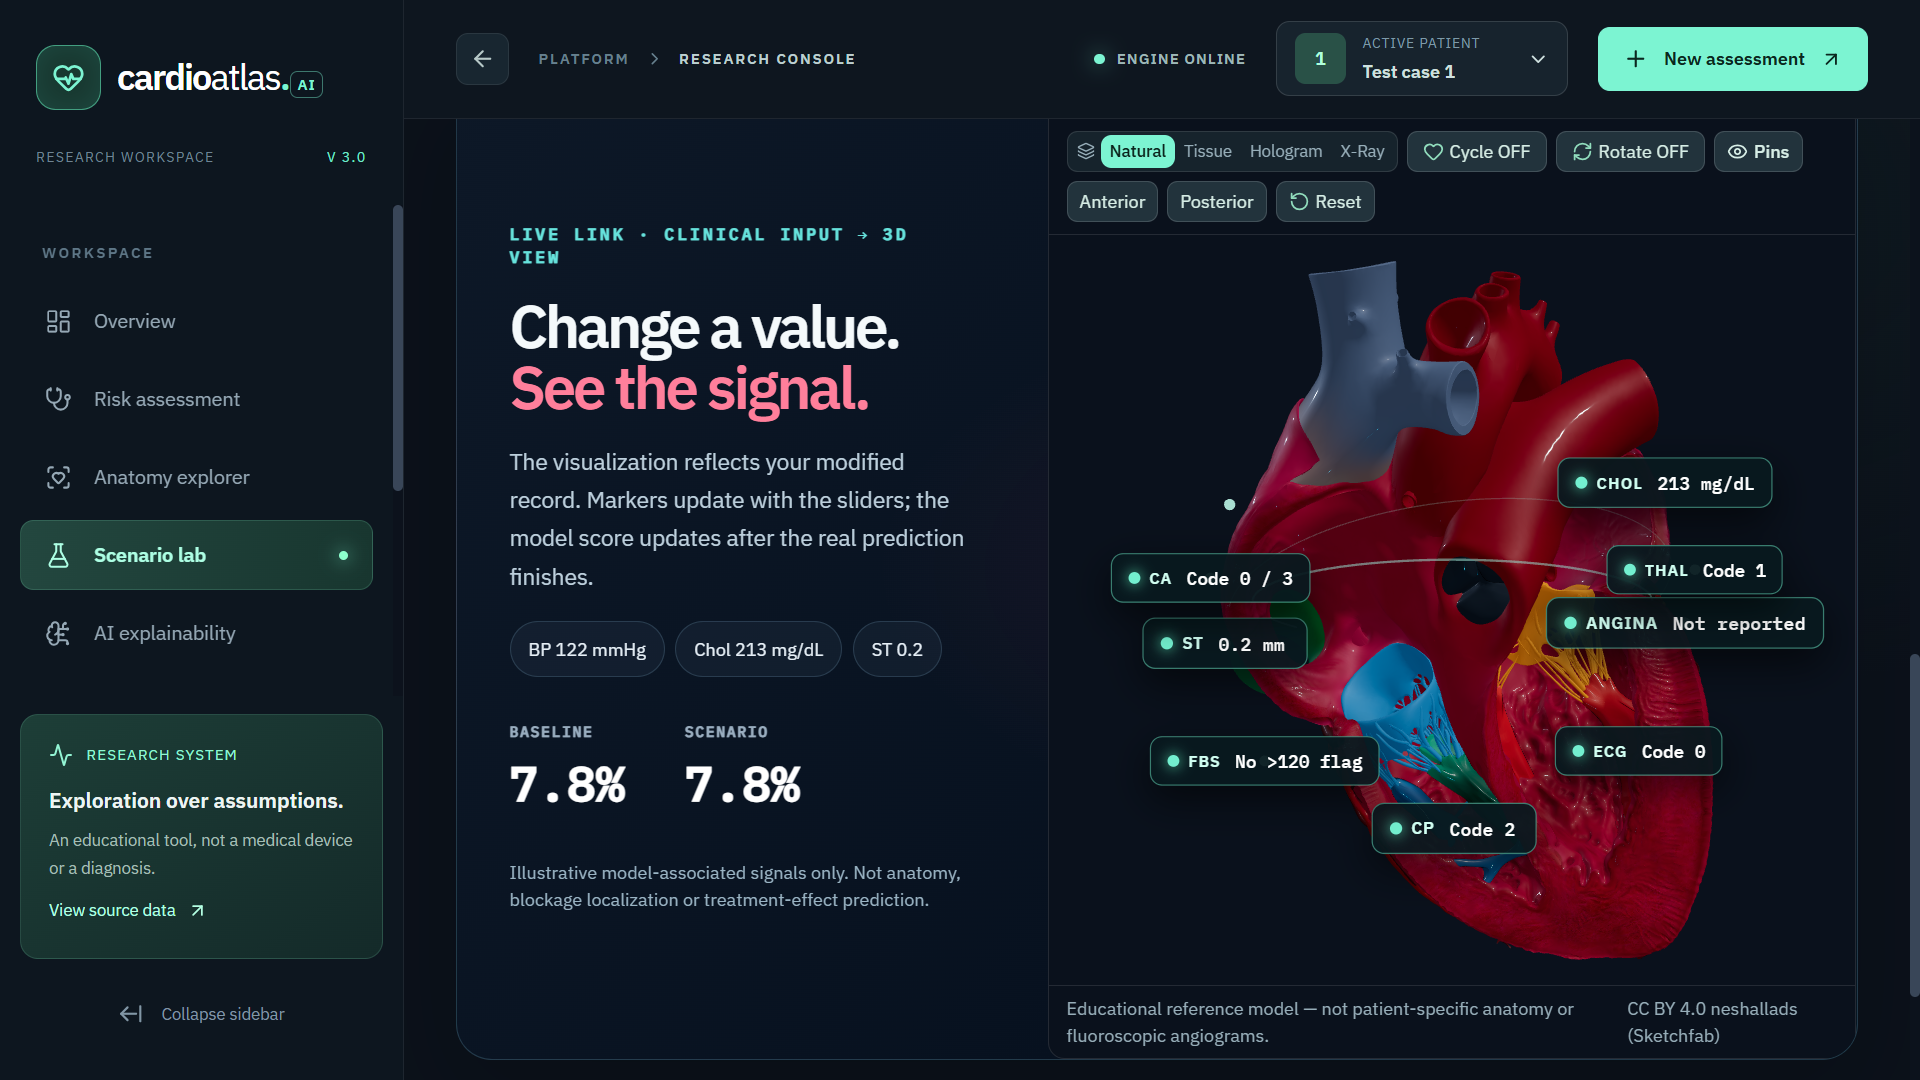
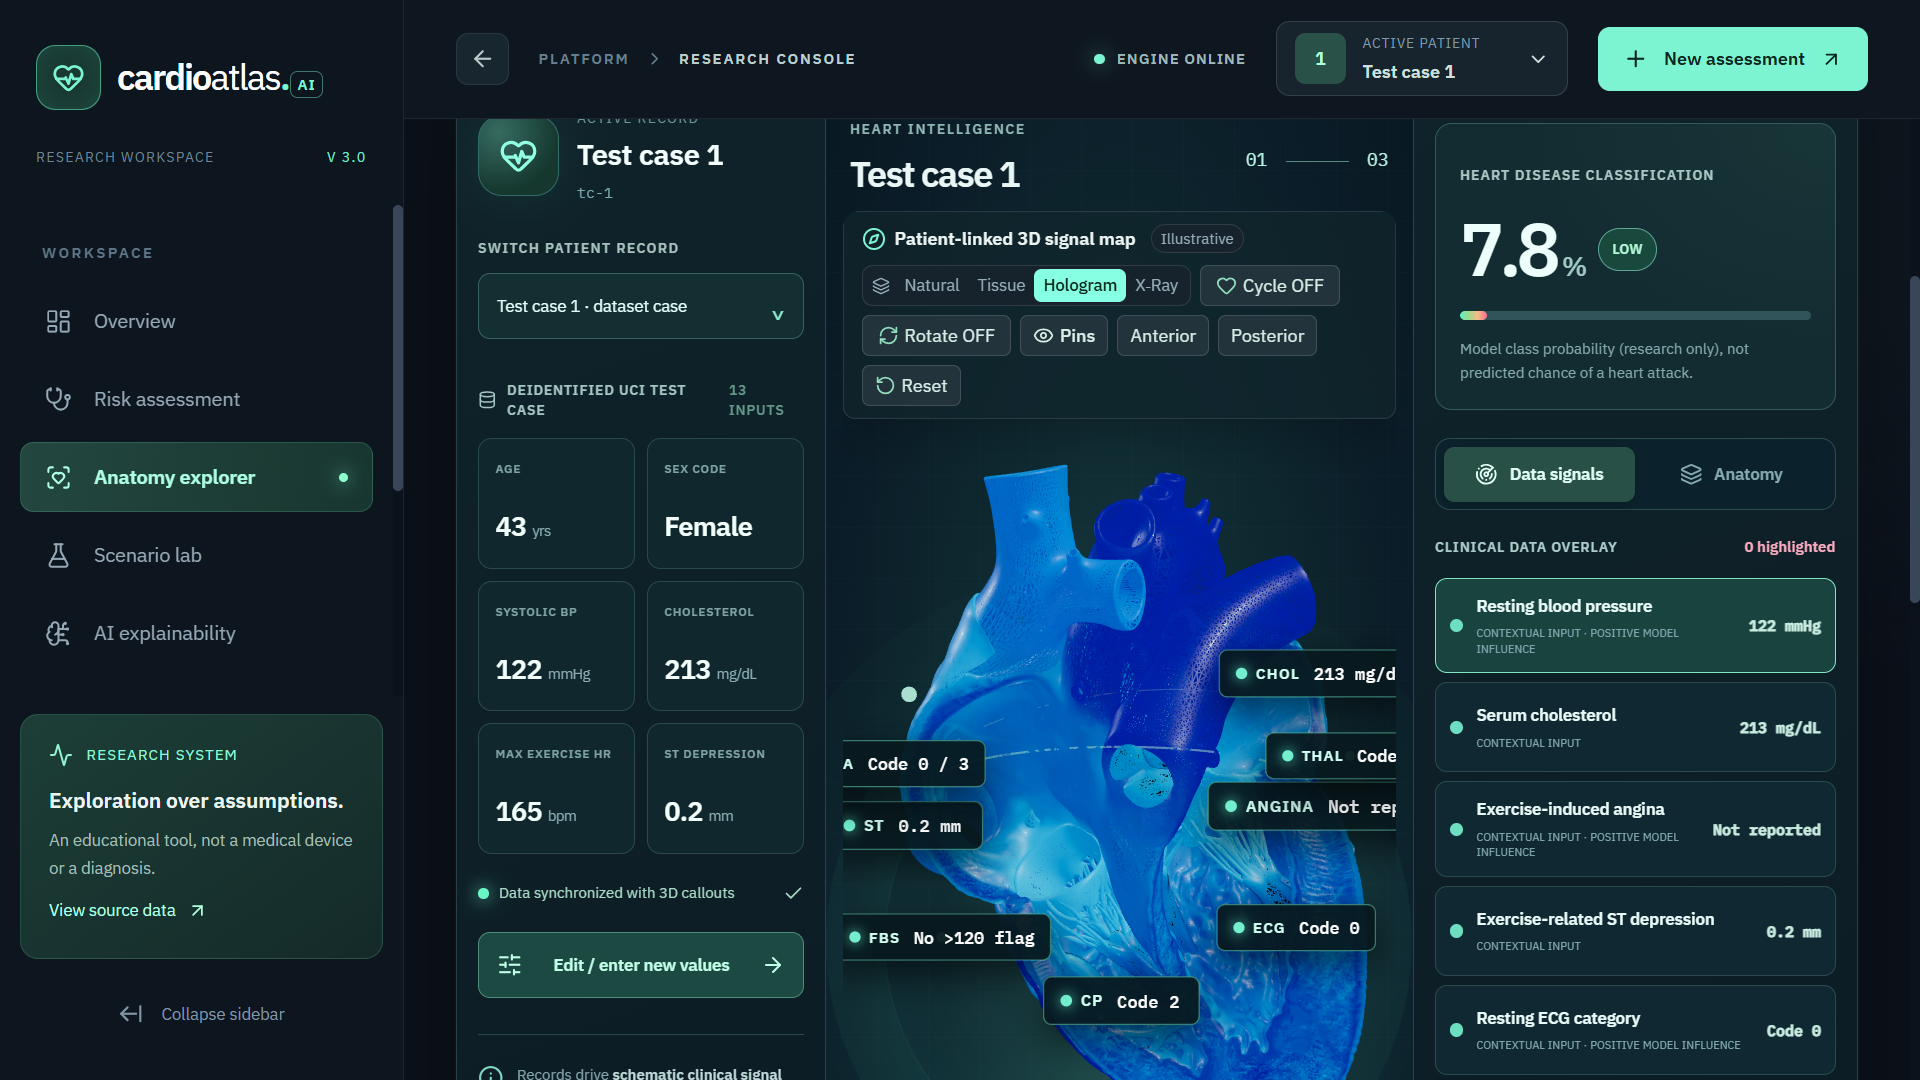
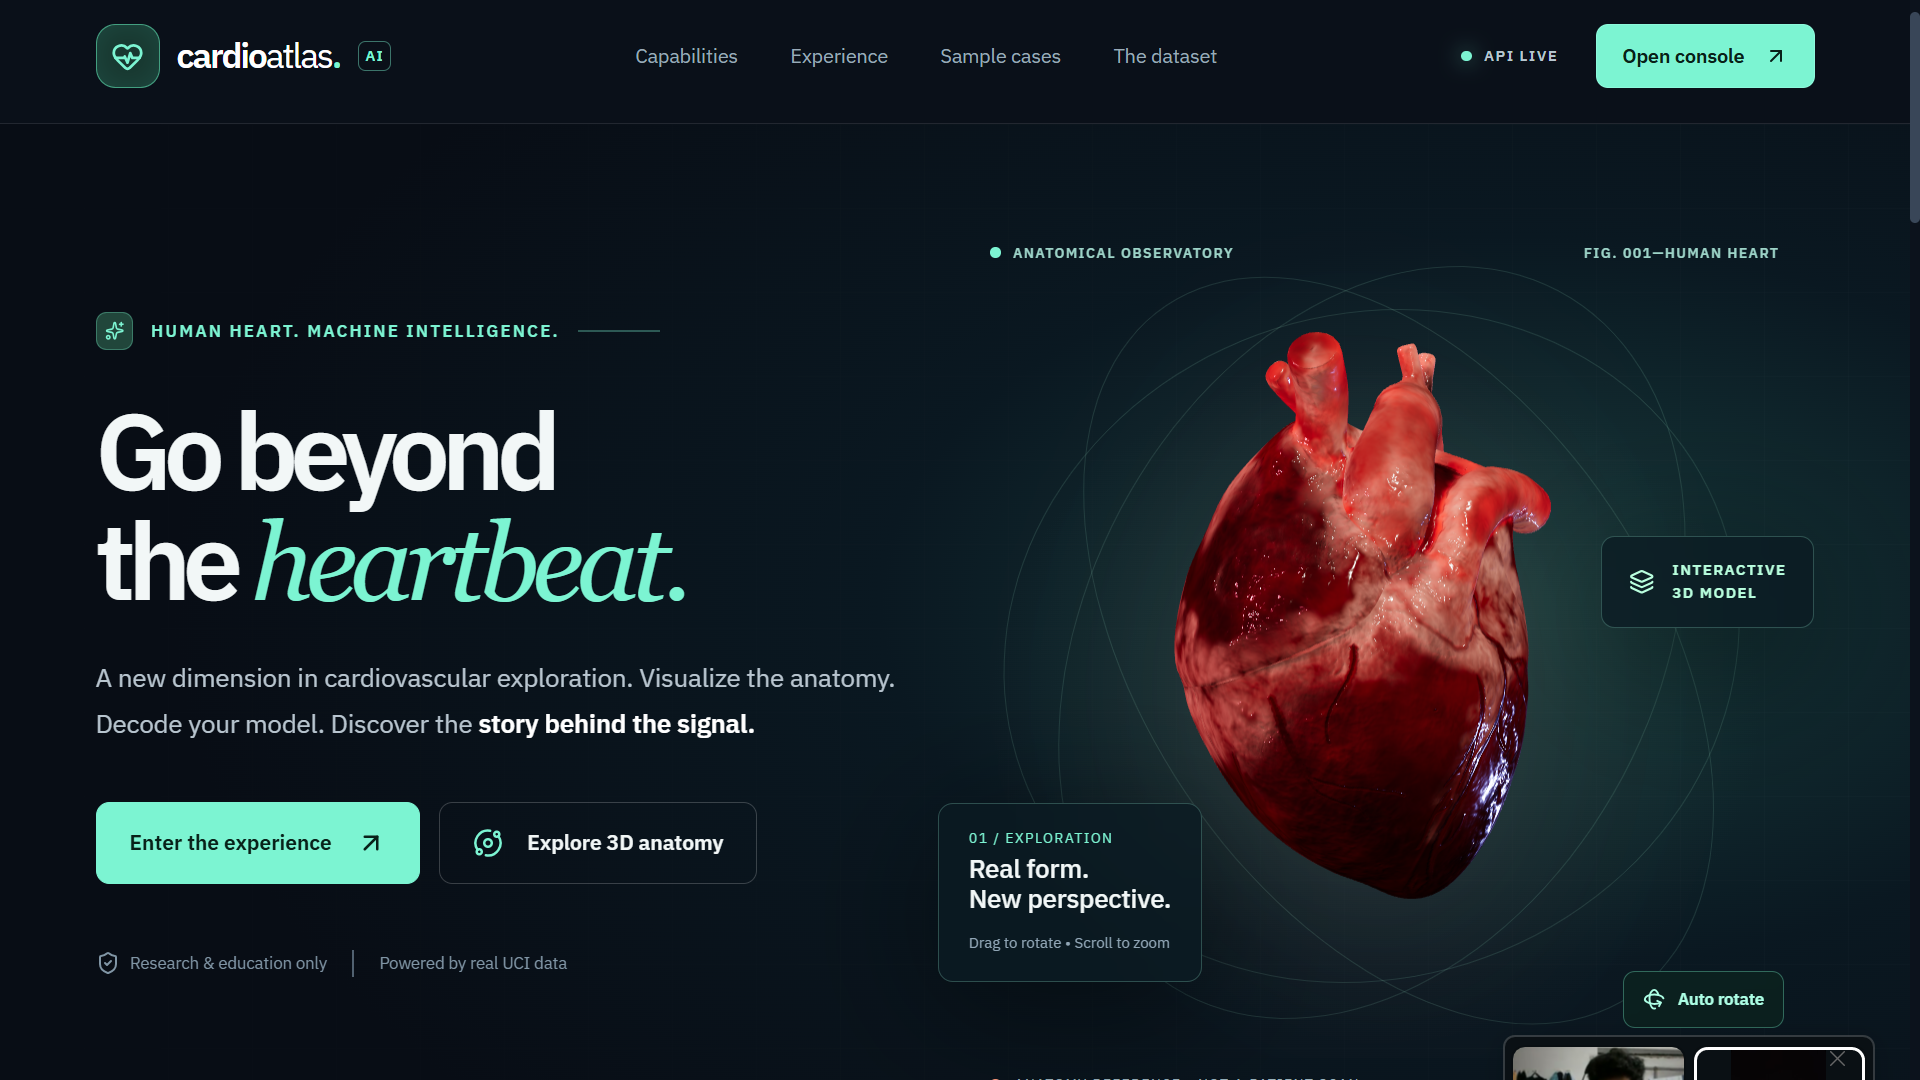
- Interactive 3D Heart: Users can rotate, zoom, explore transparent views, and study heart anatomy.
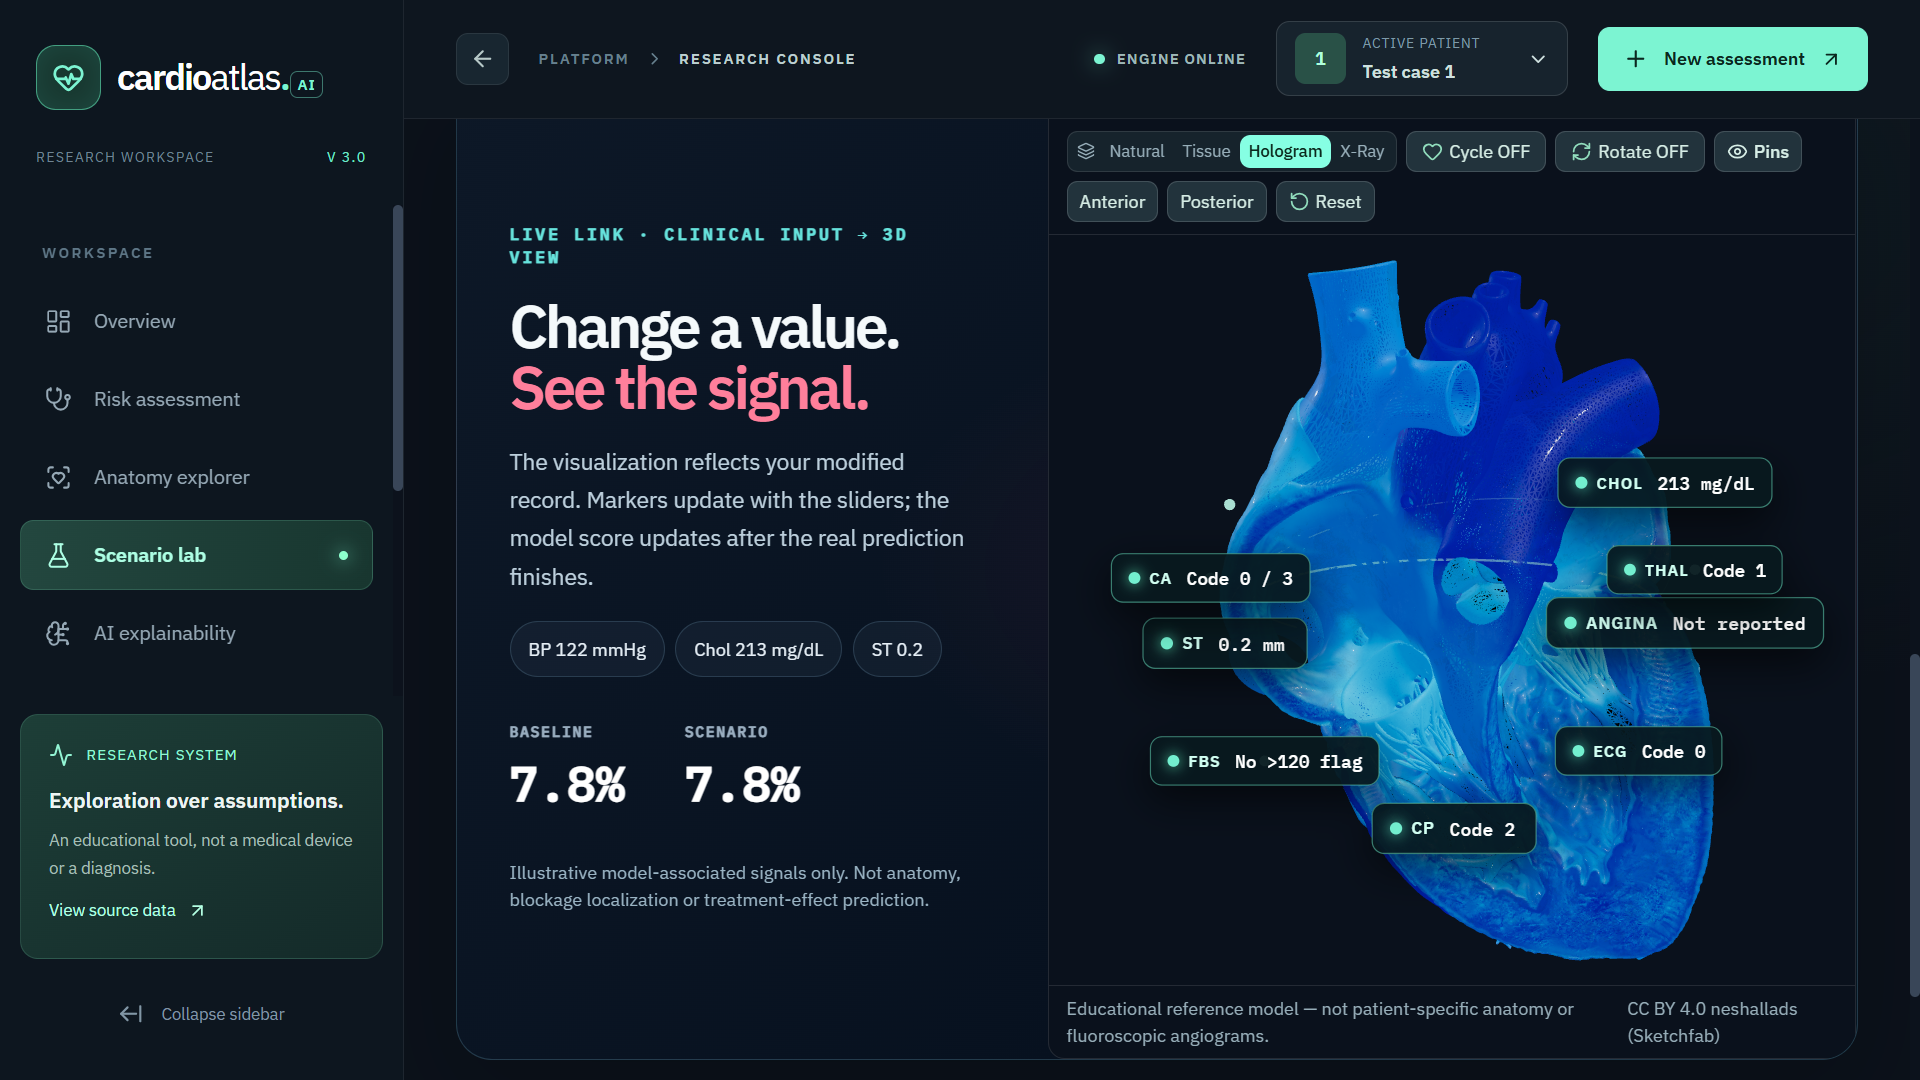
- Patient-Linked Visualization: Illustrative indicators connect clinical information with the 3D heart.
- What-If Analysis: Users can modify clinical values and observe how the model's output changes.
- Dataset Library: Users can explore and download the dataset used in the project.
The application is designed for research and education, not medical diagnosis.
How we built it
We started with the UCI Cleveland Heart Disease dataset, containing 303 patient records and 13 input features.
For the machine-learning system, we used Python and scikit-learn to build an ensemble using Random Forest, Gradient Boosting, and Logistic Regression.
We developed the backend using FastAPI to handle predictions, explanations, and what-if simulations.
For the frontend, we used React, TypeScript, and Tailwind CSS. We integrated interactive 3D heart models using Three.js-based visualization tools.
We connected the frontend and backend through REST APIs so that users could enter patient information and receive model-generated results.
Finally, we used Docker and Render to deploy the complete application online, with GitHub for version control.
Challenges we ran into
One of our biggest challenges was connecting machine-learning predictions with a meaningful 3D heart visualization.
Creating a rotating 3D model was one thing, but making it respond to patient information was much more challenging. We had to connect clinical data, prediction outputs, and visual indicators while avoiding misleading anatomical claims.
Another challenge was working with a small medical dataset. We needed to evaluate the model carefully and understand that good test results do not automatically mean clinical reliability.
We also faced several technical issues during deployment, especially CSS build errors, dependency compatibility, and connecting the frontend and backend on Render.
Fixing these problems took debugging, repeated testing, and a lot of trial and error.
Accomplishments that we're proud of
Our biggest accomplishment is turning an initial idea into a working, publicly deployed application.
We are especially proud of:
- Building a full-stack platform that combines machine learning and interactive 3D visualization.
- Training and integrating three machine-learning algorithms into one prediction system.
- Achieving approximately 82.6% accuracy in five-fold cross-validation on the Cleveland dataset.
- Adding explainability so users can explore the factors influencing a prediction.
- Developing interactive what-if analysis and patient-linked educational visual indicators.
- Successfully deploying the project and connecting our AI backend to a live website.
Seeing the prediction API return results from our deployed application was one of the most satisfying moments of the project.
Live Project: https://cardio-atlas-ai.onrender.com
What we learned
This project taught us much more than just training a machine-learning model.
We learned how to connect different technologies, build REST APIs, work with 3D models, debug deployment problems, and turn technical concepts into a usable interface.
We also gained a better understanding of explainable AI and why transparency matters when developing healthcare-related applications.
Most importantly, we learned that developing responsible AI involves recognizing limitations rather than focusing only on accuracy scores.
We also gained experience collaborating, solving unexpected problems, and improving a project through multiple iterations.
What's next for Cardio Atlas AI – Explainable Heart Health Visualization
We see Cardio Atlas AI as a starting point rather than a finished product.
Our next goals are to:
- Improve model reliability: Evaluate the model on independent cardiovascular datasets and study calibration and uncertainty.
- Enhance 3D visualization: Make the connection between clinical inputs, model explanations, and anatomical education more interactive.
- Explore medical imaging: Investigate how real CT or MRI data could eventually support patient-specific anatomical visualization.
- Improve the user experience: Add more detailed explanations, downloadable reports, and better patient-record management.
- Expand accessibility: Make the platform easier to understand and use across different devices.
Our long-term goal is to make cardiovascular AI more understandable, transparent, and accessible.
We know that our current prototype cannot replace professional medical evaluation, but we believe it demonstrates how AI and visualization can work together to make complex information easier to explore.
Built With
- chatgpt
- docker
- fastapi
- github
- gradient-boosting
- logistic-regression
- numpy
- nvidia-nemotron
- pandas
- python
- random-forest
- react
- render
- scikit-learn
- shap
- tailwind-css
- three.js
- typescript
- uci-heart-disease-dataset
- vite


Log in or sign up for Devpost to join the conversation.