



Inspiration Coronary artery disease is the world's leading cause of death. Yet the main way to confirm it is an invasive catheter angiogram, and many people who get one turn out to have normal arteries. Before that test, doctors already have a lot of routine information: risk factors, ECG and echo. Disease-risk models built on that data usually produce one bare number with no explanation. We wanted to make the prediction something you can see, explore and check, so we put it inside a beating heart and showed the evidence behind every number.
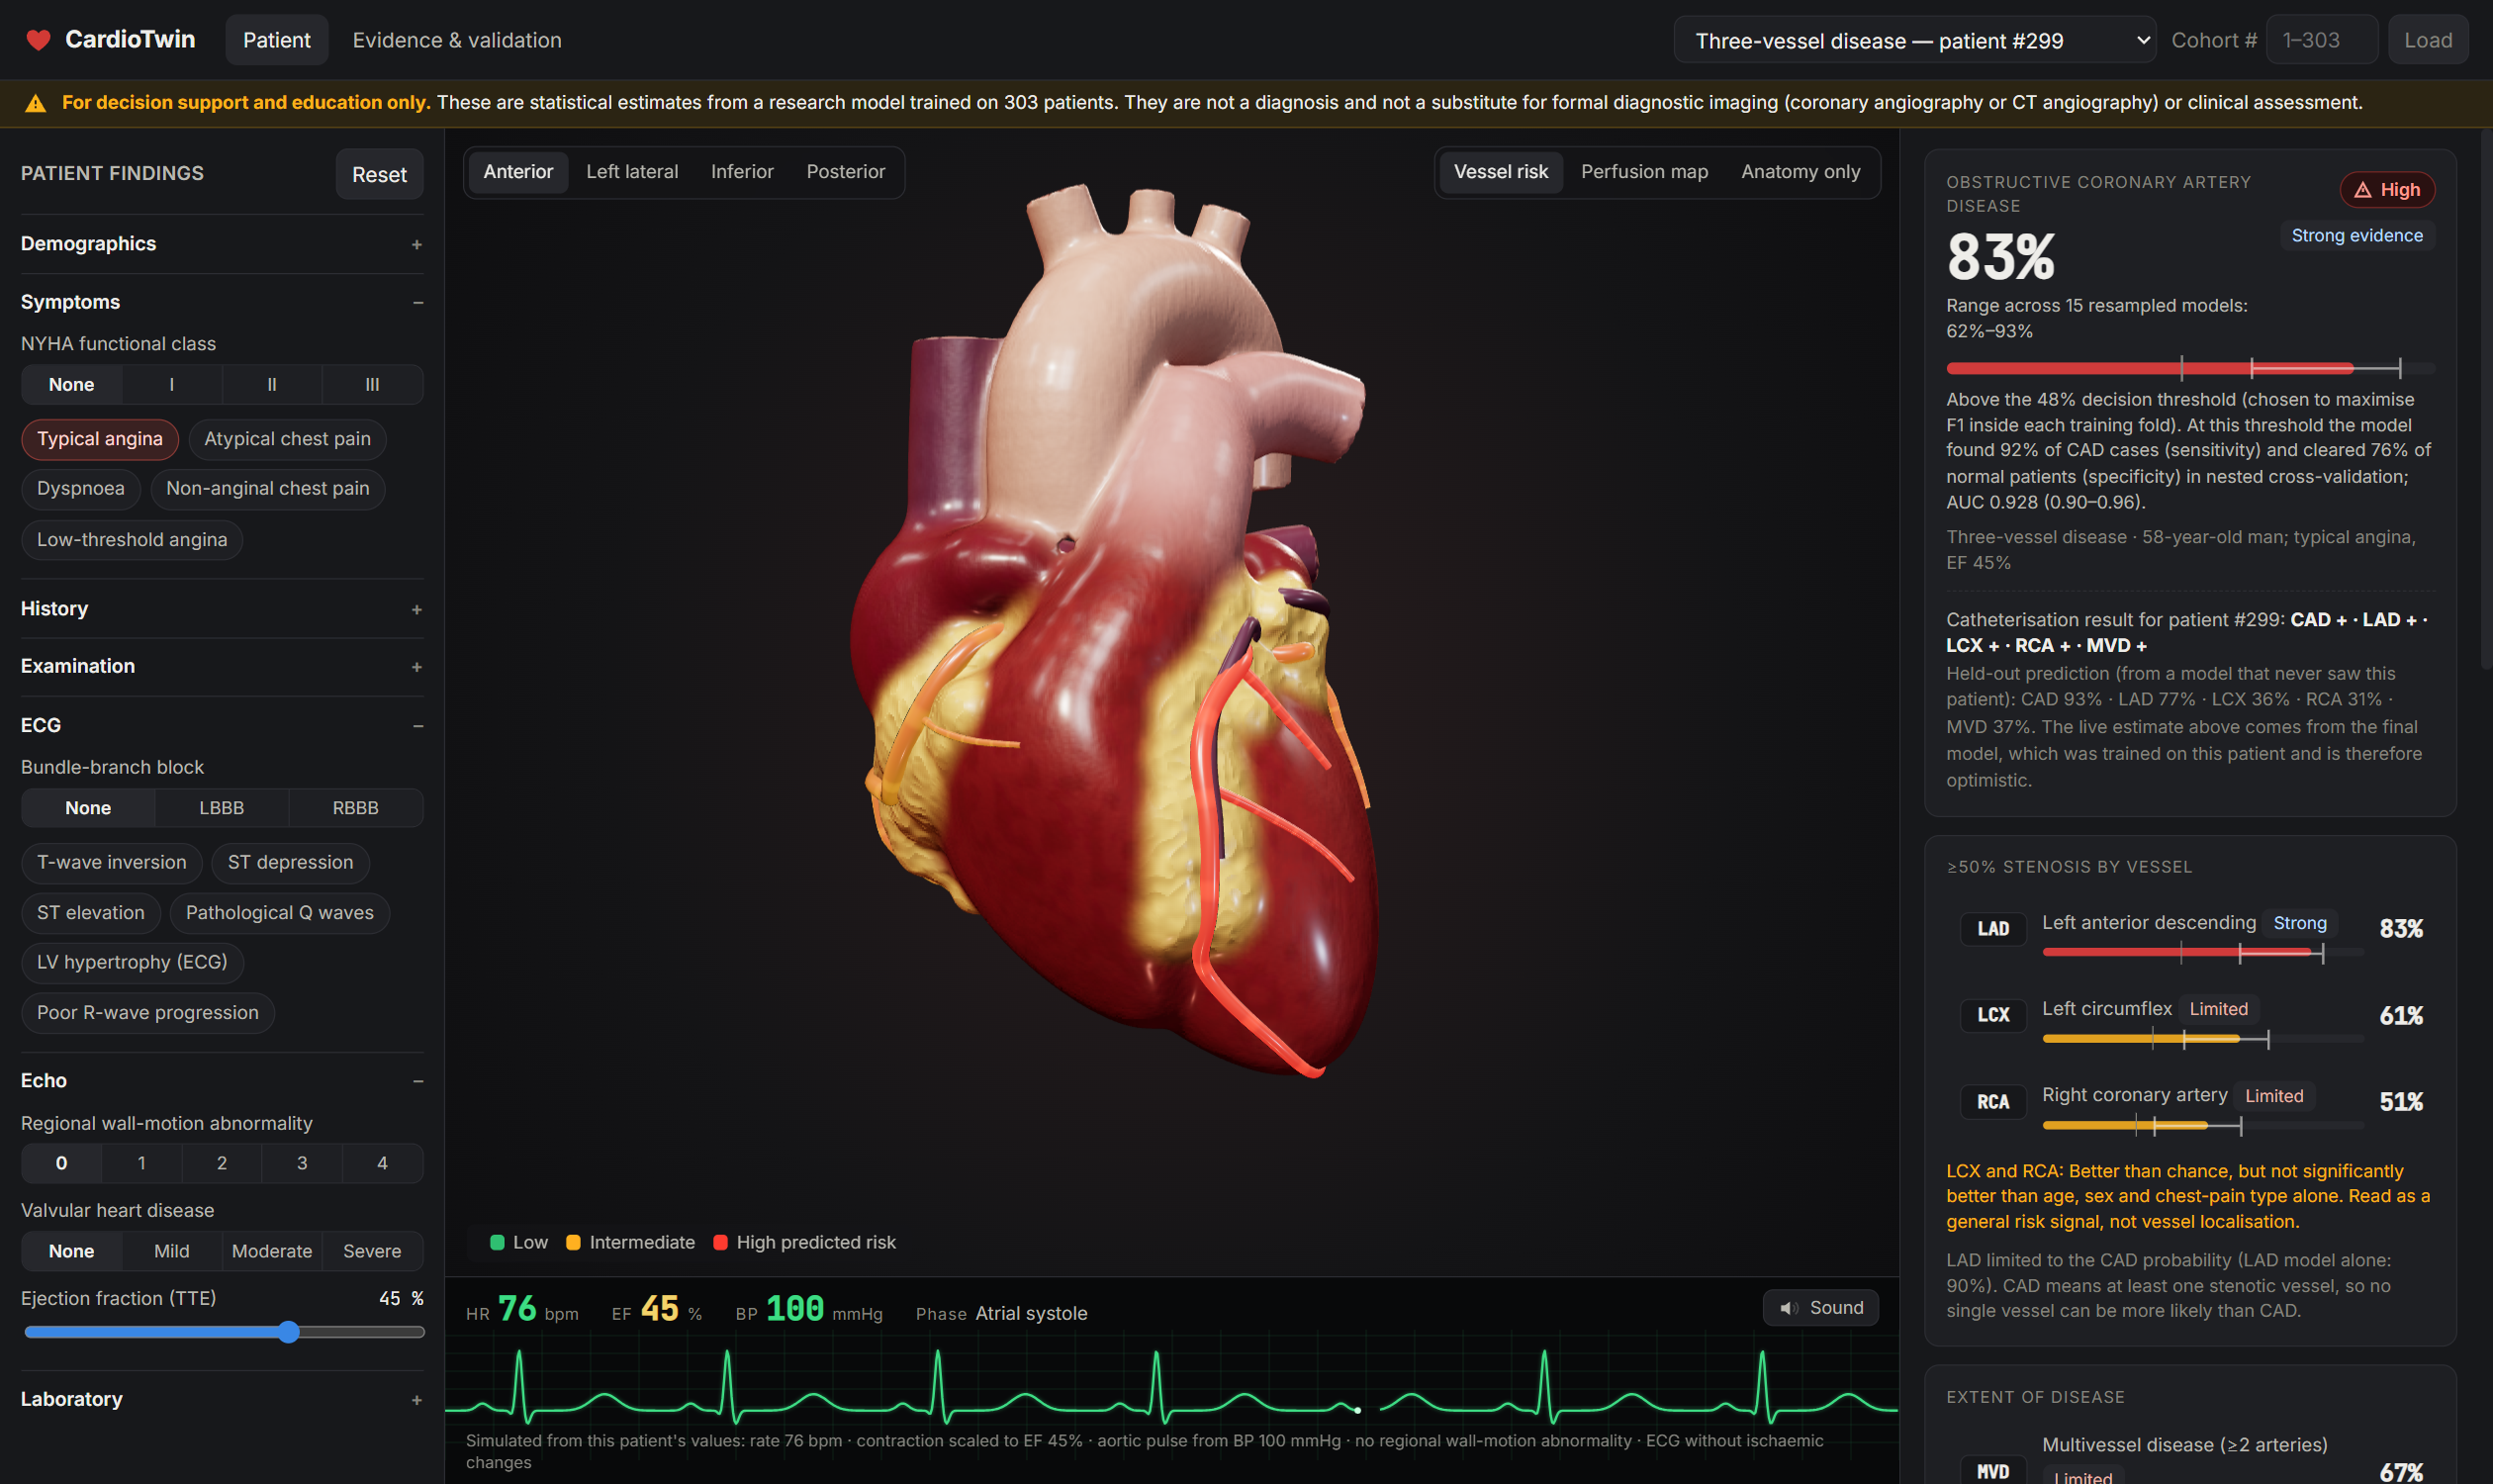
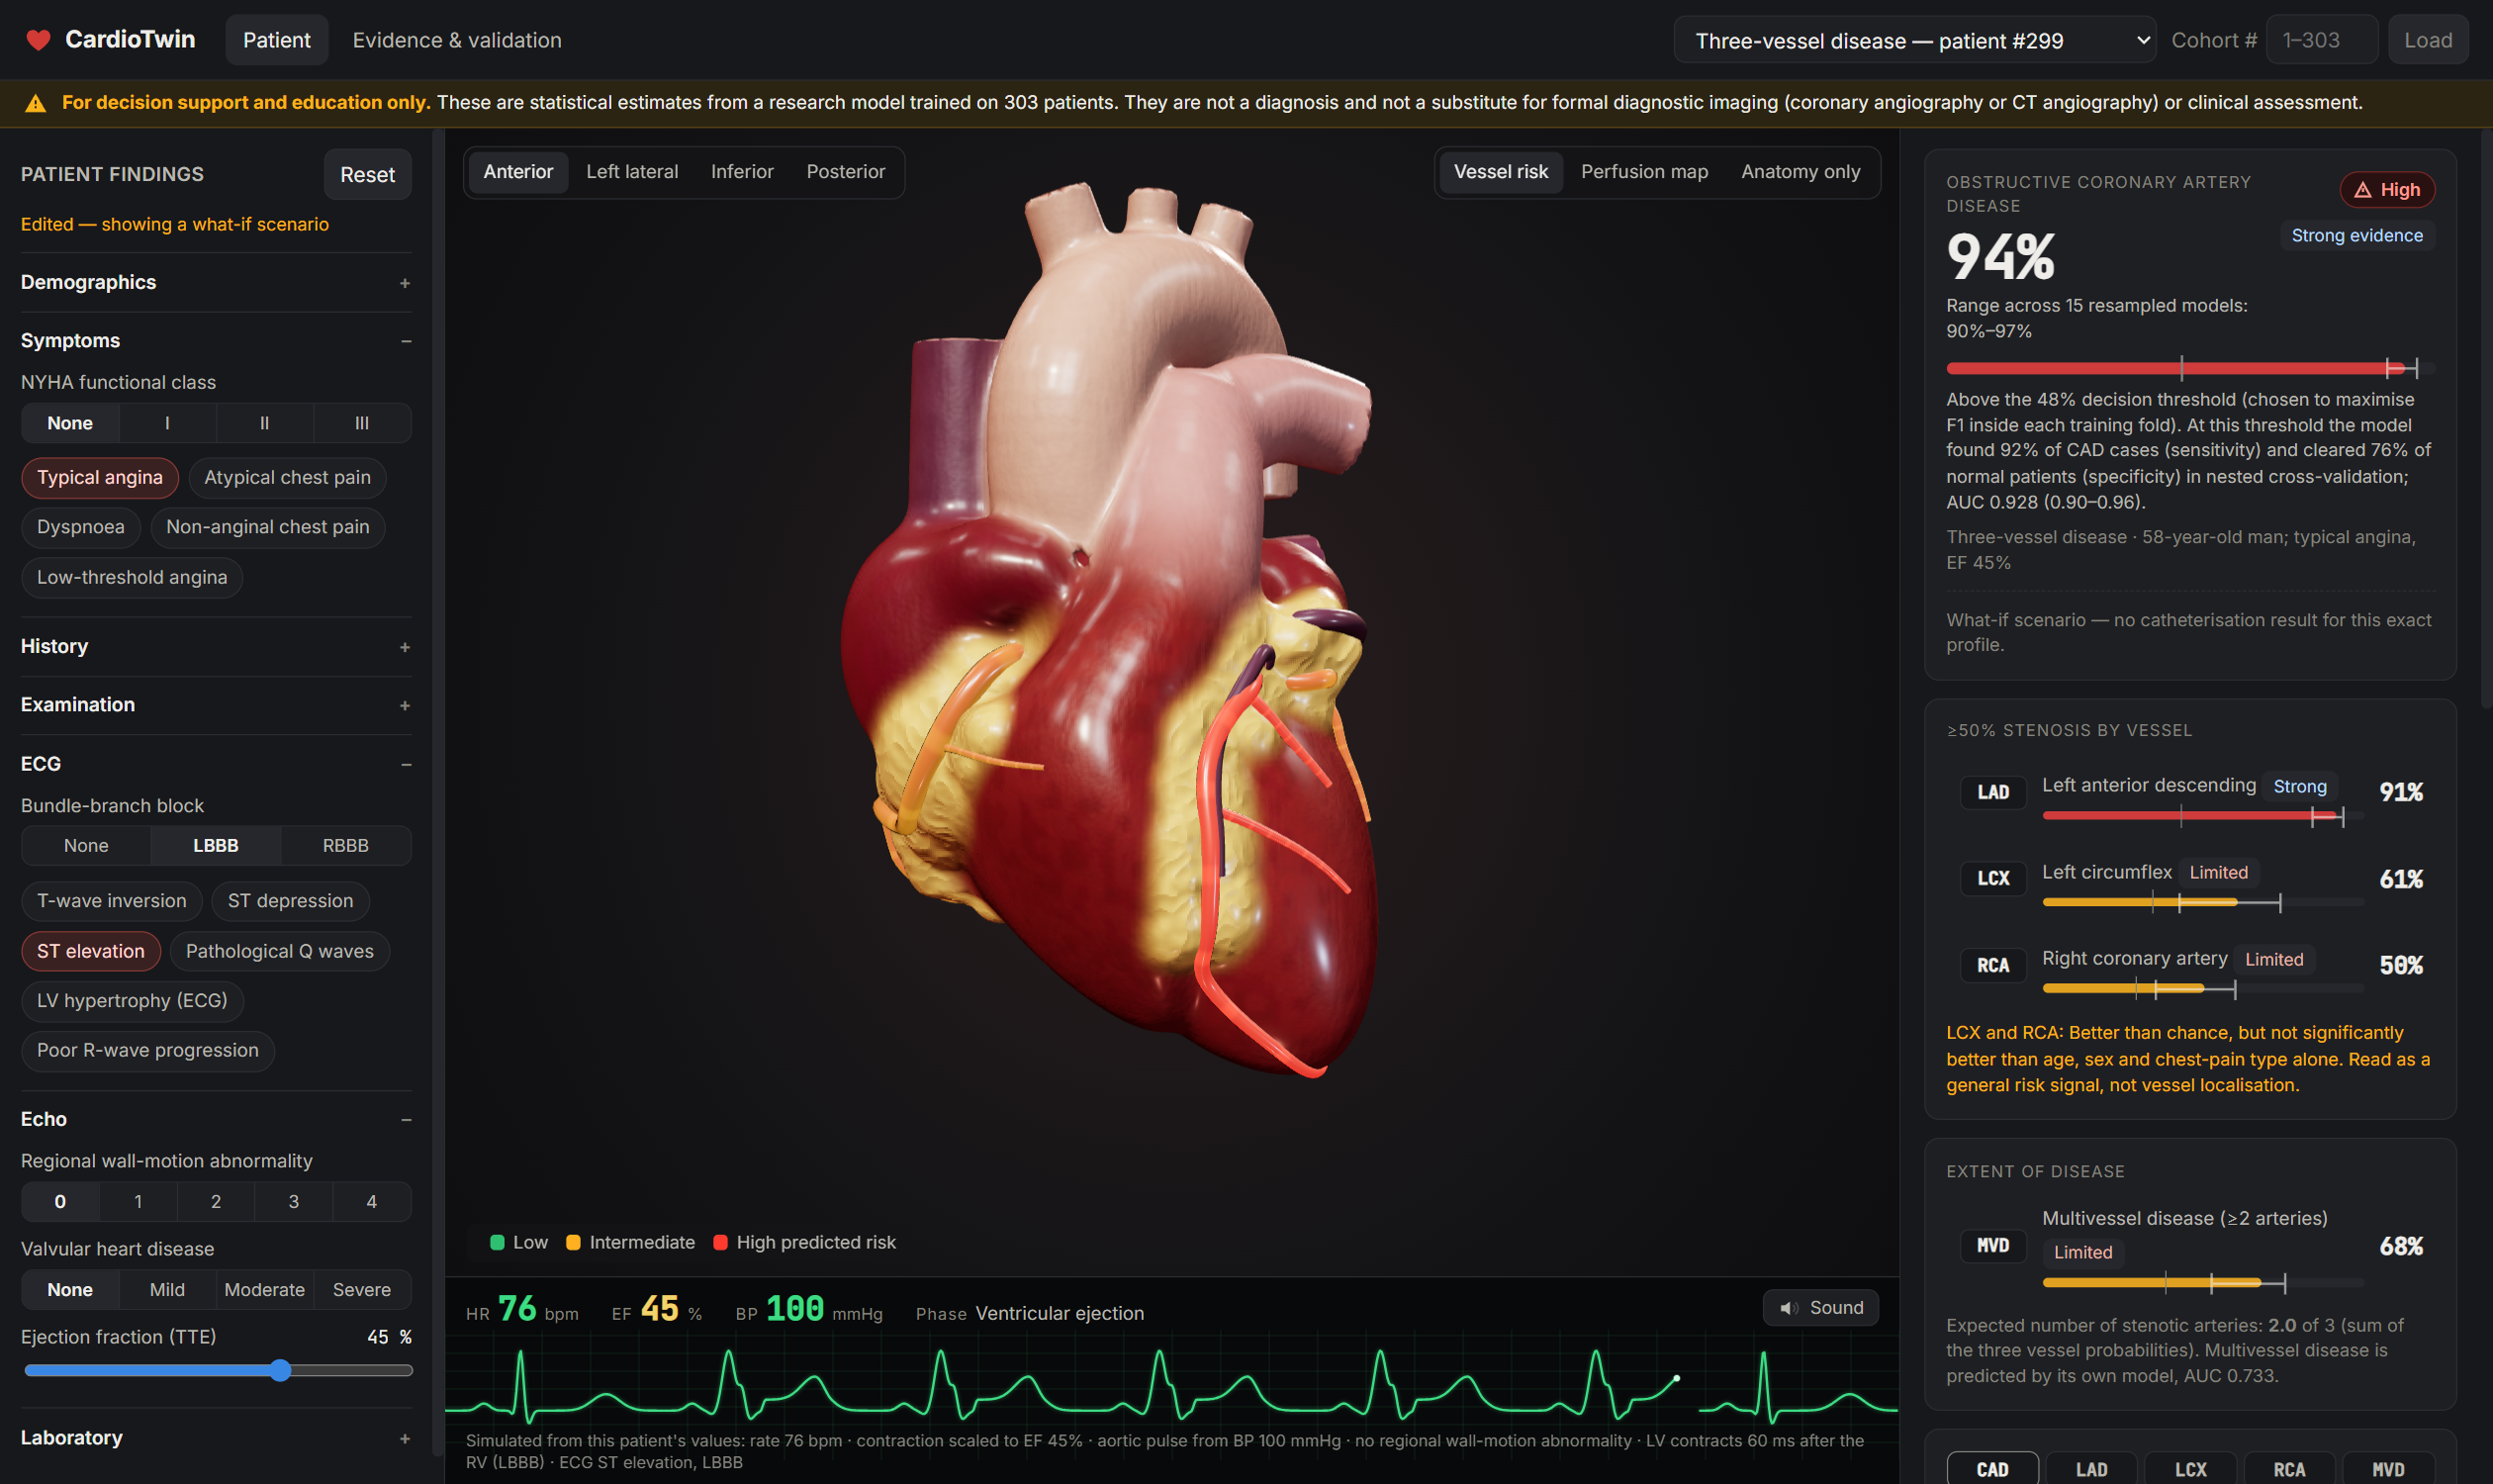
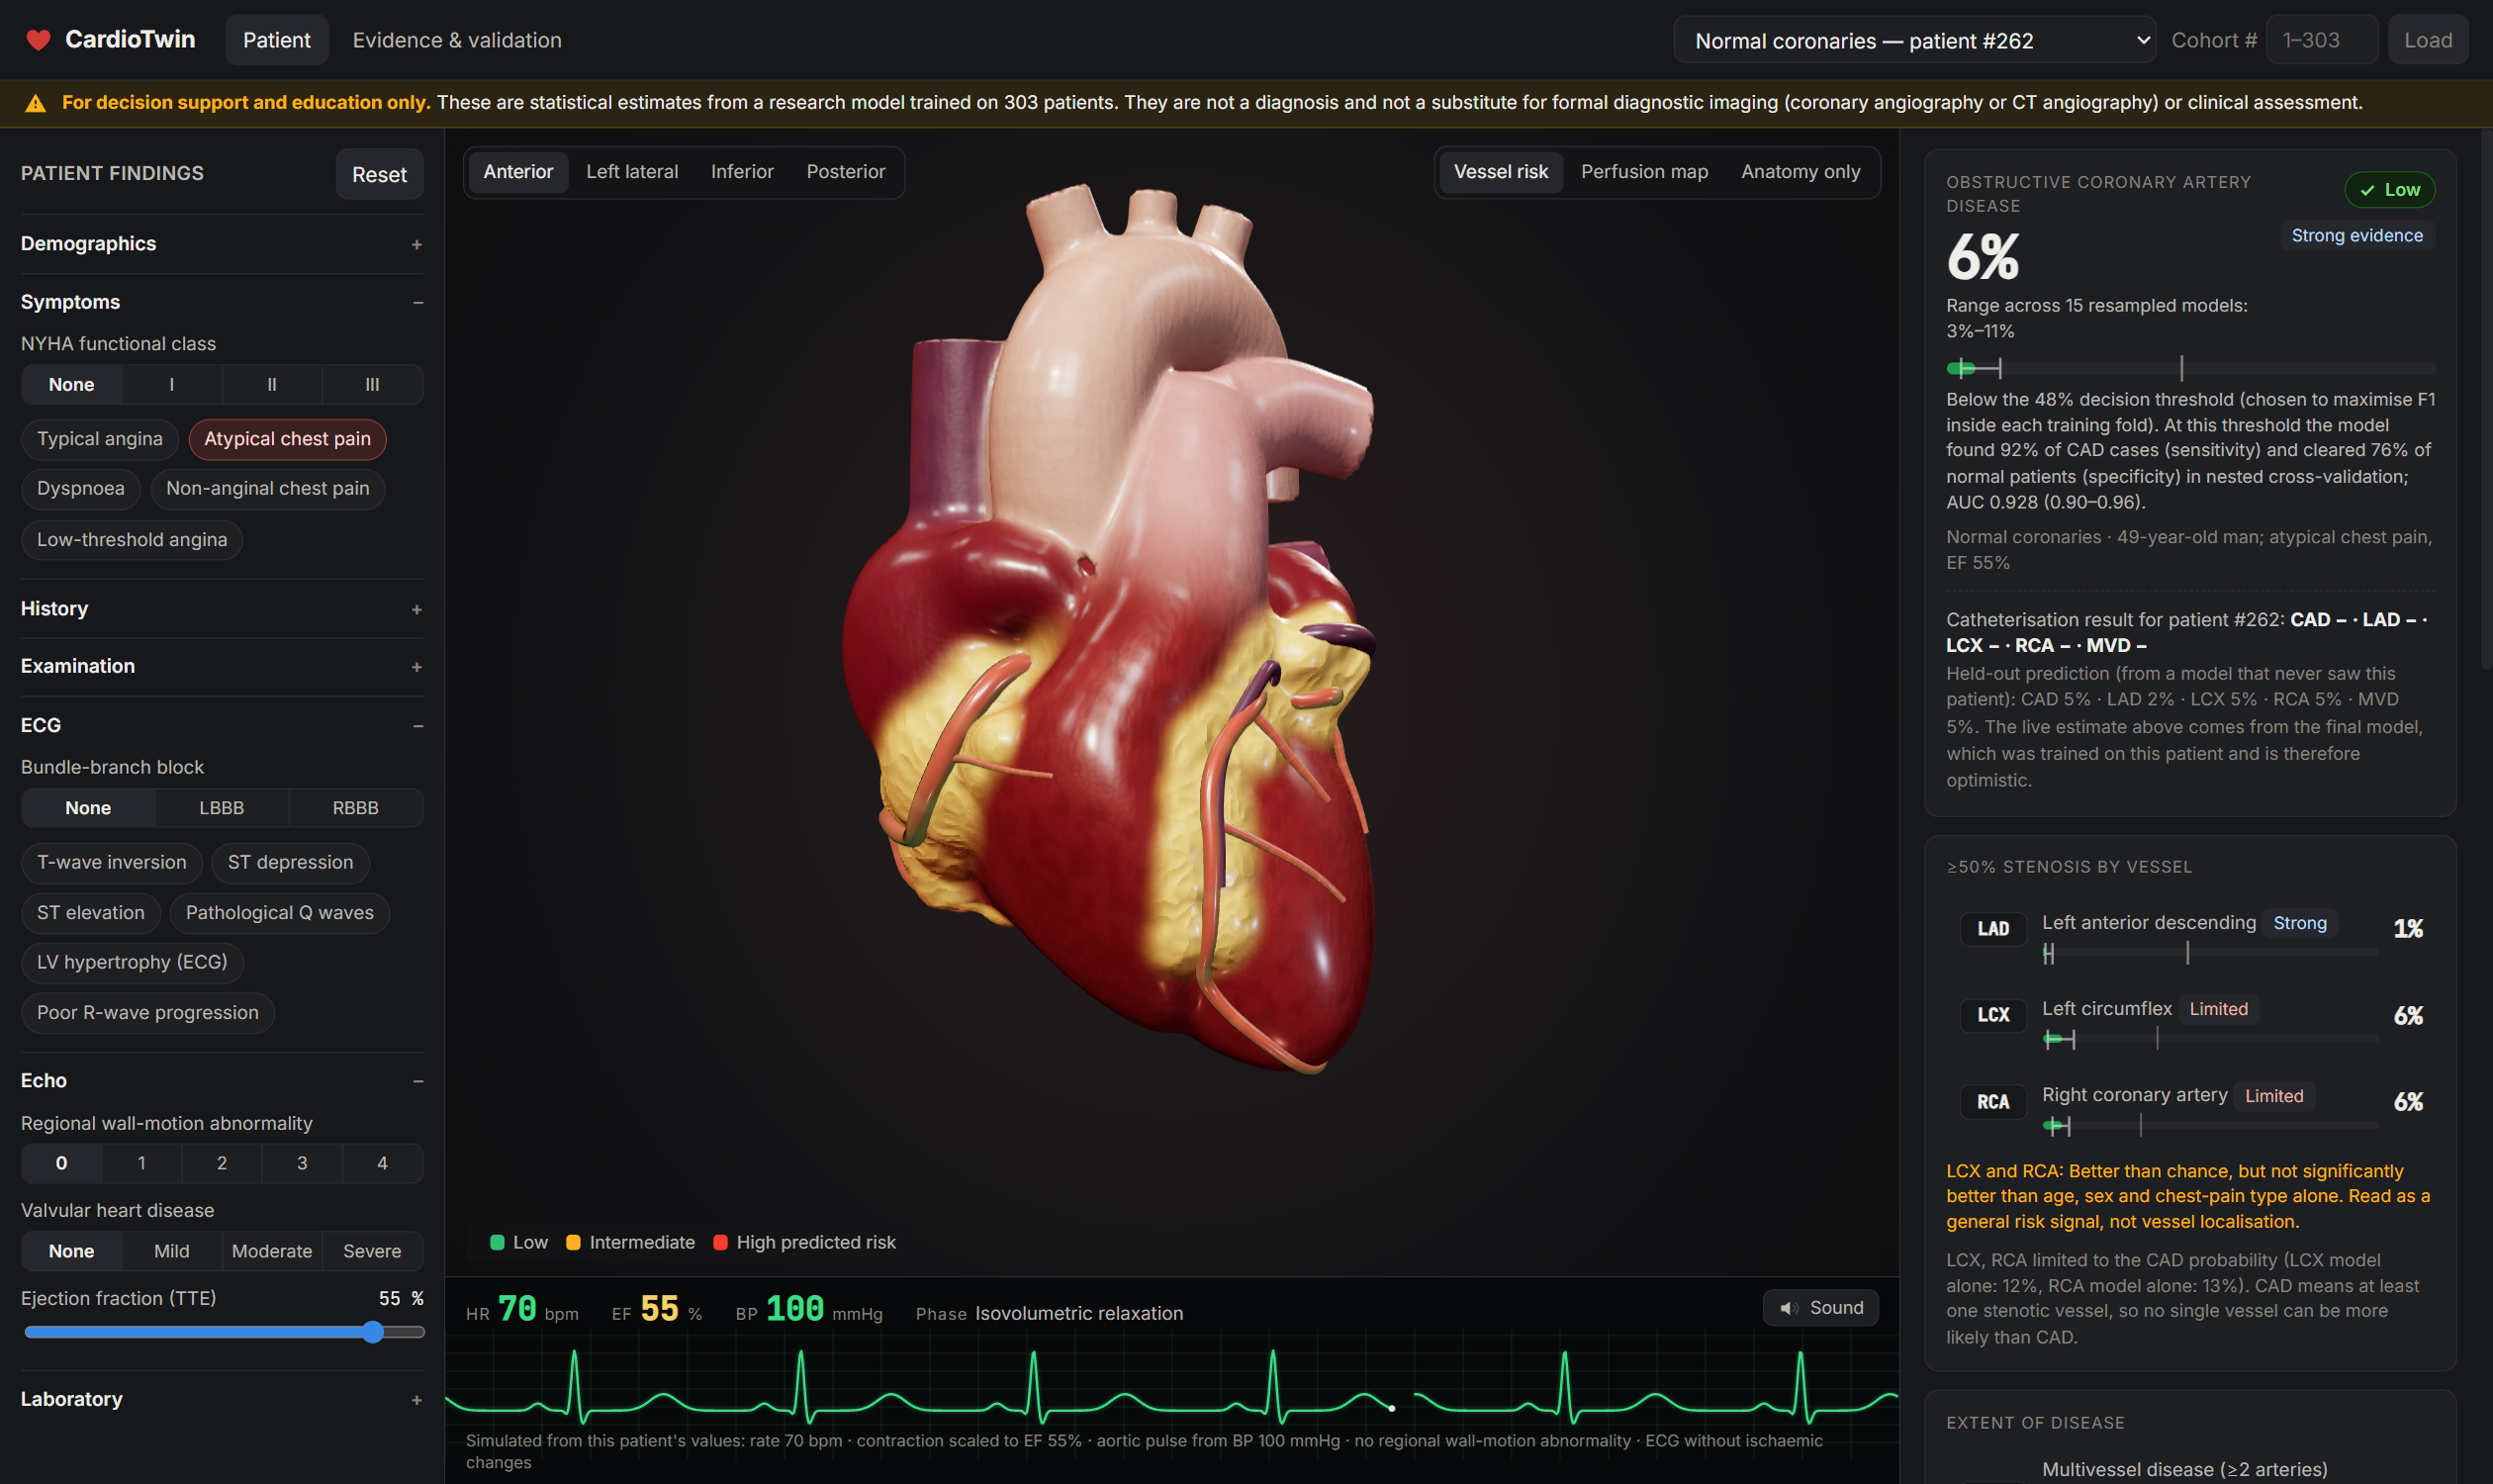
What it does CardioTwin turns a patient's routine non-invasive results into a beating 3D digital twin of their heart.
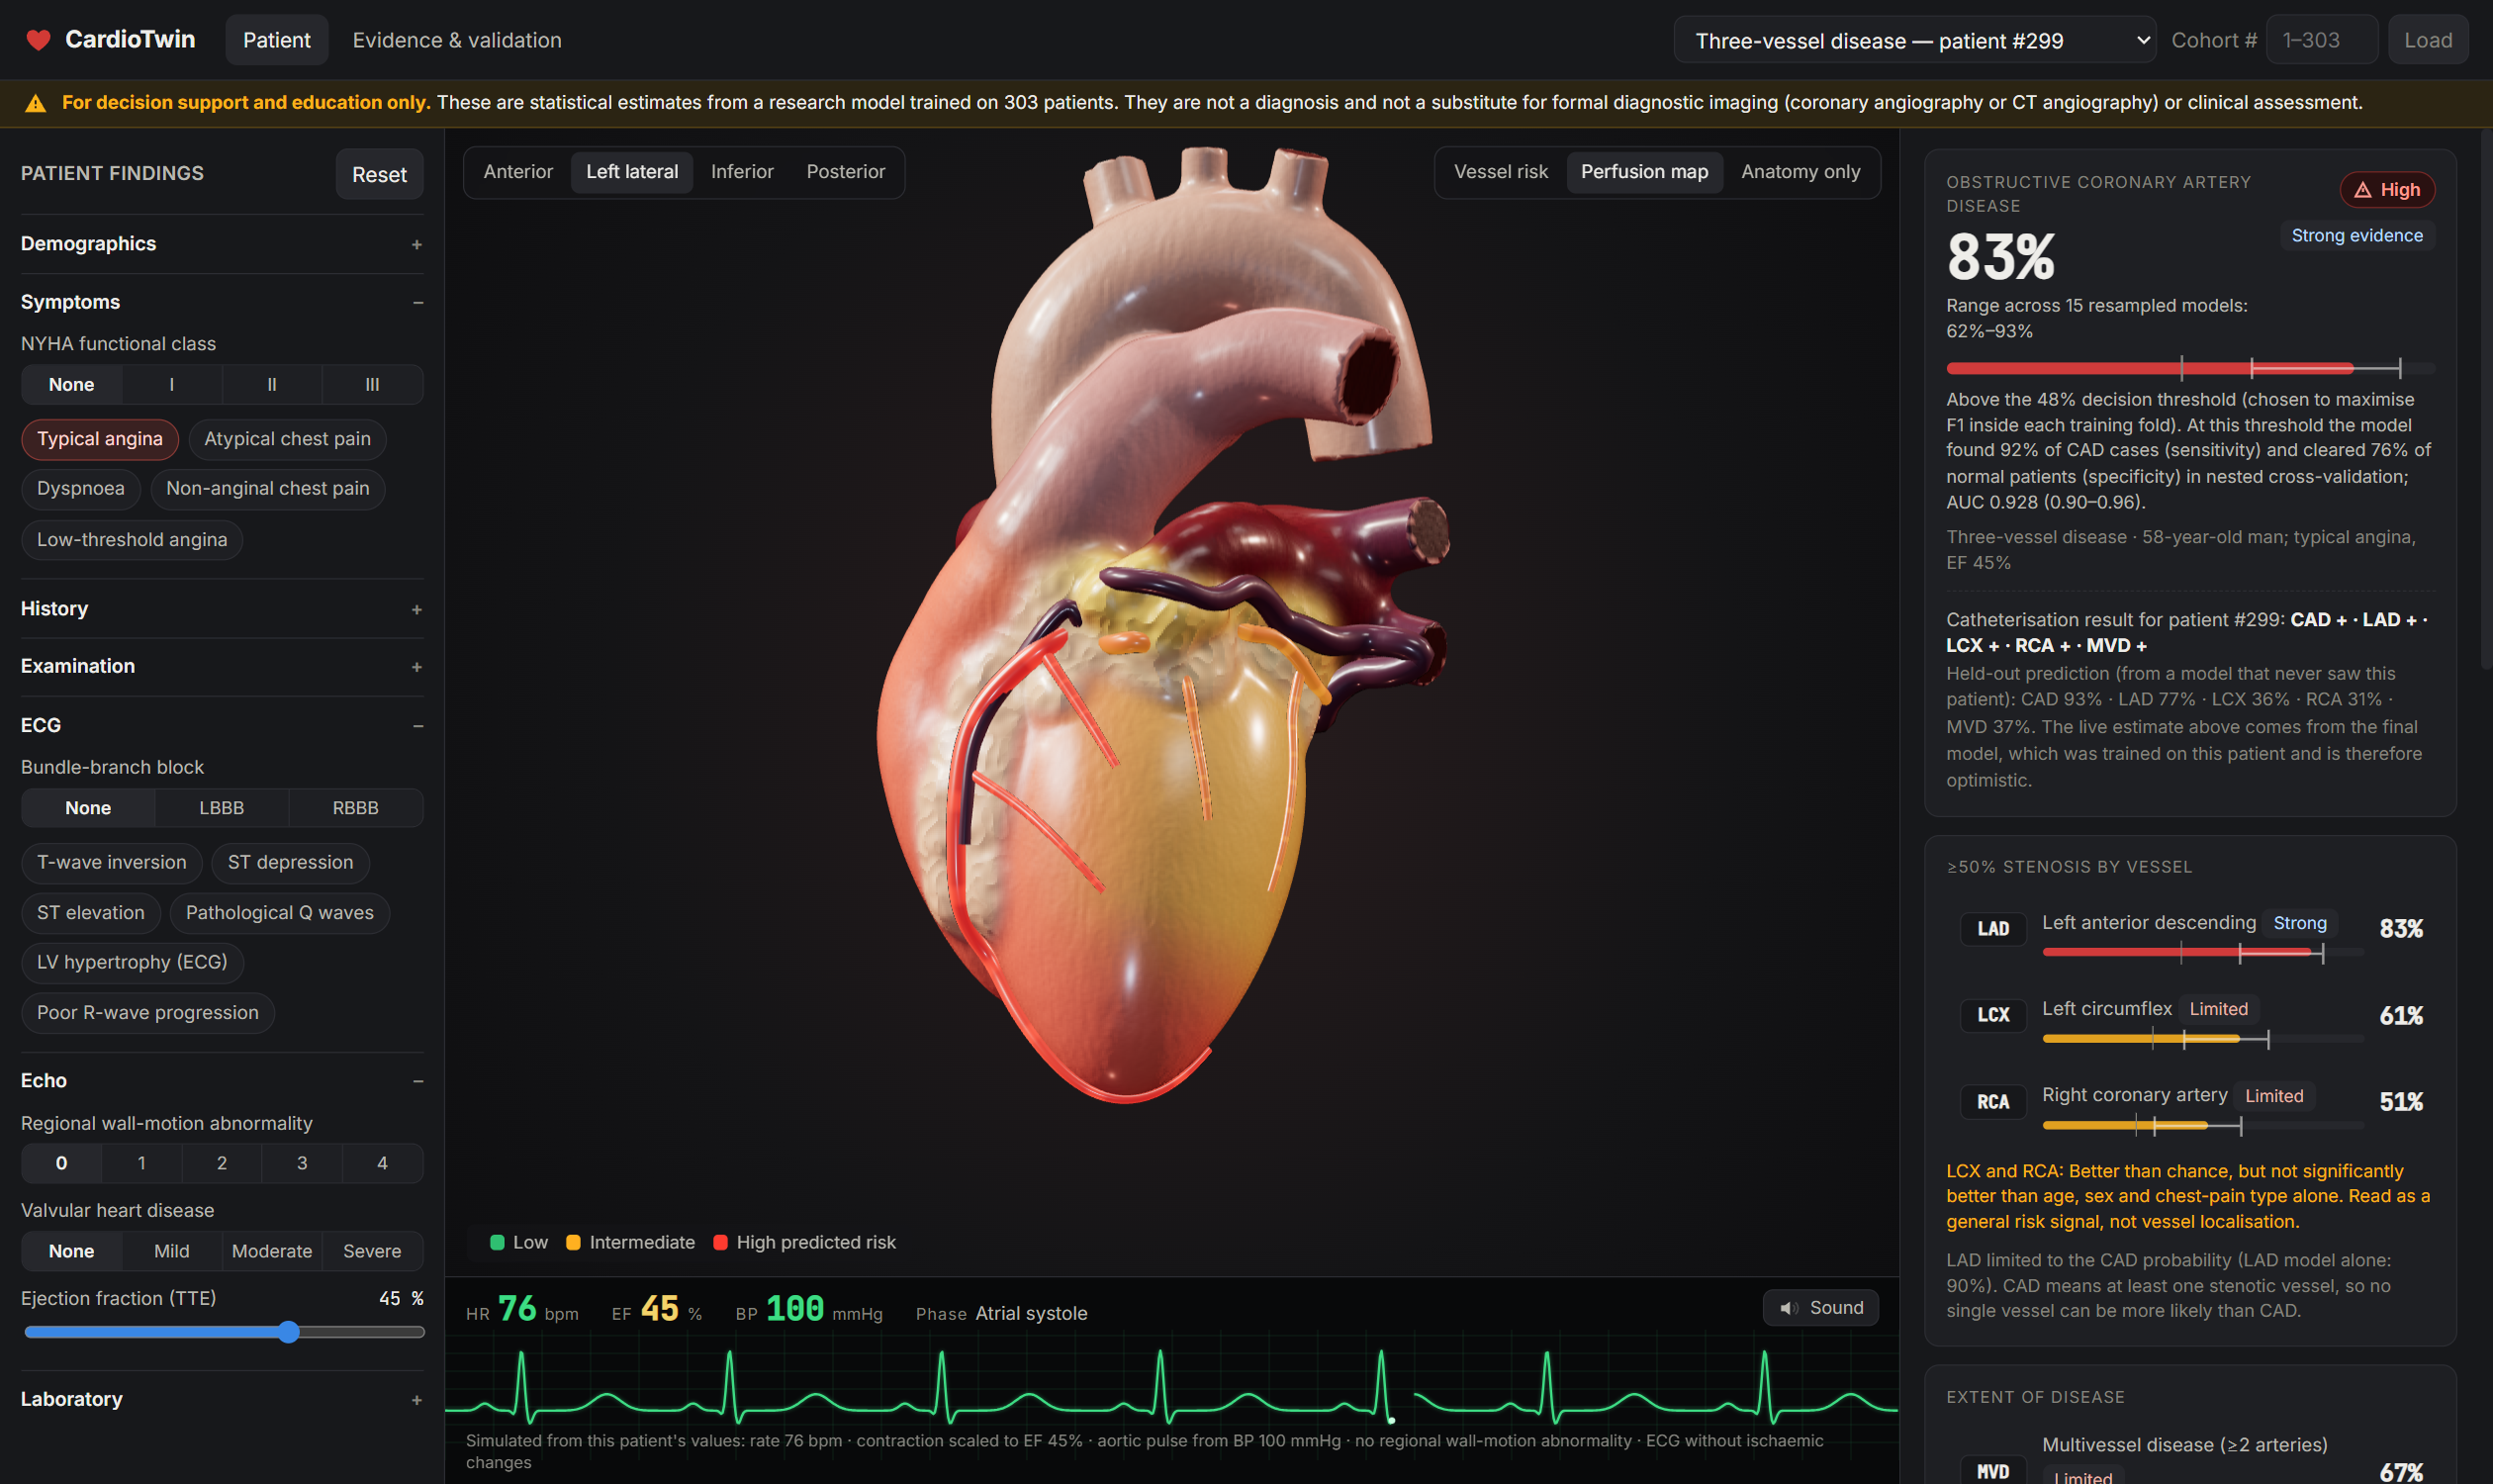
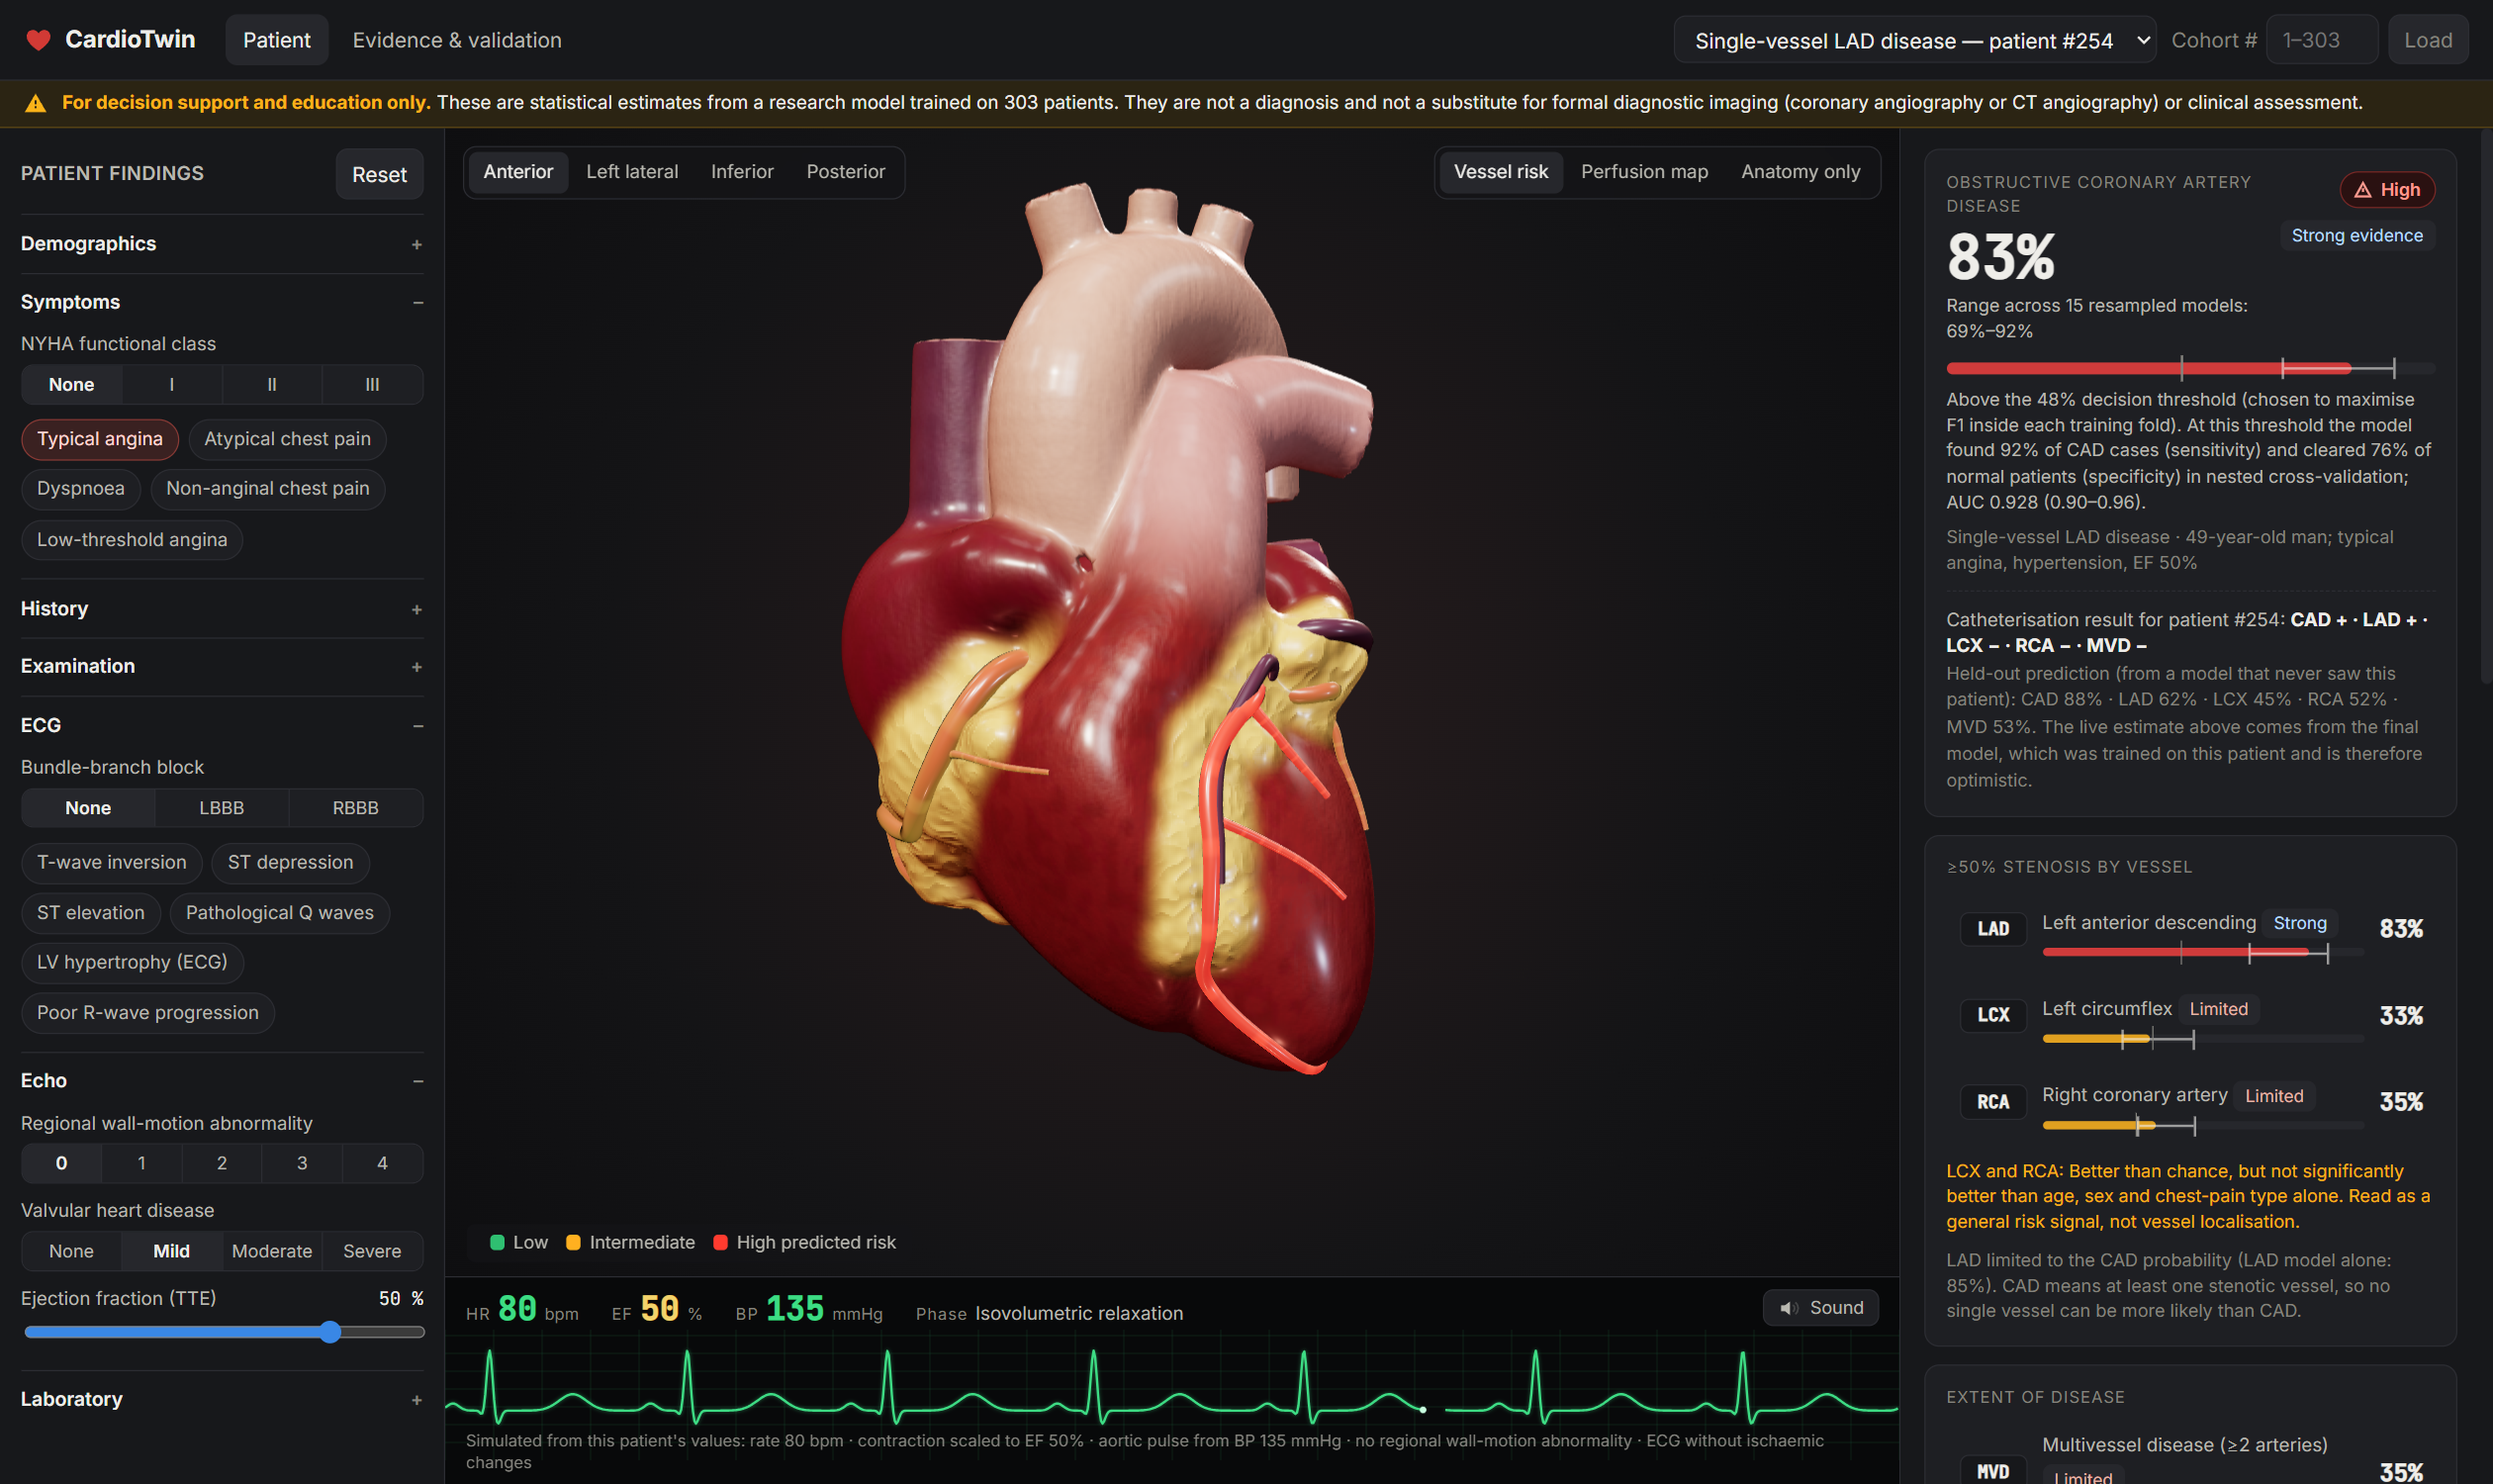
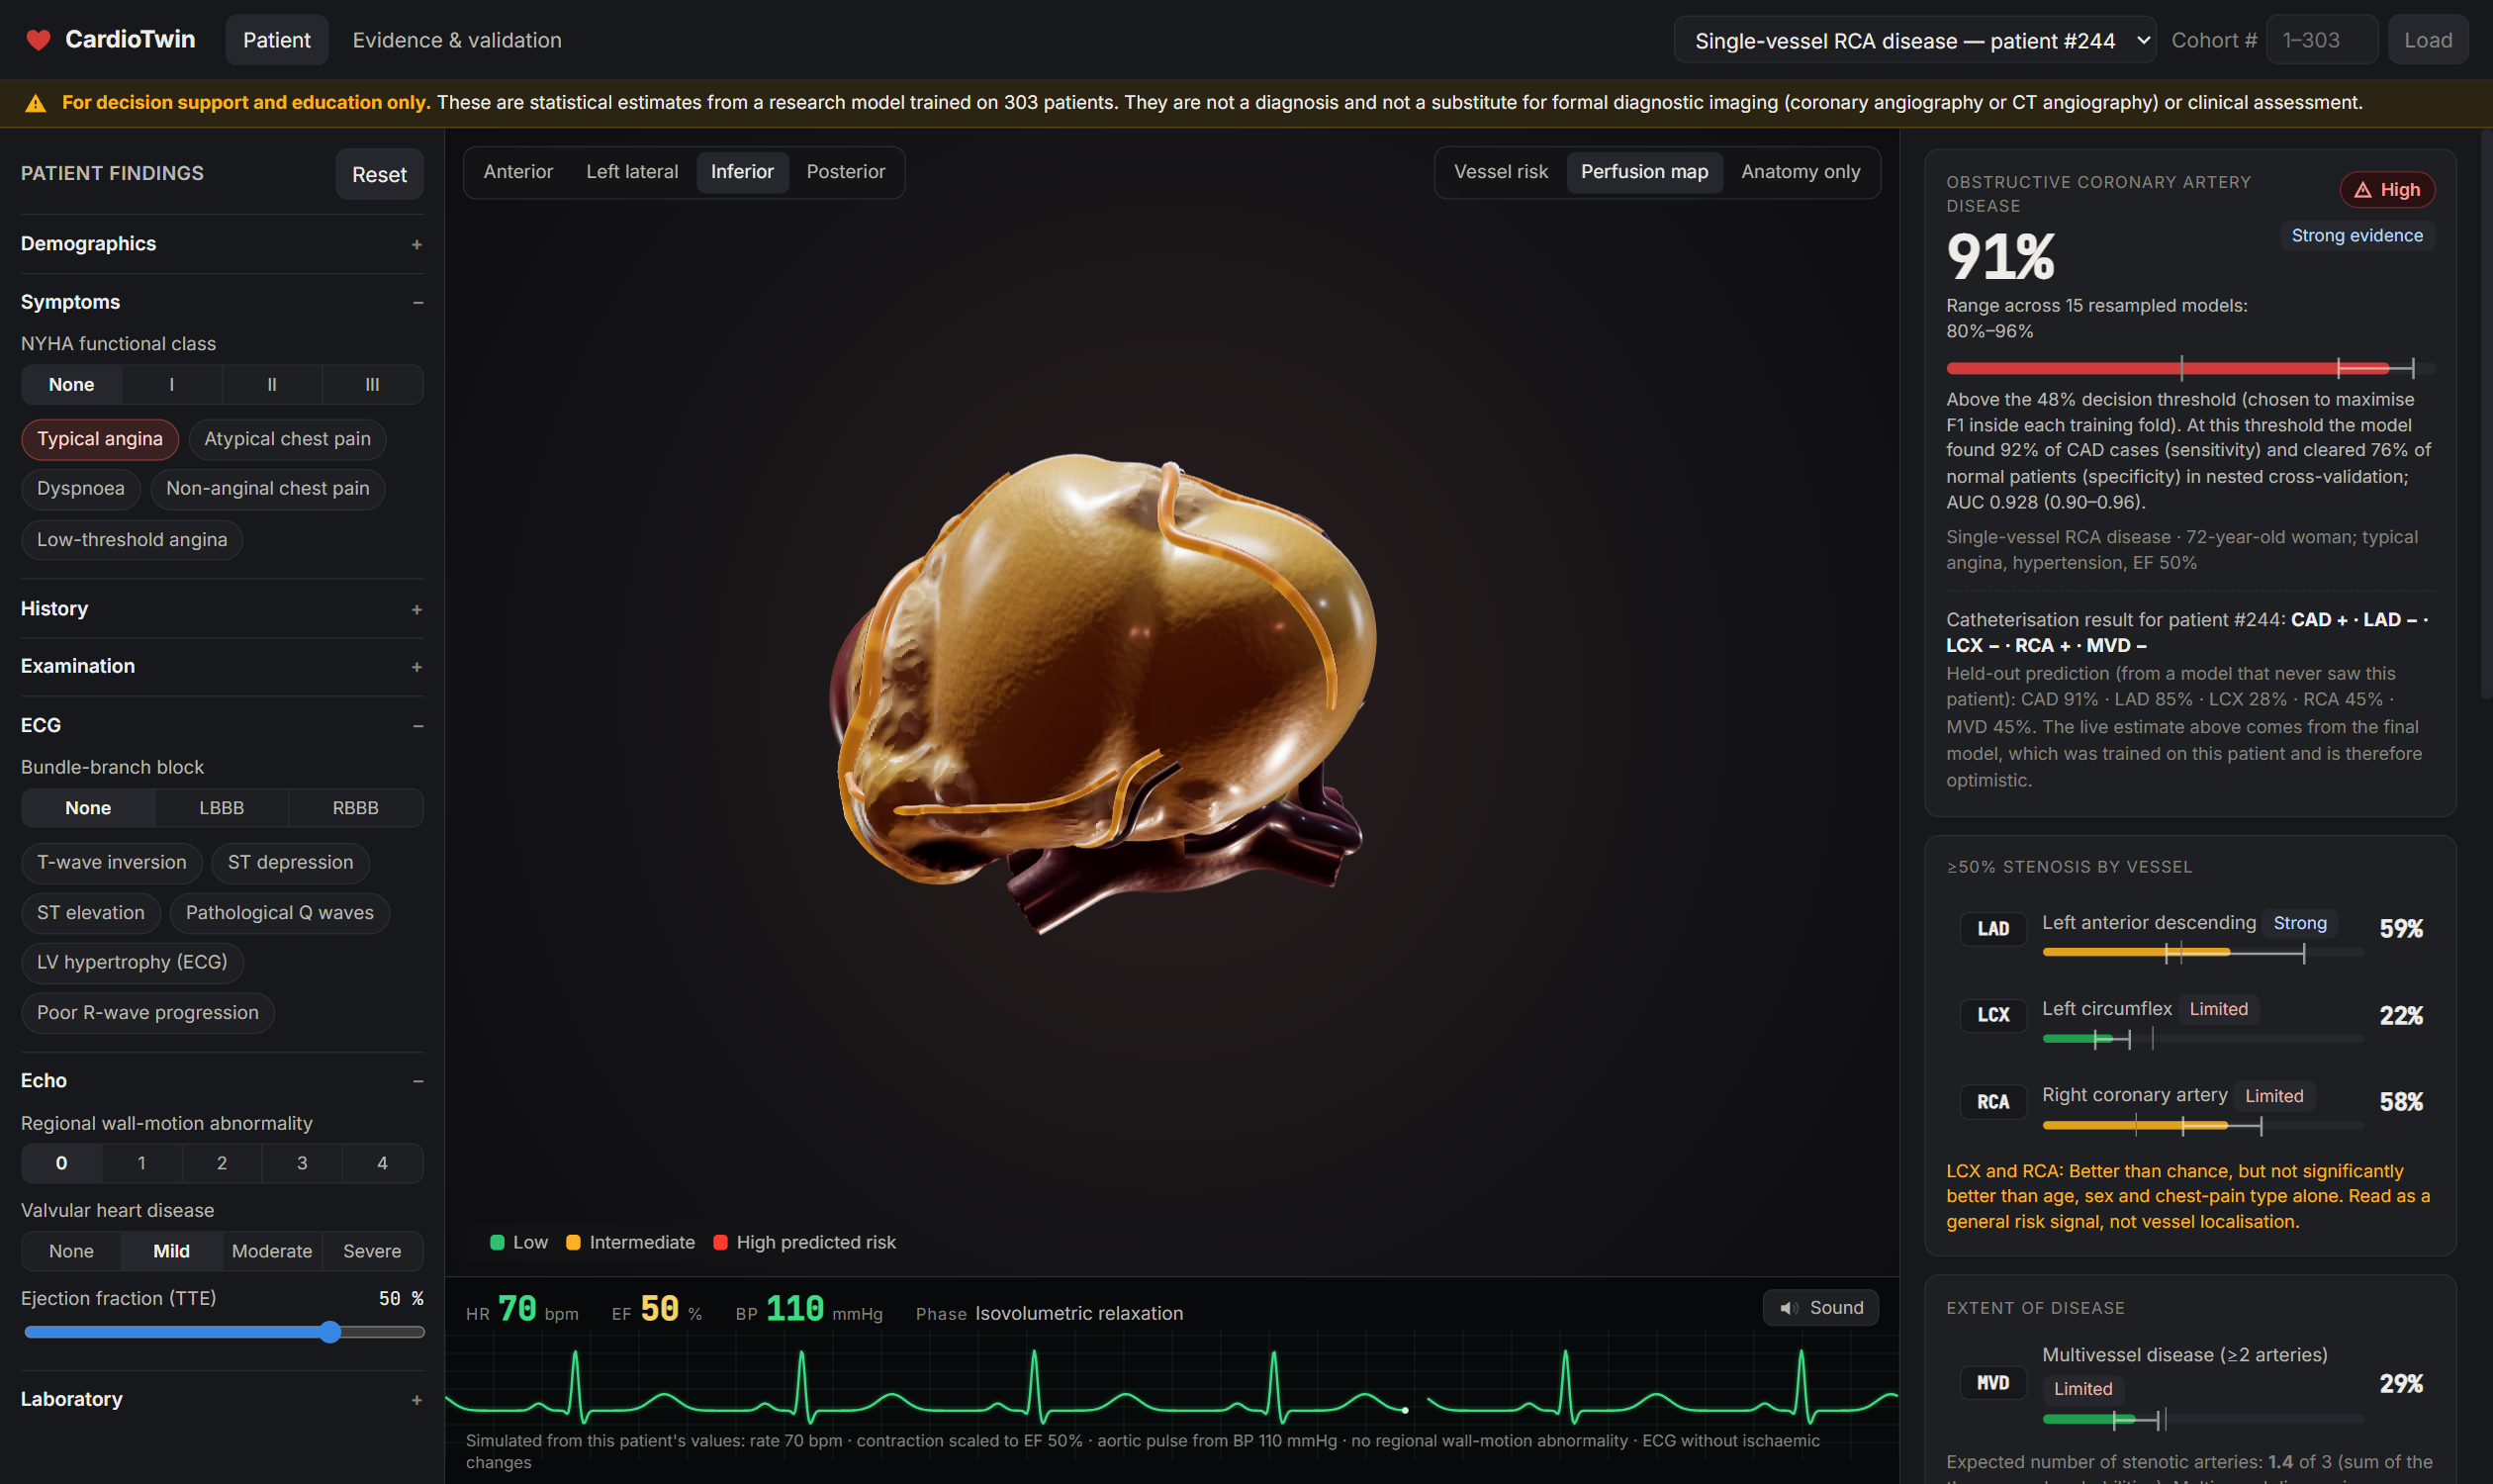
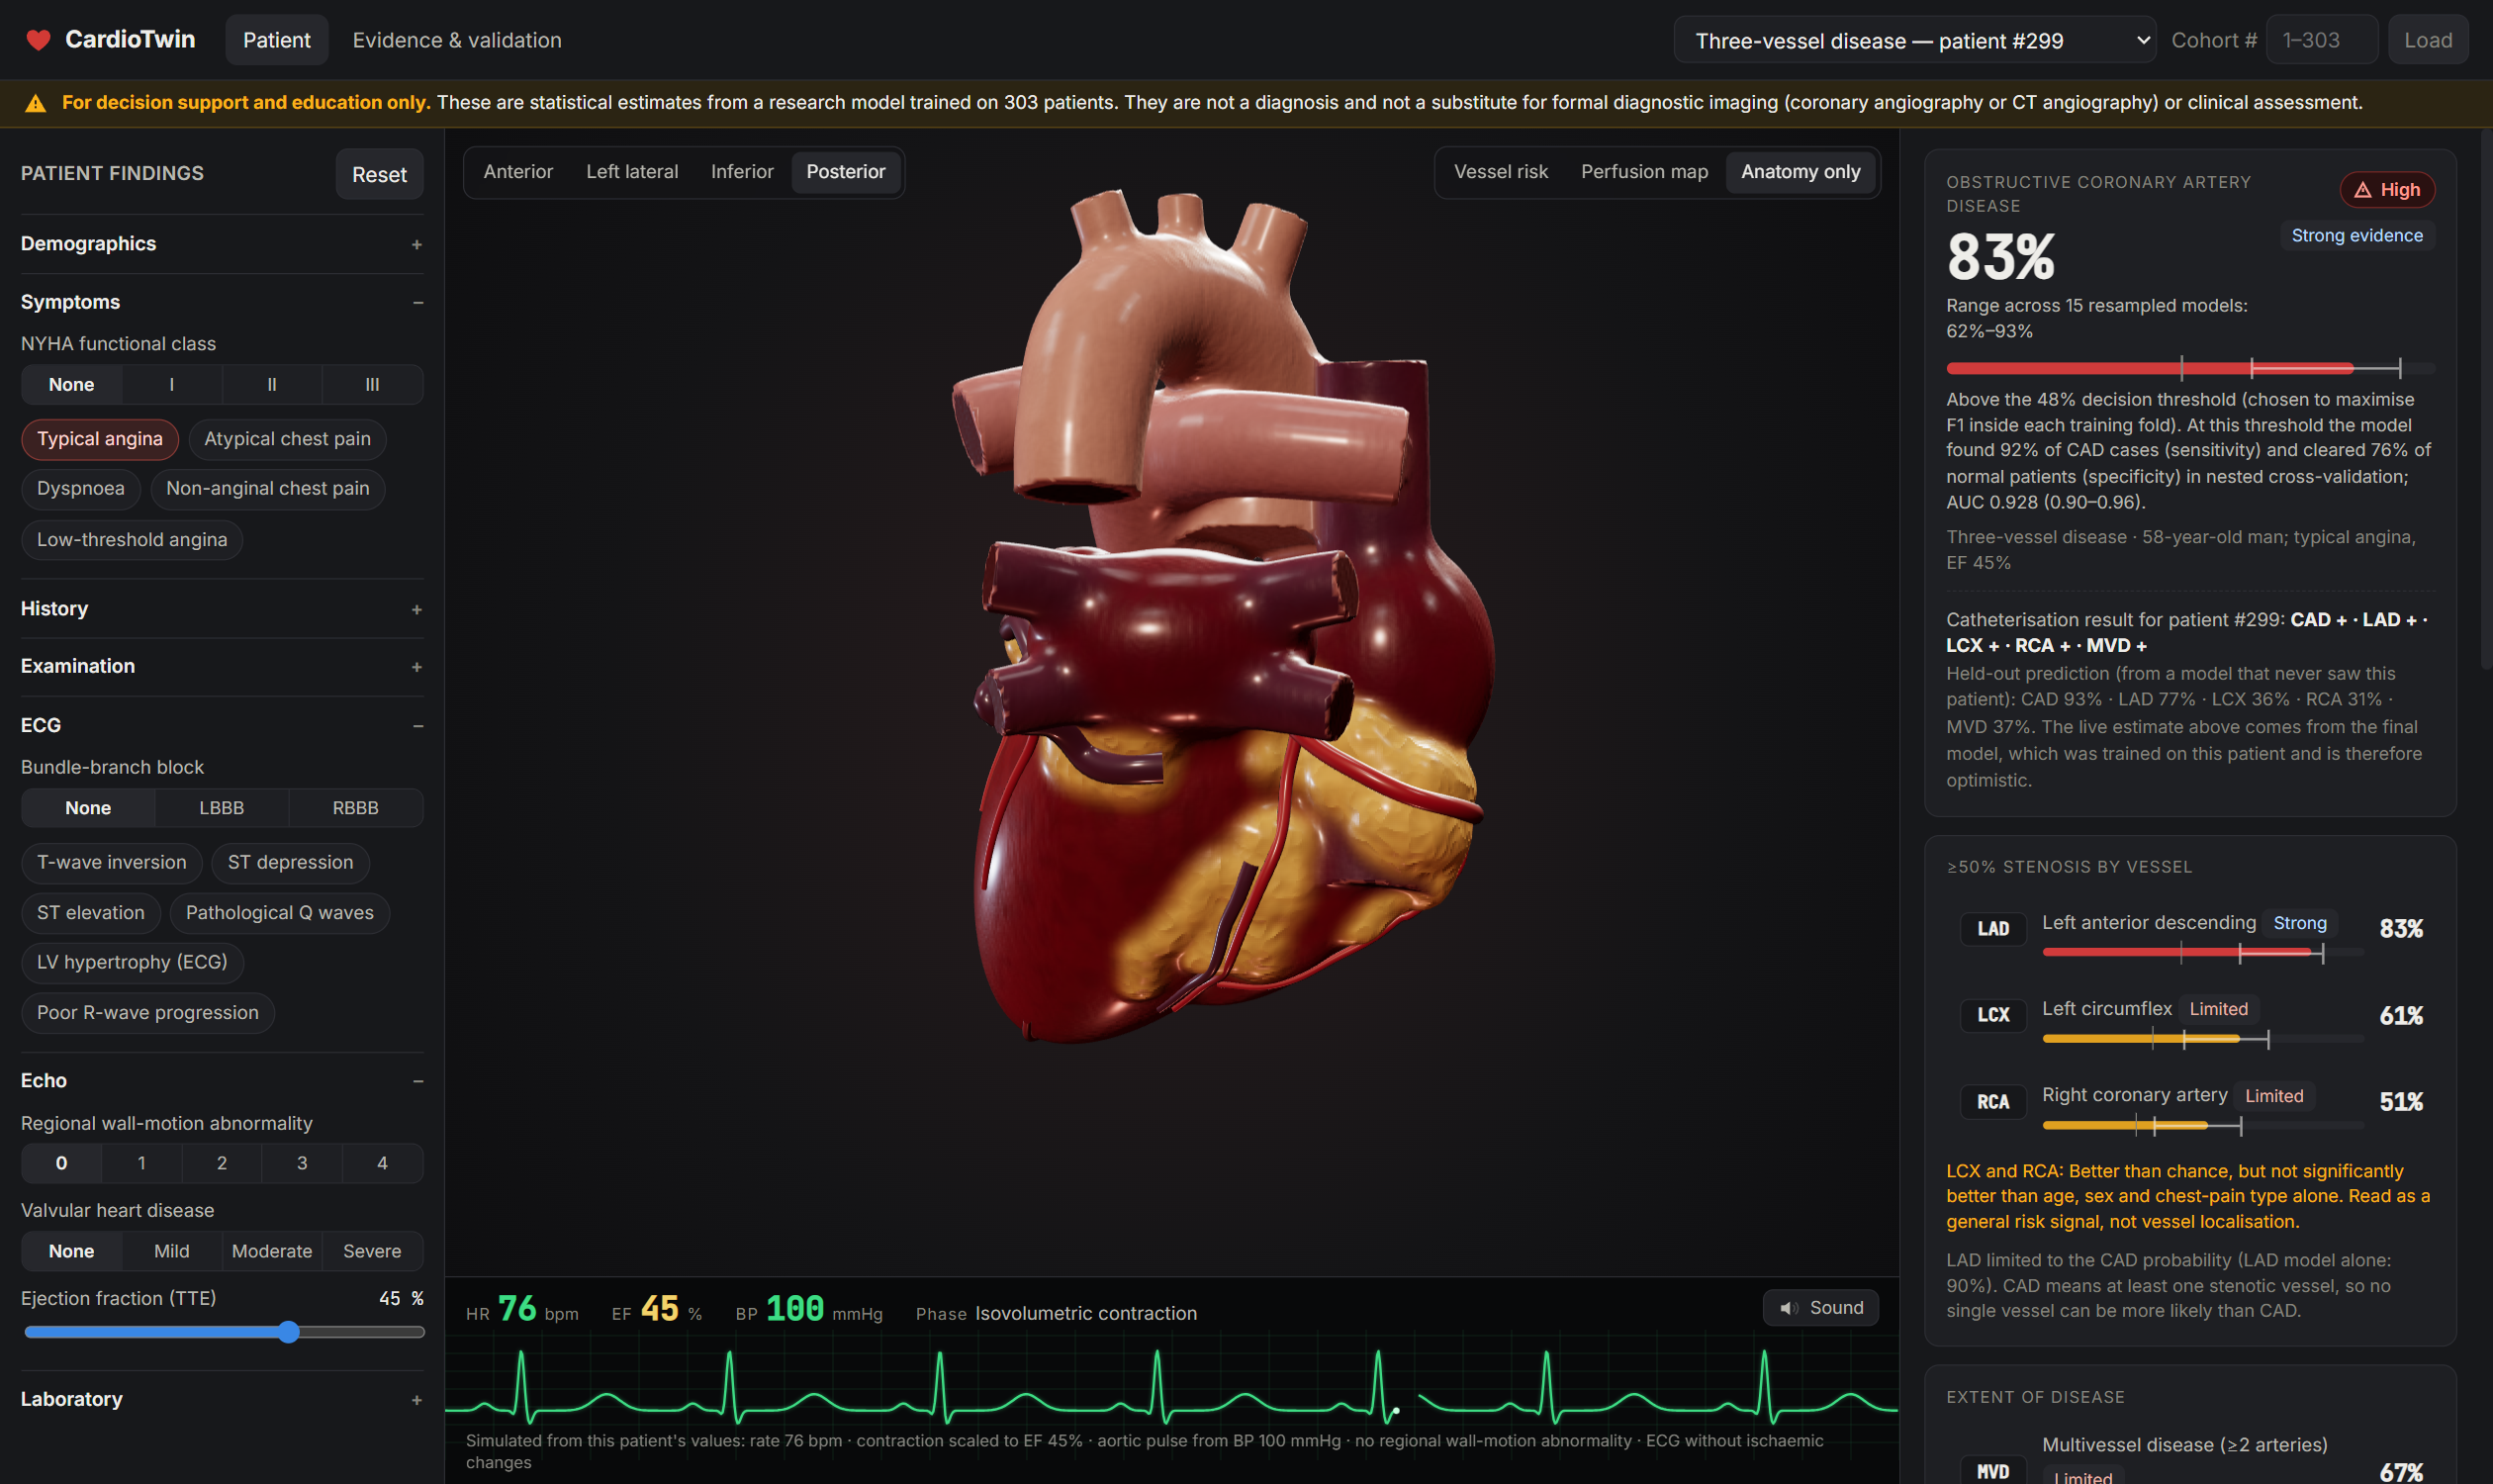
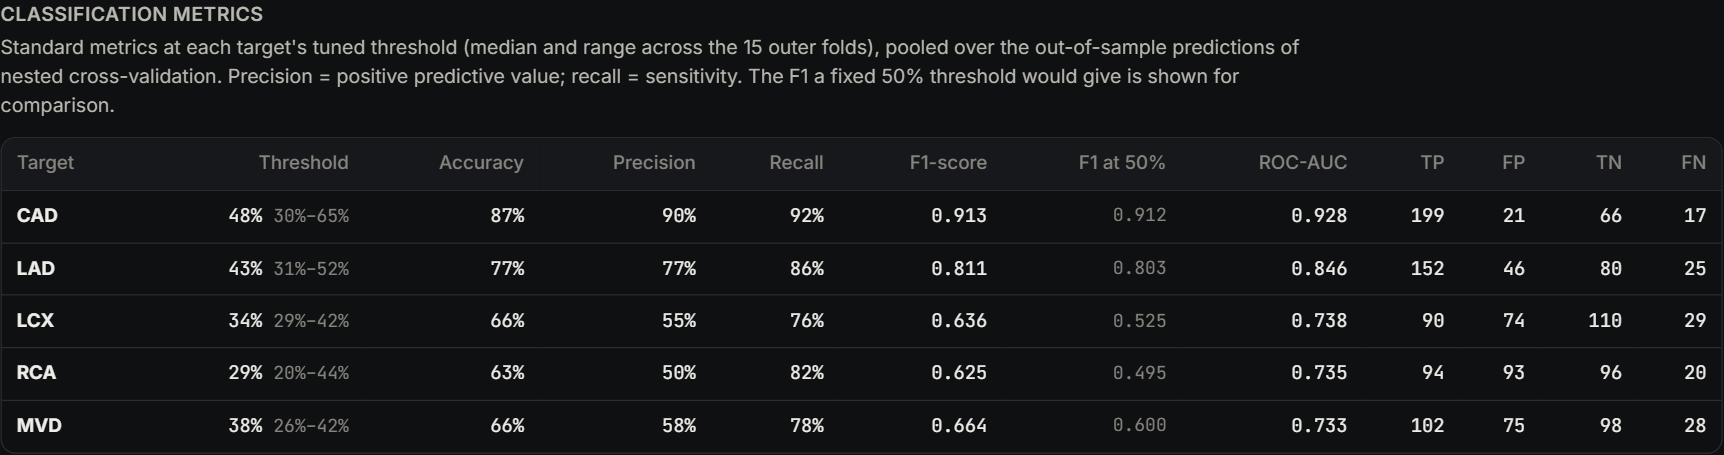
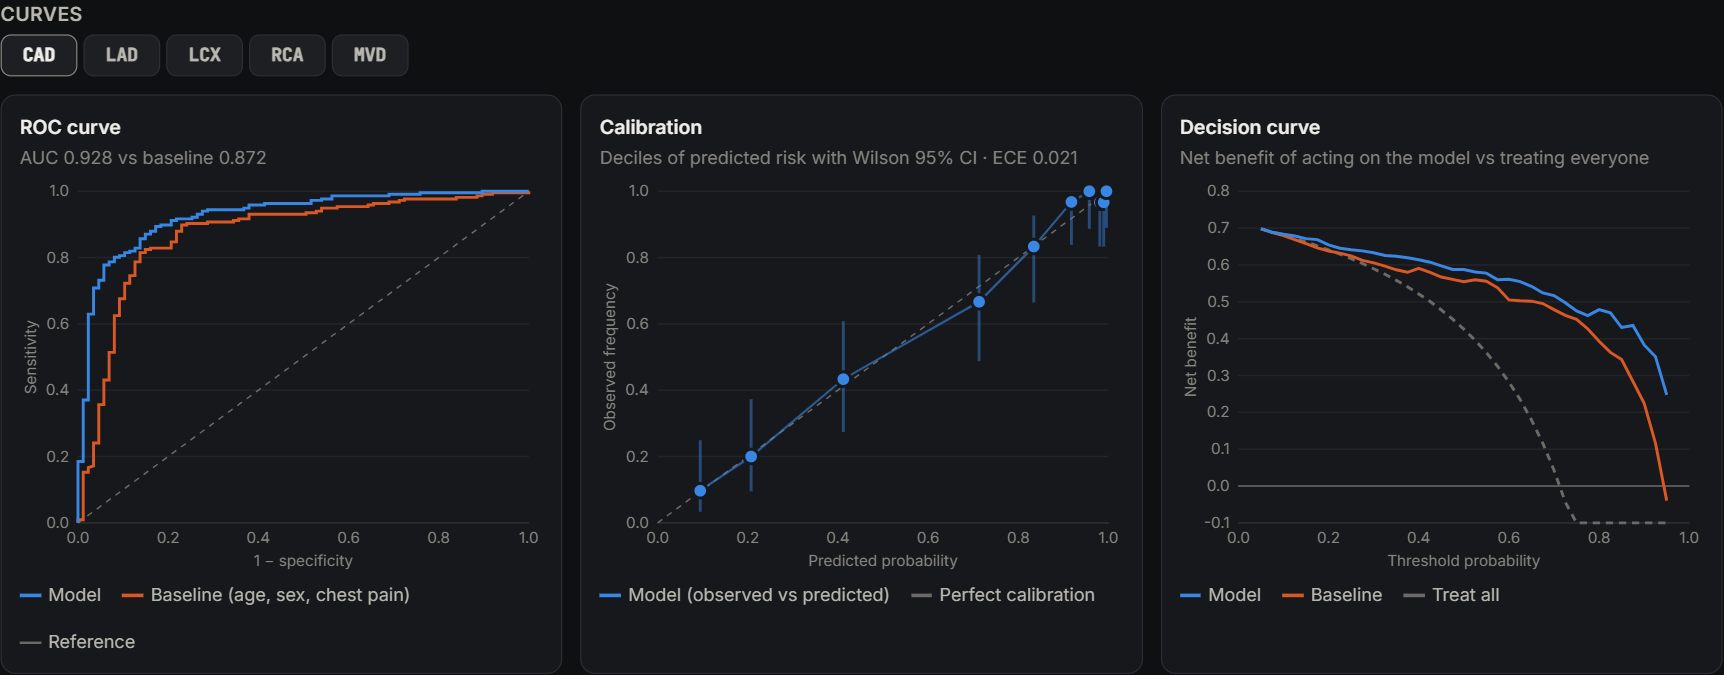
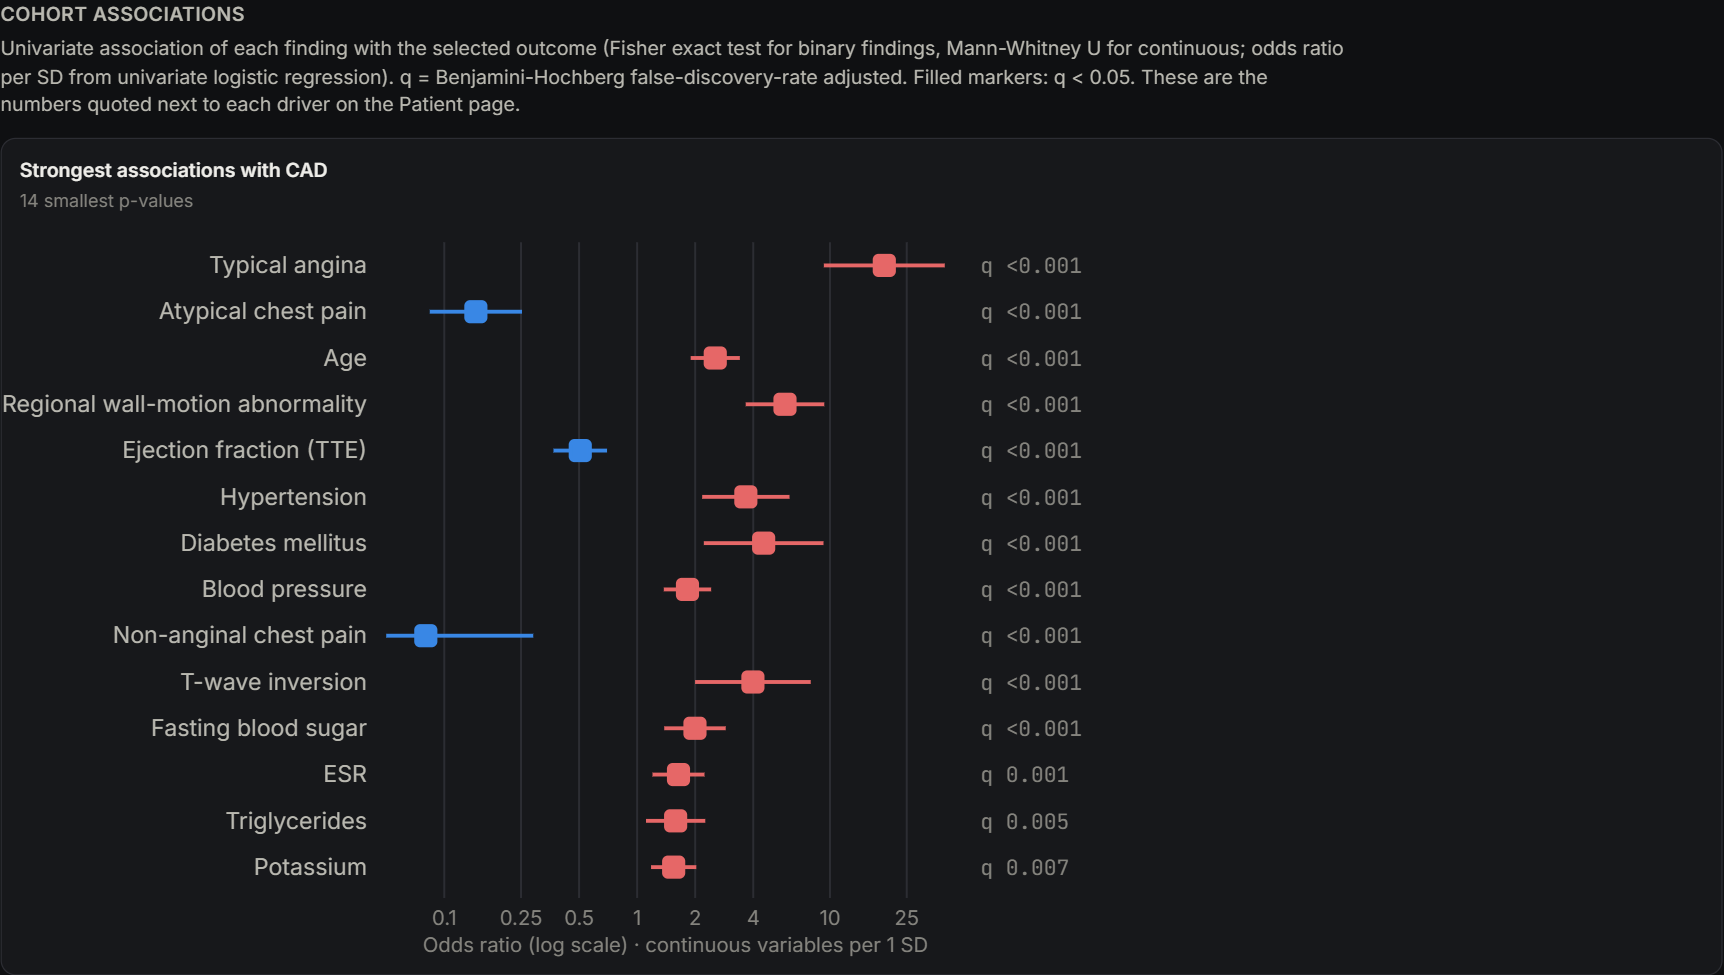
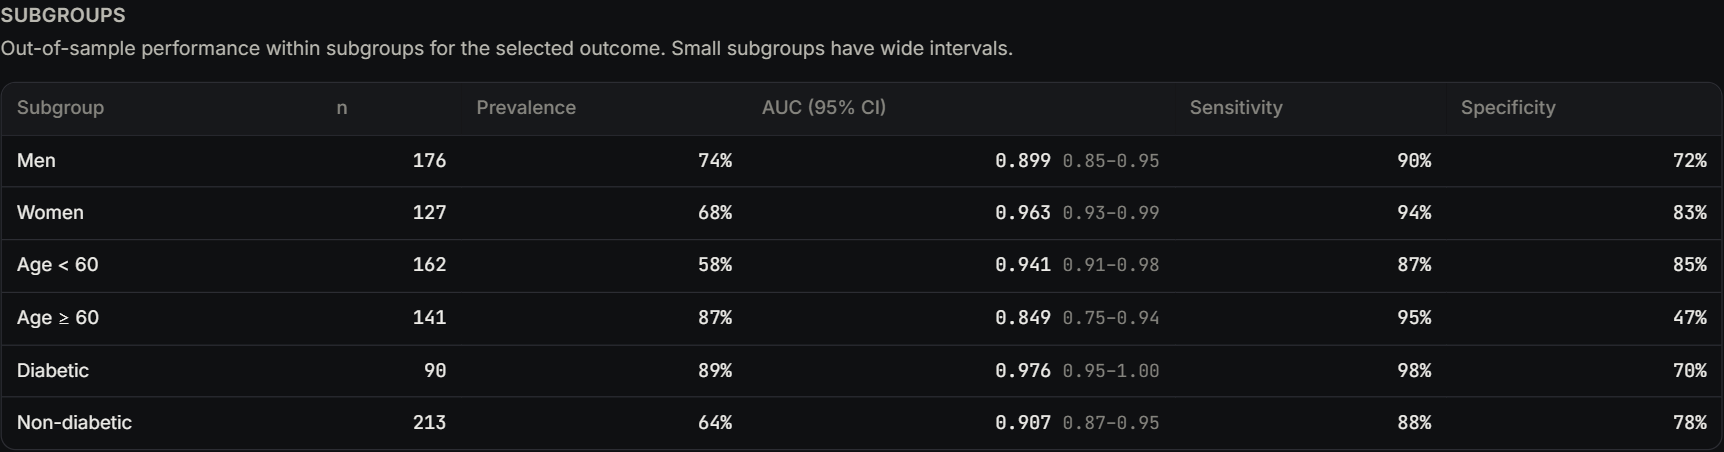
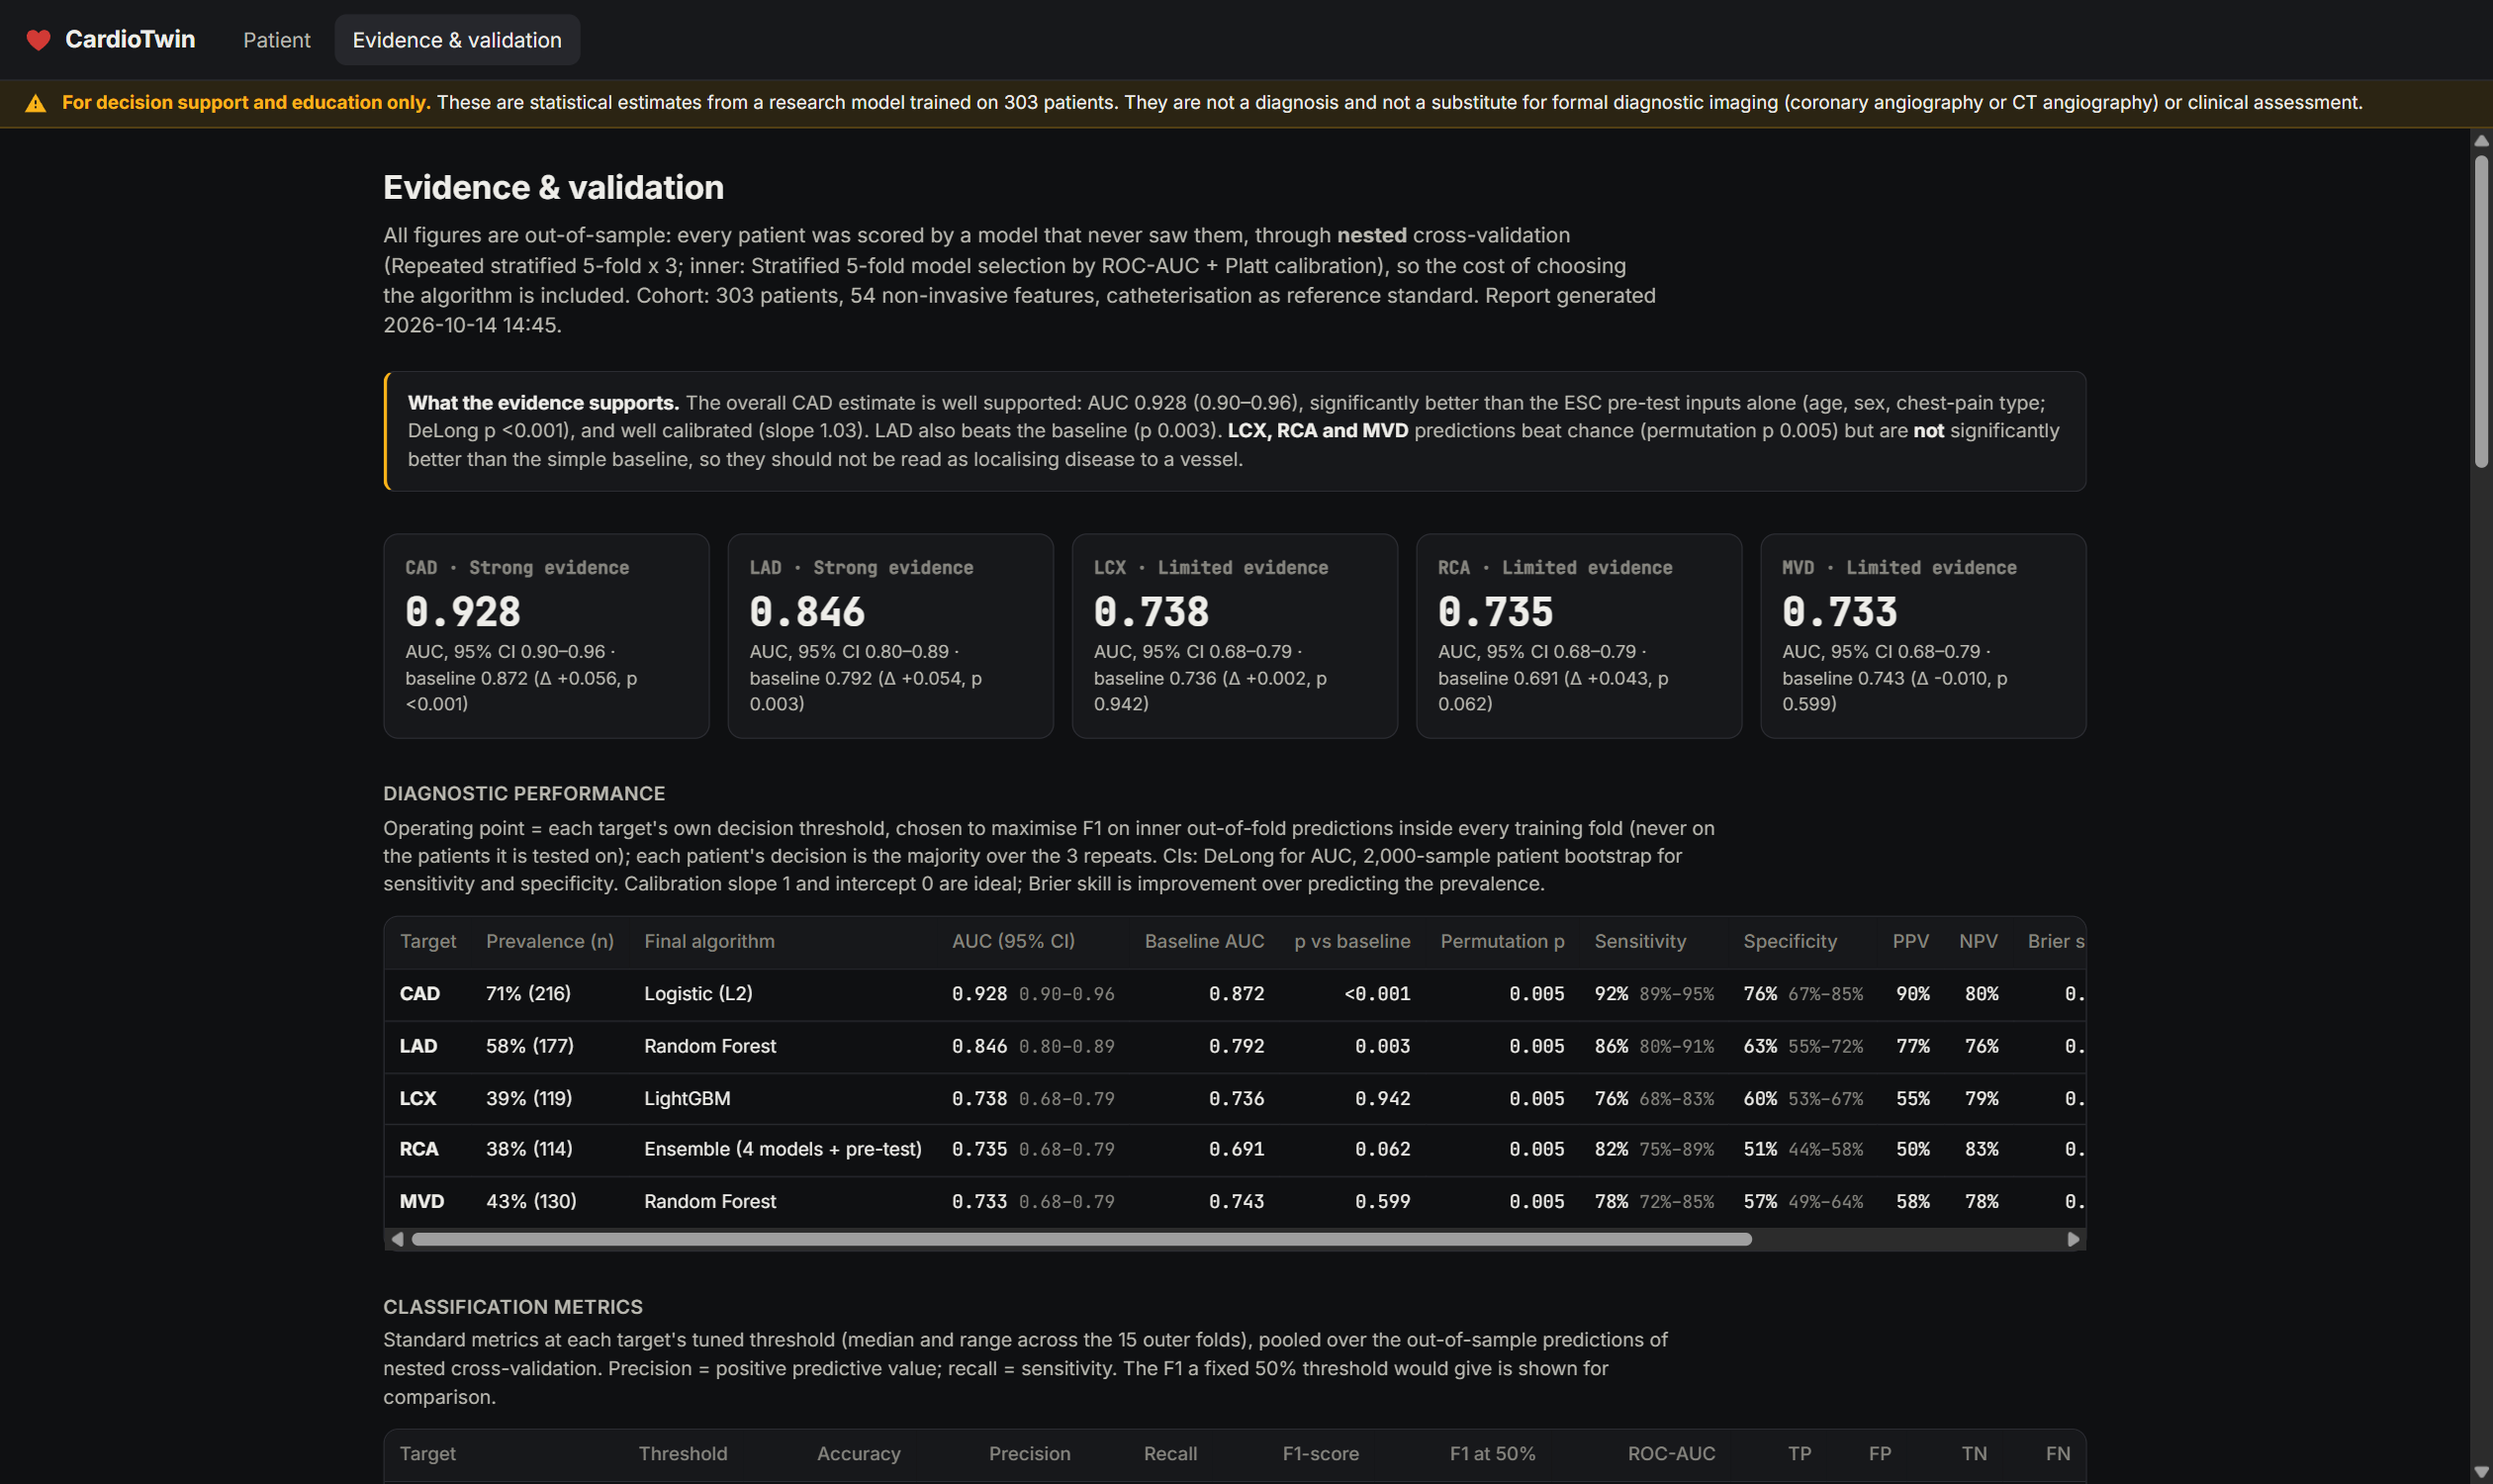
Predicts the probability of obstructive coronary artery disease (CAD), stenosis in each main artery (LAD, LCX, RCA), and multi-vessel disease. Each prediction is calibrated, has an uncertainty range across 15 models, and has its own decision threshold. Visualises the patient on an anatomical heart that beats with realistic cardiac-cycle timing. Its pumping strength follows the ejection fraction, damaged wall regions move less, LVH thickens the wall, bundle-branch blocks delay contraction, and the coronary territories at risk are highlighted. Monitors with a synthesised ECG that reflects the patient's findings (ST changes, Q waves, LVH, bundle-branch block) and optional heart sounds, including murmurs. Explains each prediction with SHAP drivers in probability points. Each driver is paired with its odds ratio in the cohort, plus the real angiogram results of the 25 most similar patients. Validates itself in an Evidence view with ROC, calibration and decision curves, a forest plot, subgroup analysis, a check against clinical guidelines, and an evidence grade for each target. Every edit to a finding updates the prediction and the heartbeat immediately.
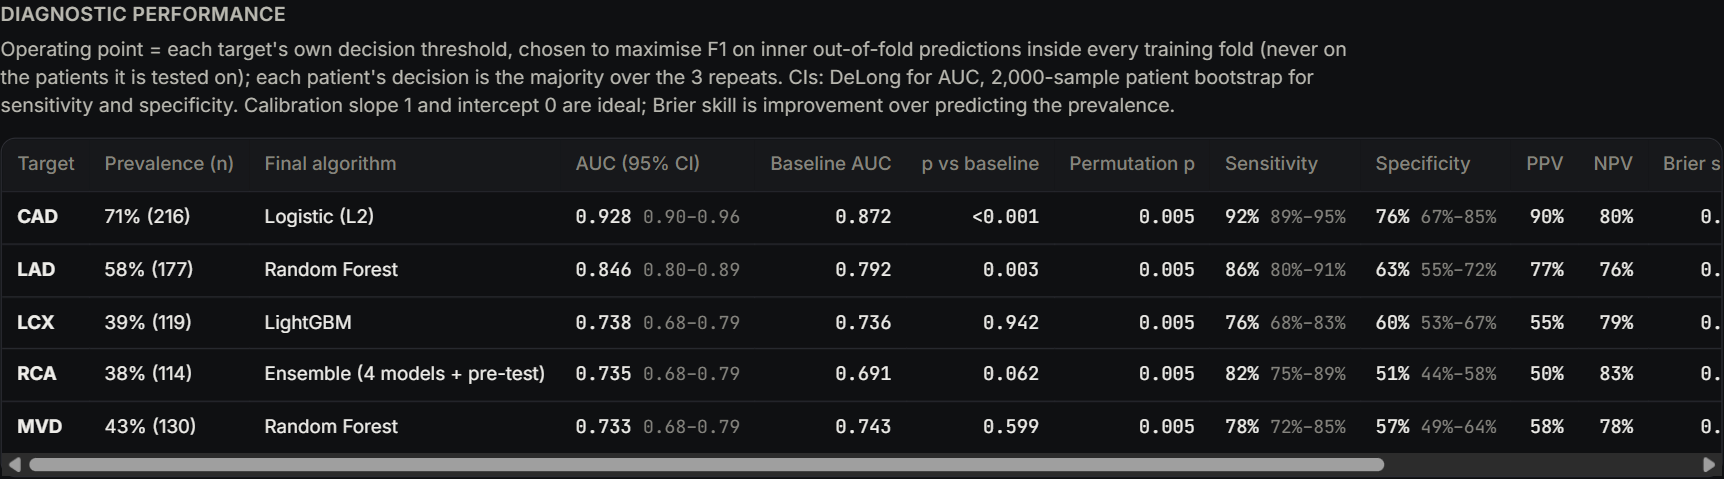
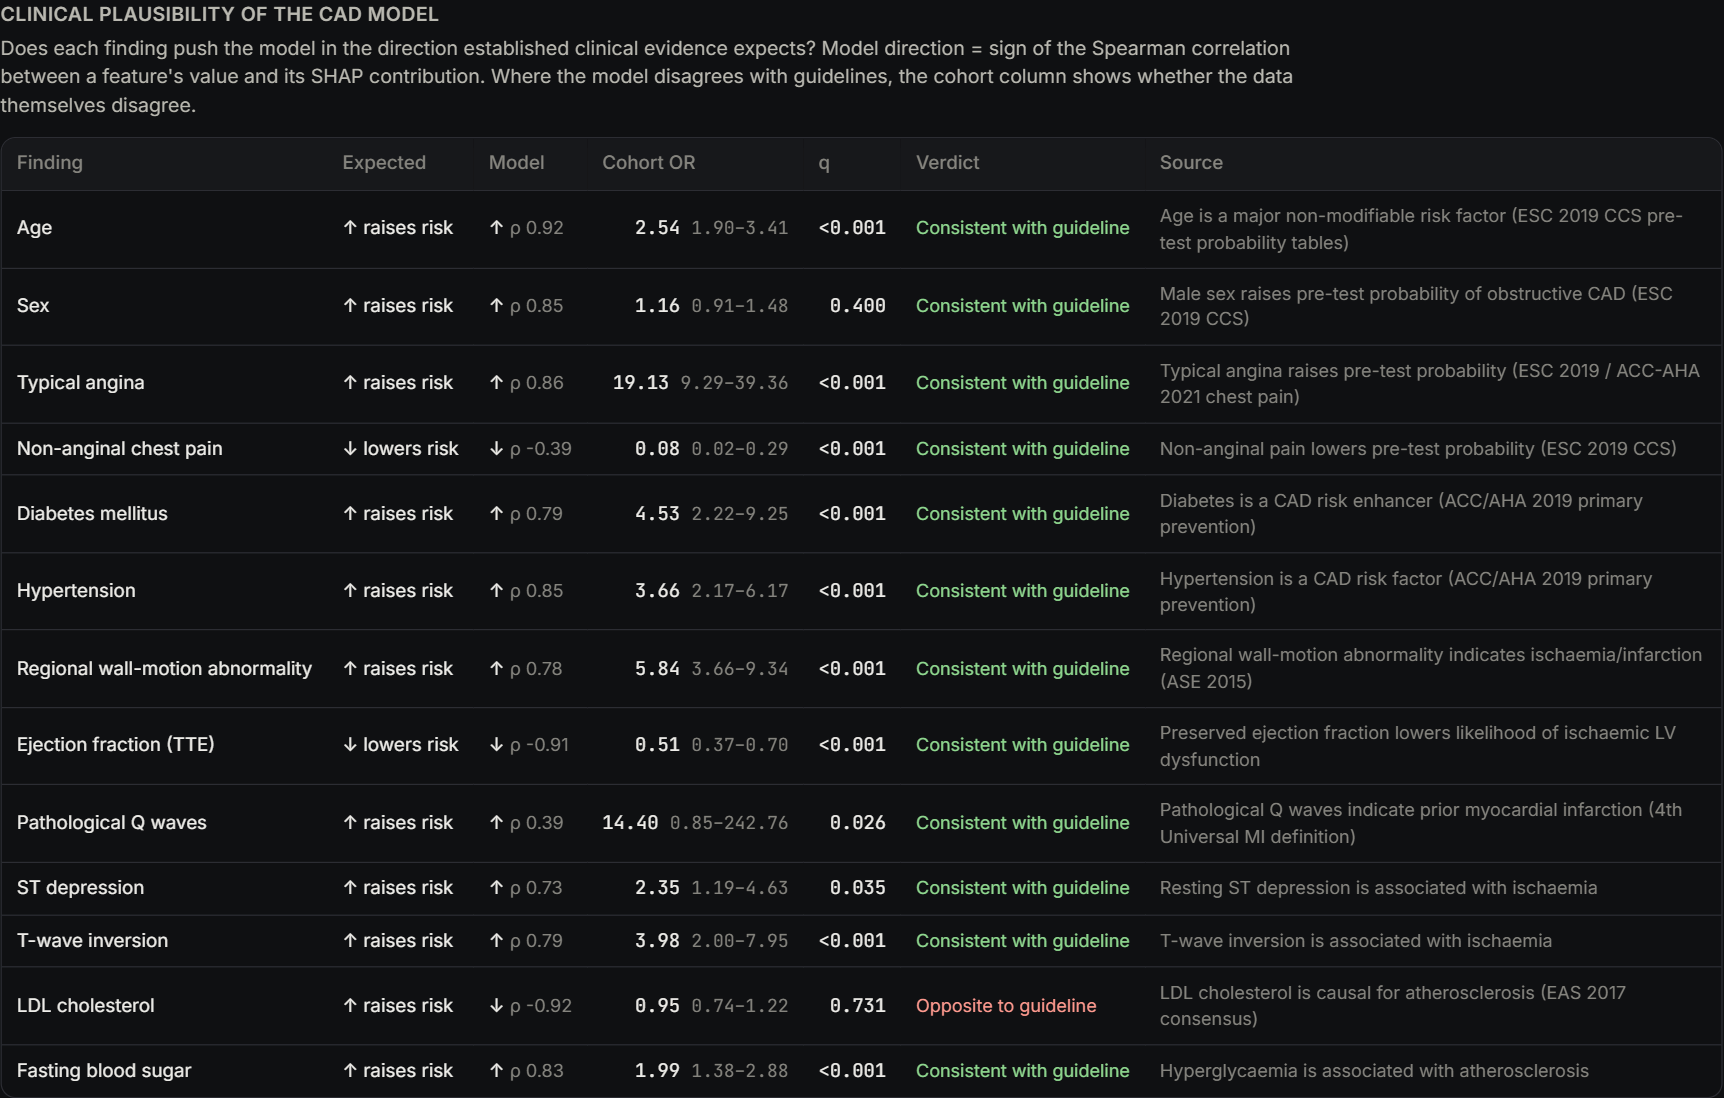
How we built it Data: the Z-Alizadeh Sani dataset (UCI): 303 patients, 54 non-invasive features, and angiogram results for each artery. The angiogram labels are kept out of the features to prevent leakage. ML: Python, scikit-learn, XGBoost, LightGBM, CatBoost and SHAP. Nested cross-validation chooses between logistic regression, tree models and an ensemble for each target, so the reported scores include the cost of that choice. Probabilities are calibrated with Platt scaling. Every model is compared against a clinical pre-test baseline (ESC 2019: age, sex, chest-pain type) with DeLong tests and permutation tests. Backend: a FastAPI server for predictions, uncertainty ranges, cohort patients and the validation report. Frontend: Three.js with deformation on the GPU. The heart mesh is generated from a signed-distance field (scikit-image), and the cardiac-cycle timing, ECG and heart sounds are synthesised in JavaScript. Challenges we ran into Small data: with 303 patients, honest validation mattered more than leaderboard scores. Nested CV, confidence intervals and permutation tests were essential. Locating the disease is hard: predicting which artery is narrowed is much harder than predicting whether there is disease at all. LCX, RCA and multi-vessel predictions beat chance but not the clinical baseline, so we label them "Limited" instead of overselling them. Logical consistency: a single artery can't be more likely to be diseased than CAD itself, so artery probabilities are capped at the CAD probability, both in validation and in the app. Missing anatomy: the dataset records how many wall regions move abnormally but not which ones, so we place them in the highest-risk territories. Building a believable heart in code: chambers, valves, great vessels, coronaries in their grooves, and fat, generated procedurally and animated in real time. Speed: library warnings fired on every tree of every prediction and slowed requests about 3×. Filtering them brought responses down to about 0.15 s. Accomplishments that we're proud of CAD ROC-AUC of 0.928 (95% CI 0.896–0.960), out-of-sample, with a calibration slope of 1.03. It is significantly better than the clinical baseline (p < 0.001). The LAD prediction also beats the baseline significantly (AUC 0.846). Every claim in the app is backed by evidence: odds ratios with FDR q-values, Wilson confidence intervals and an evidence grade. The CAD model reproduces 12 of 13 guideline-expected risk directions. The one exception (LDL) has a likely explanation: patients referred for angiography are often already on statins. A heart that beats realistically and is driven by the patient's data, all in the browser. What we learned A model is only as trustworthy as its validation. Nested CV and comparing against a simple clinical baseline kept us honest. Calibration and decision thresholds matter as much as AUC in clinical use. Tuning the thresholds raised LCX and RCA recall from 45% and 41% to 76% and 82%. Saying "we can't support this prediction well" is a feature, not a weakness. Physiology (cardiac-cycle timing, ECG patterns, wall motion) makes model output far easier to understand than a table of numbers. What's next for Cardiac_digital_twin External validation on larger, multi-centre cohorts. Adding imaging (CT coronary angiography, echo strain, perfusion) to locate diseased arteries more reliably. Patient-specific anatomy built from real scans instead of a generic heart. Tracking patients over time to model progression and the effect of treatment. Clinician user studies and a path toward regulatory-grade evaluation.
Built With
- catboost
- css3
- fastapi
- html5
- javascript
- joblib
- jupyter
- lightgbm
- matplotlib
- numpy
- pandas
- python
- scikit-image
- scikit-learn
- scipy
- shap
- three.js
- uvicorn
- web-audio-api
- webgl
- xgboost

Log in or sign up for Devpost to join the conversation.