-
-
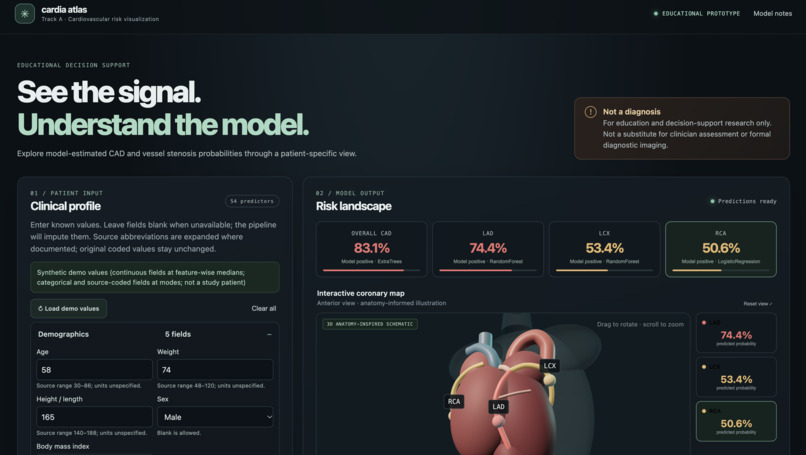
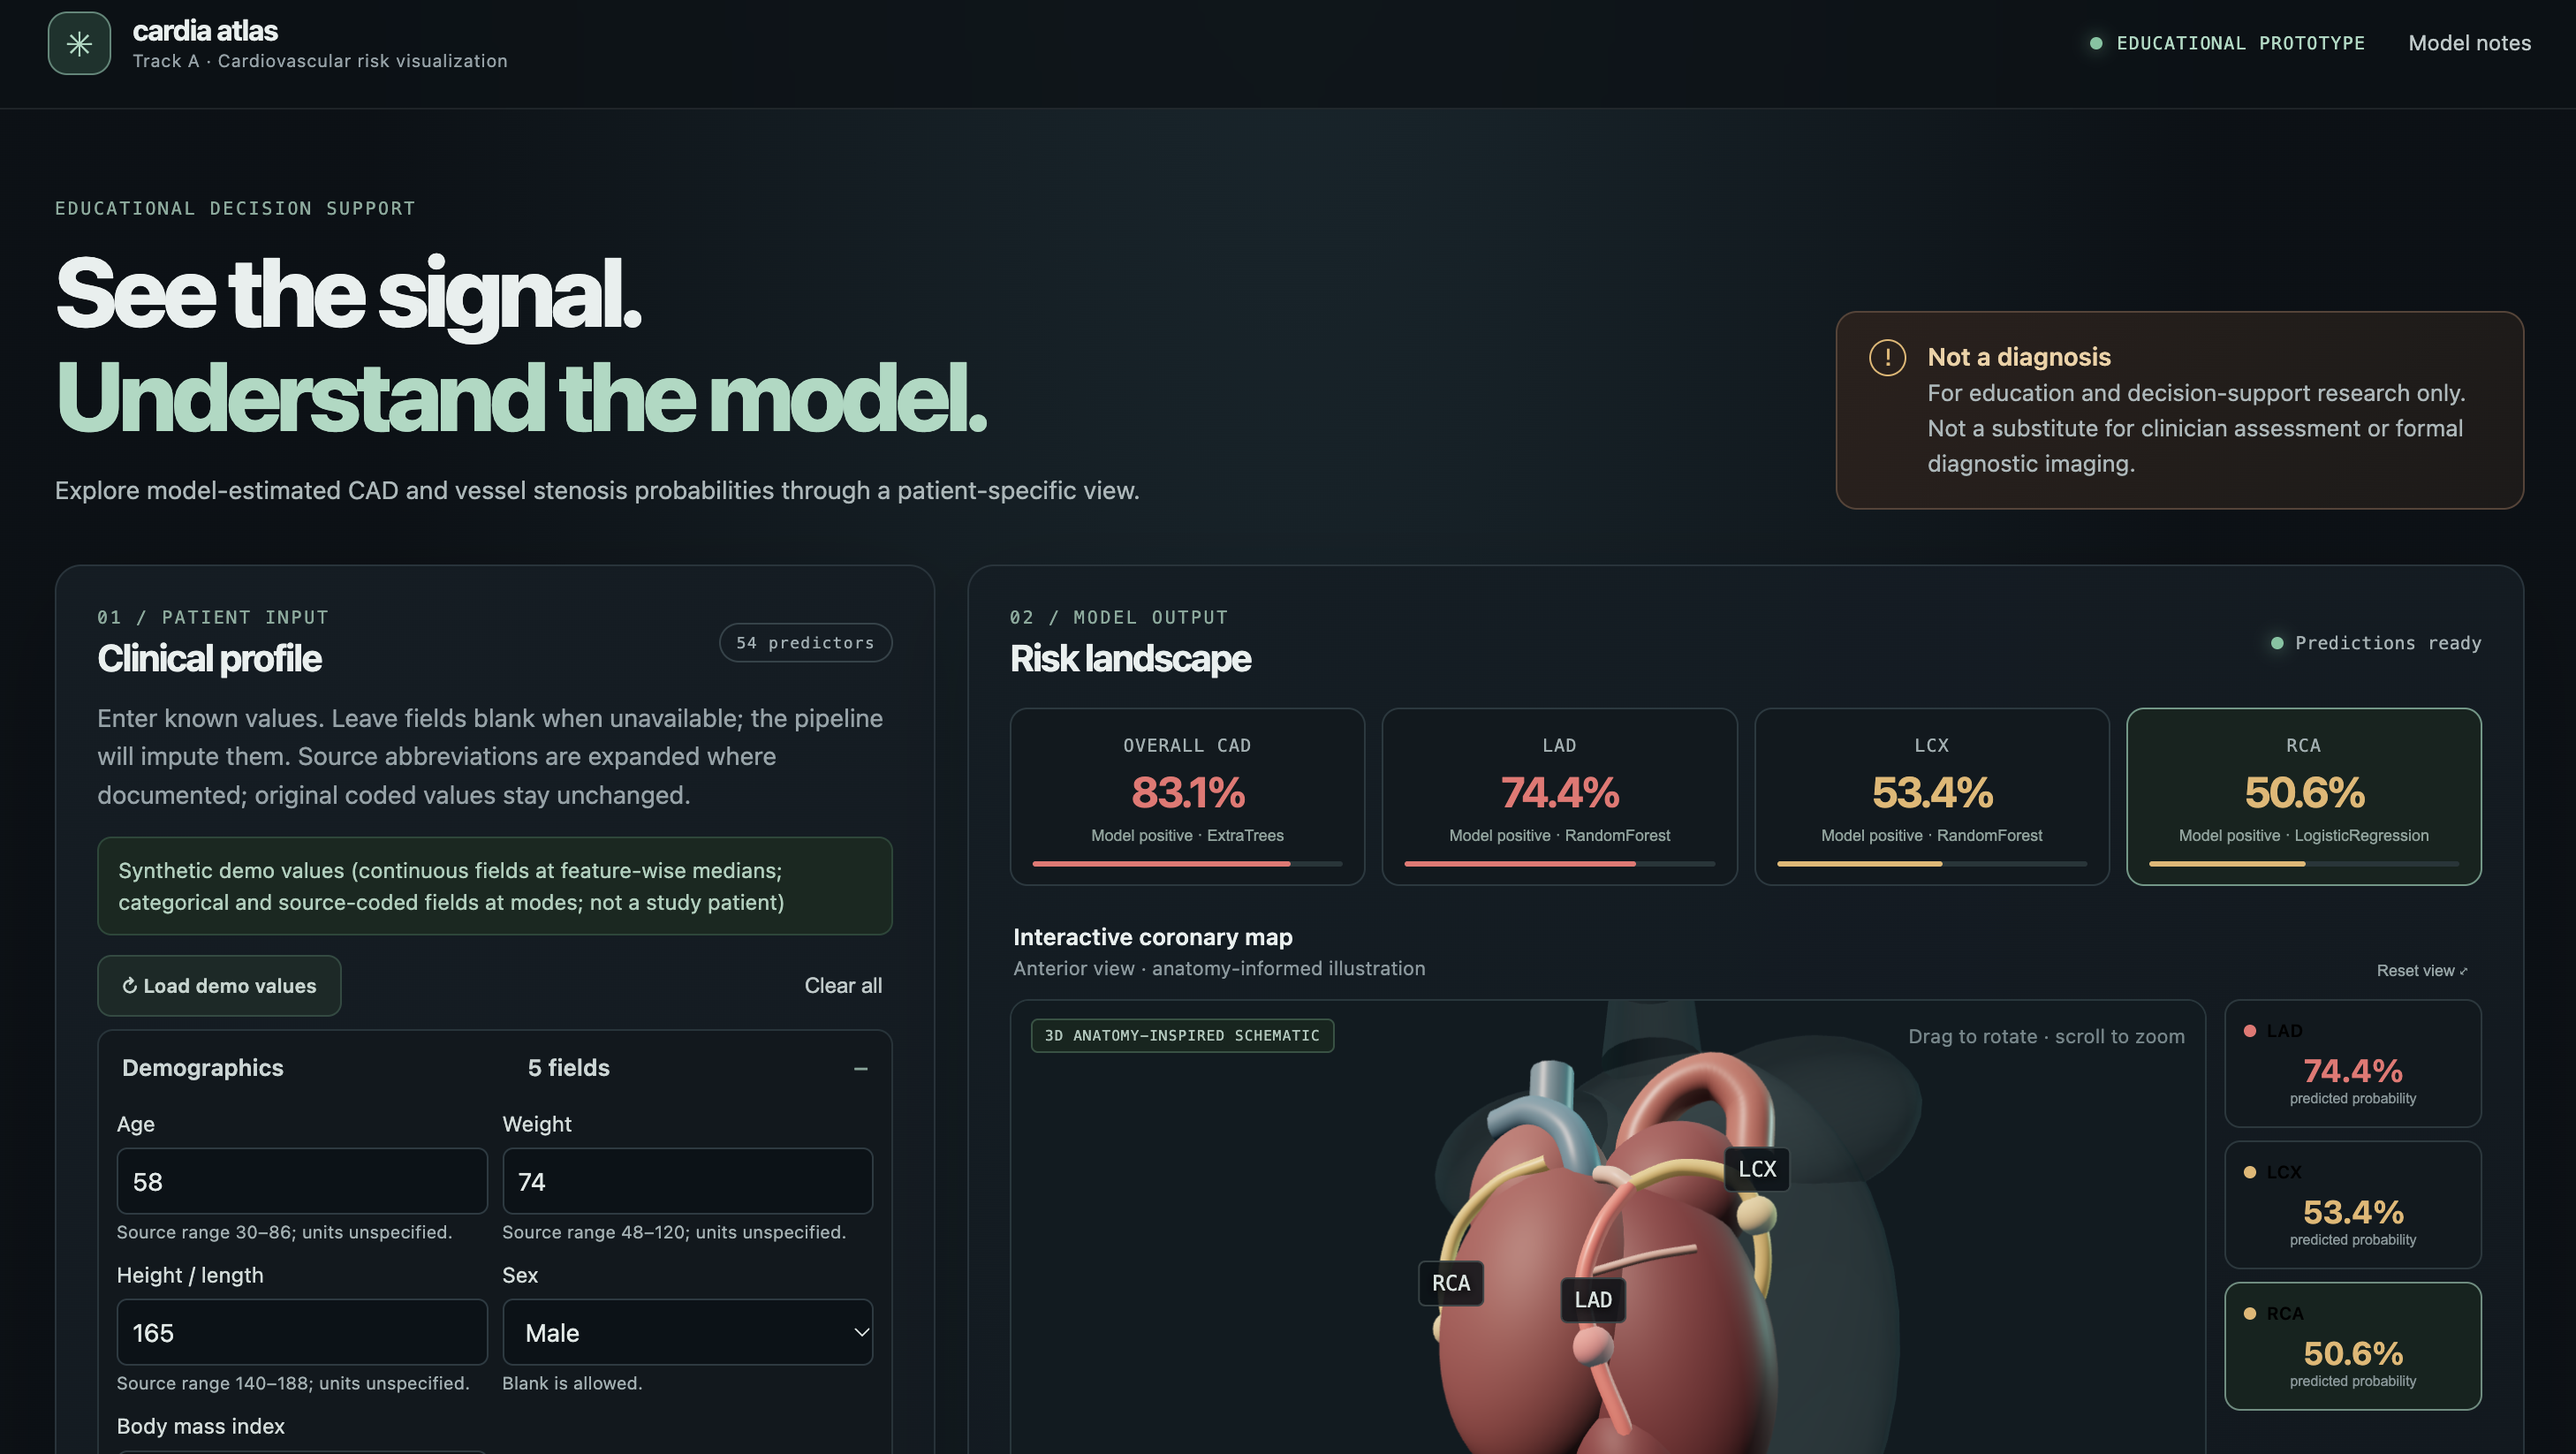
Cardia Atlas dashboard with clinical inputs, CAD and vessel predictions, and an interactive 3D coronary view.
-
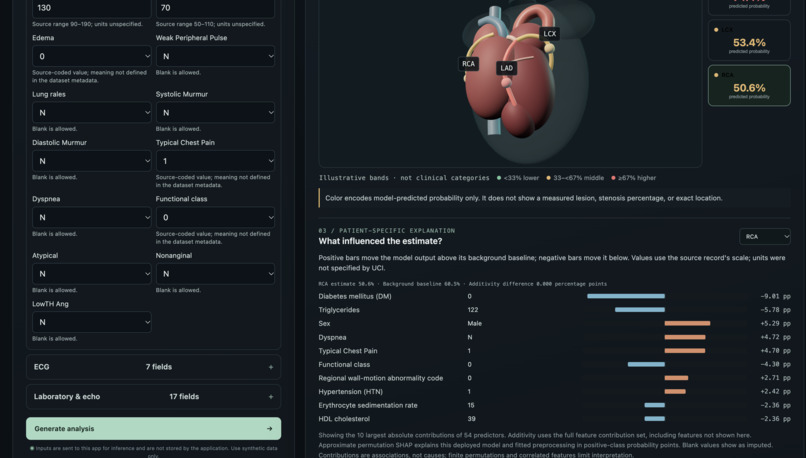
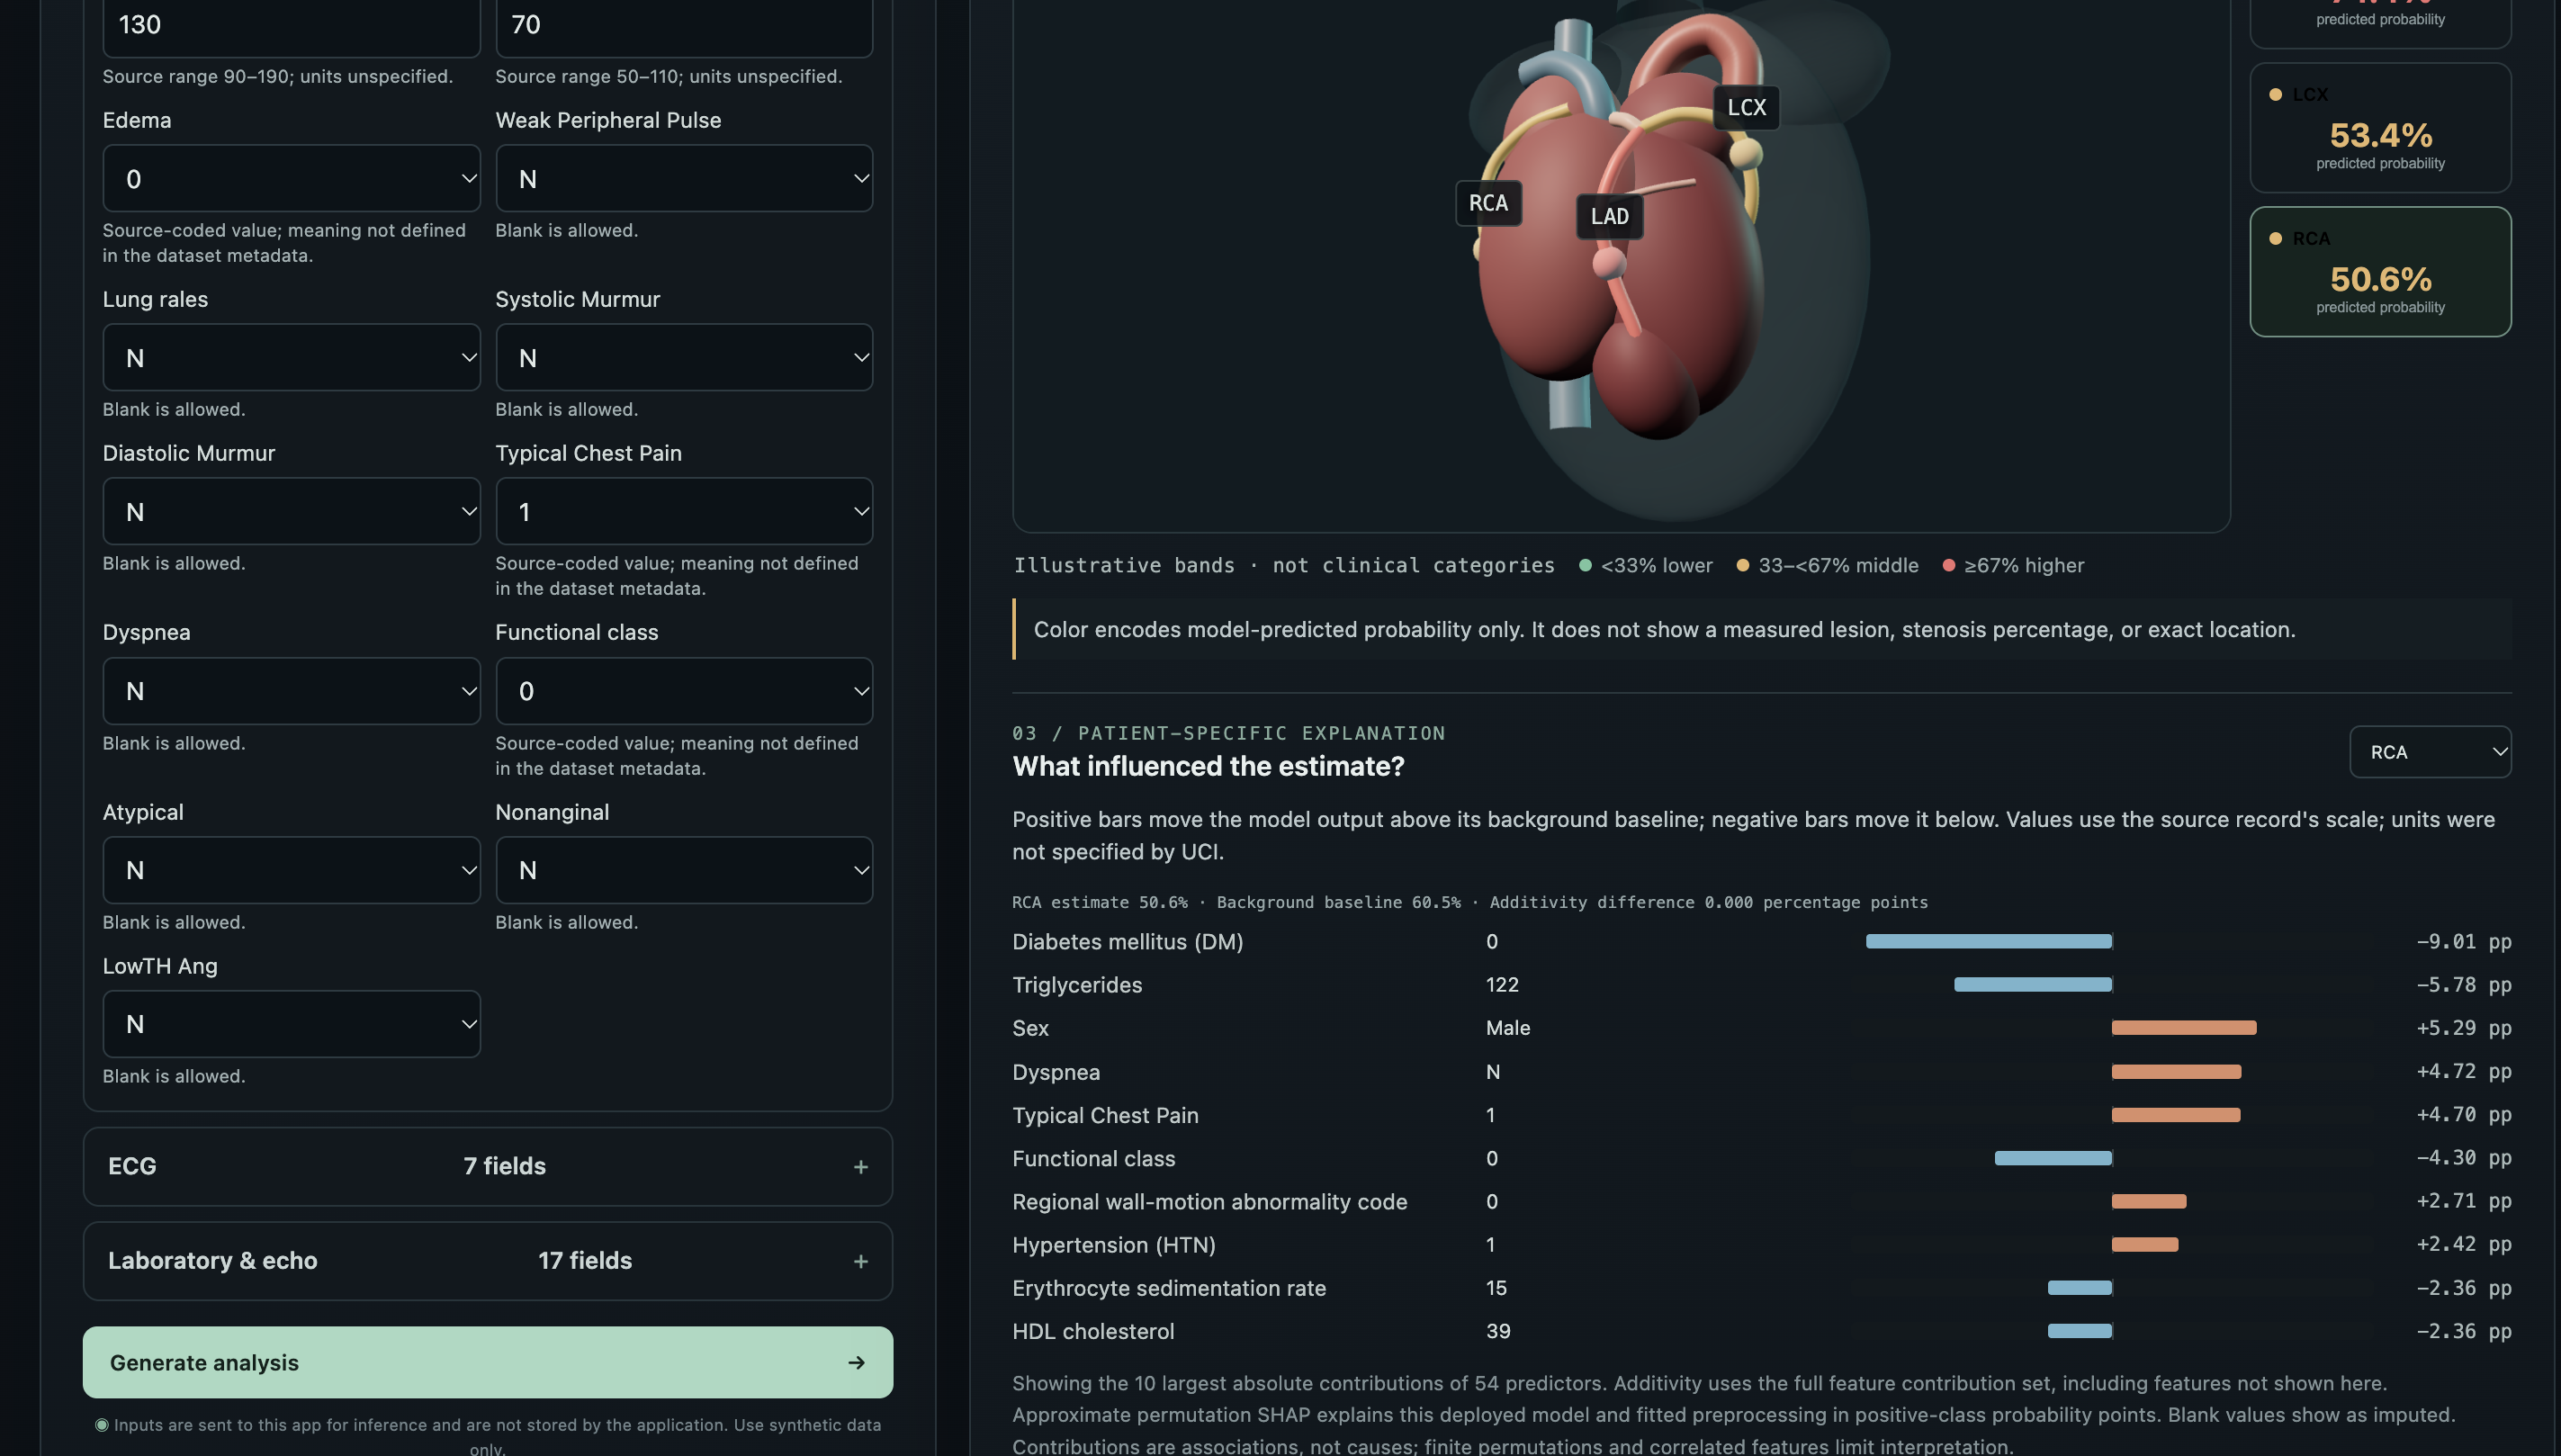
Interactive coronary view with patient-specific SHAP explanations showing factors that influence the selected prediction.
-
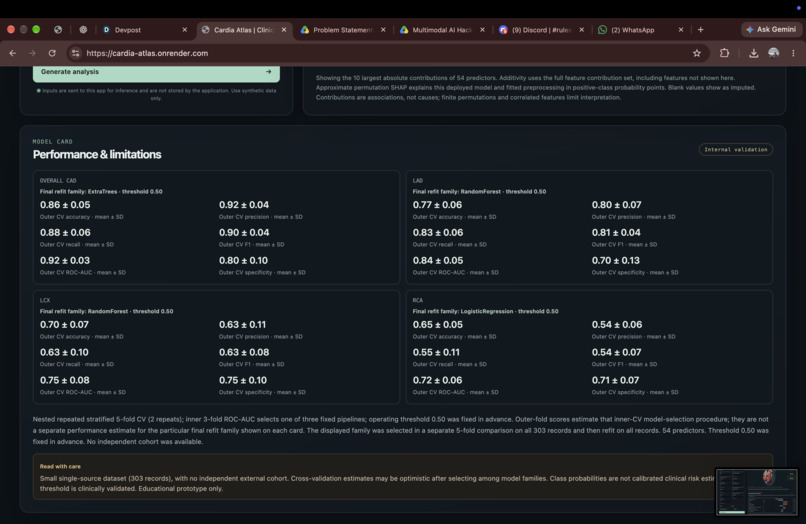
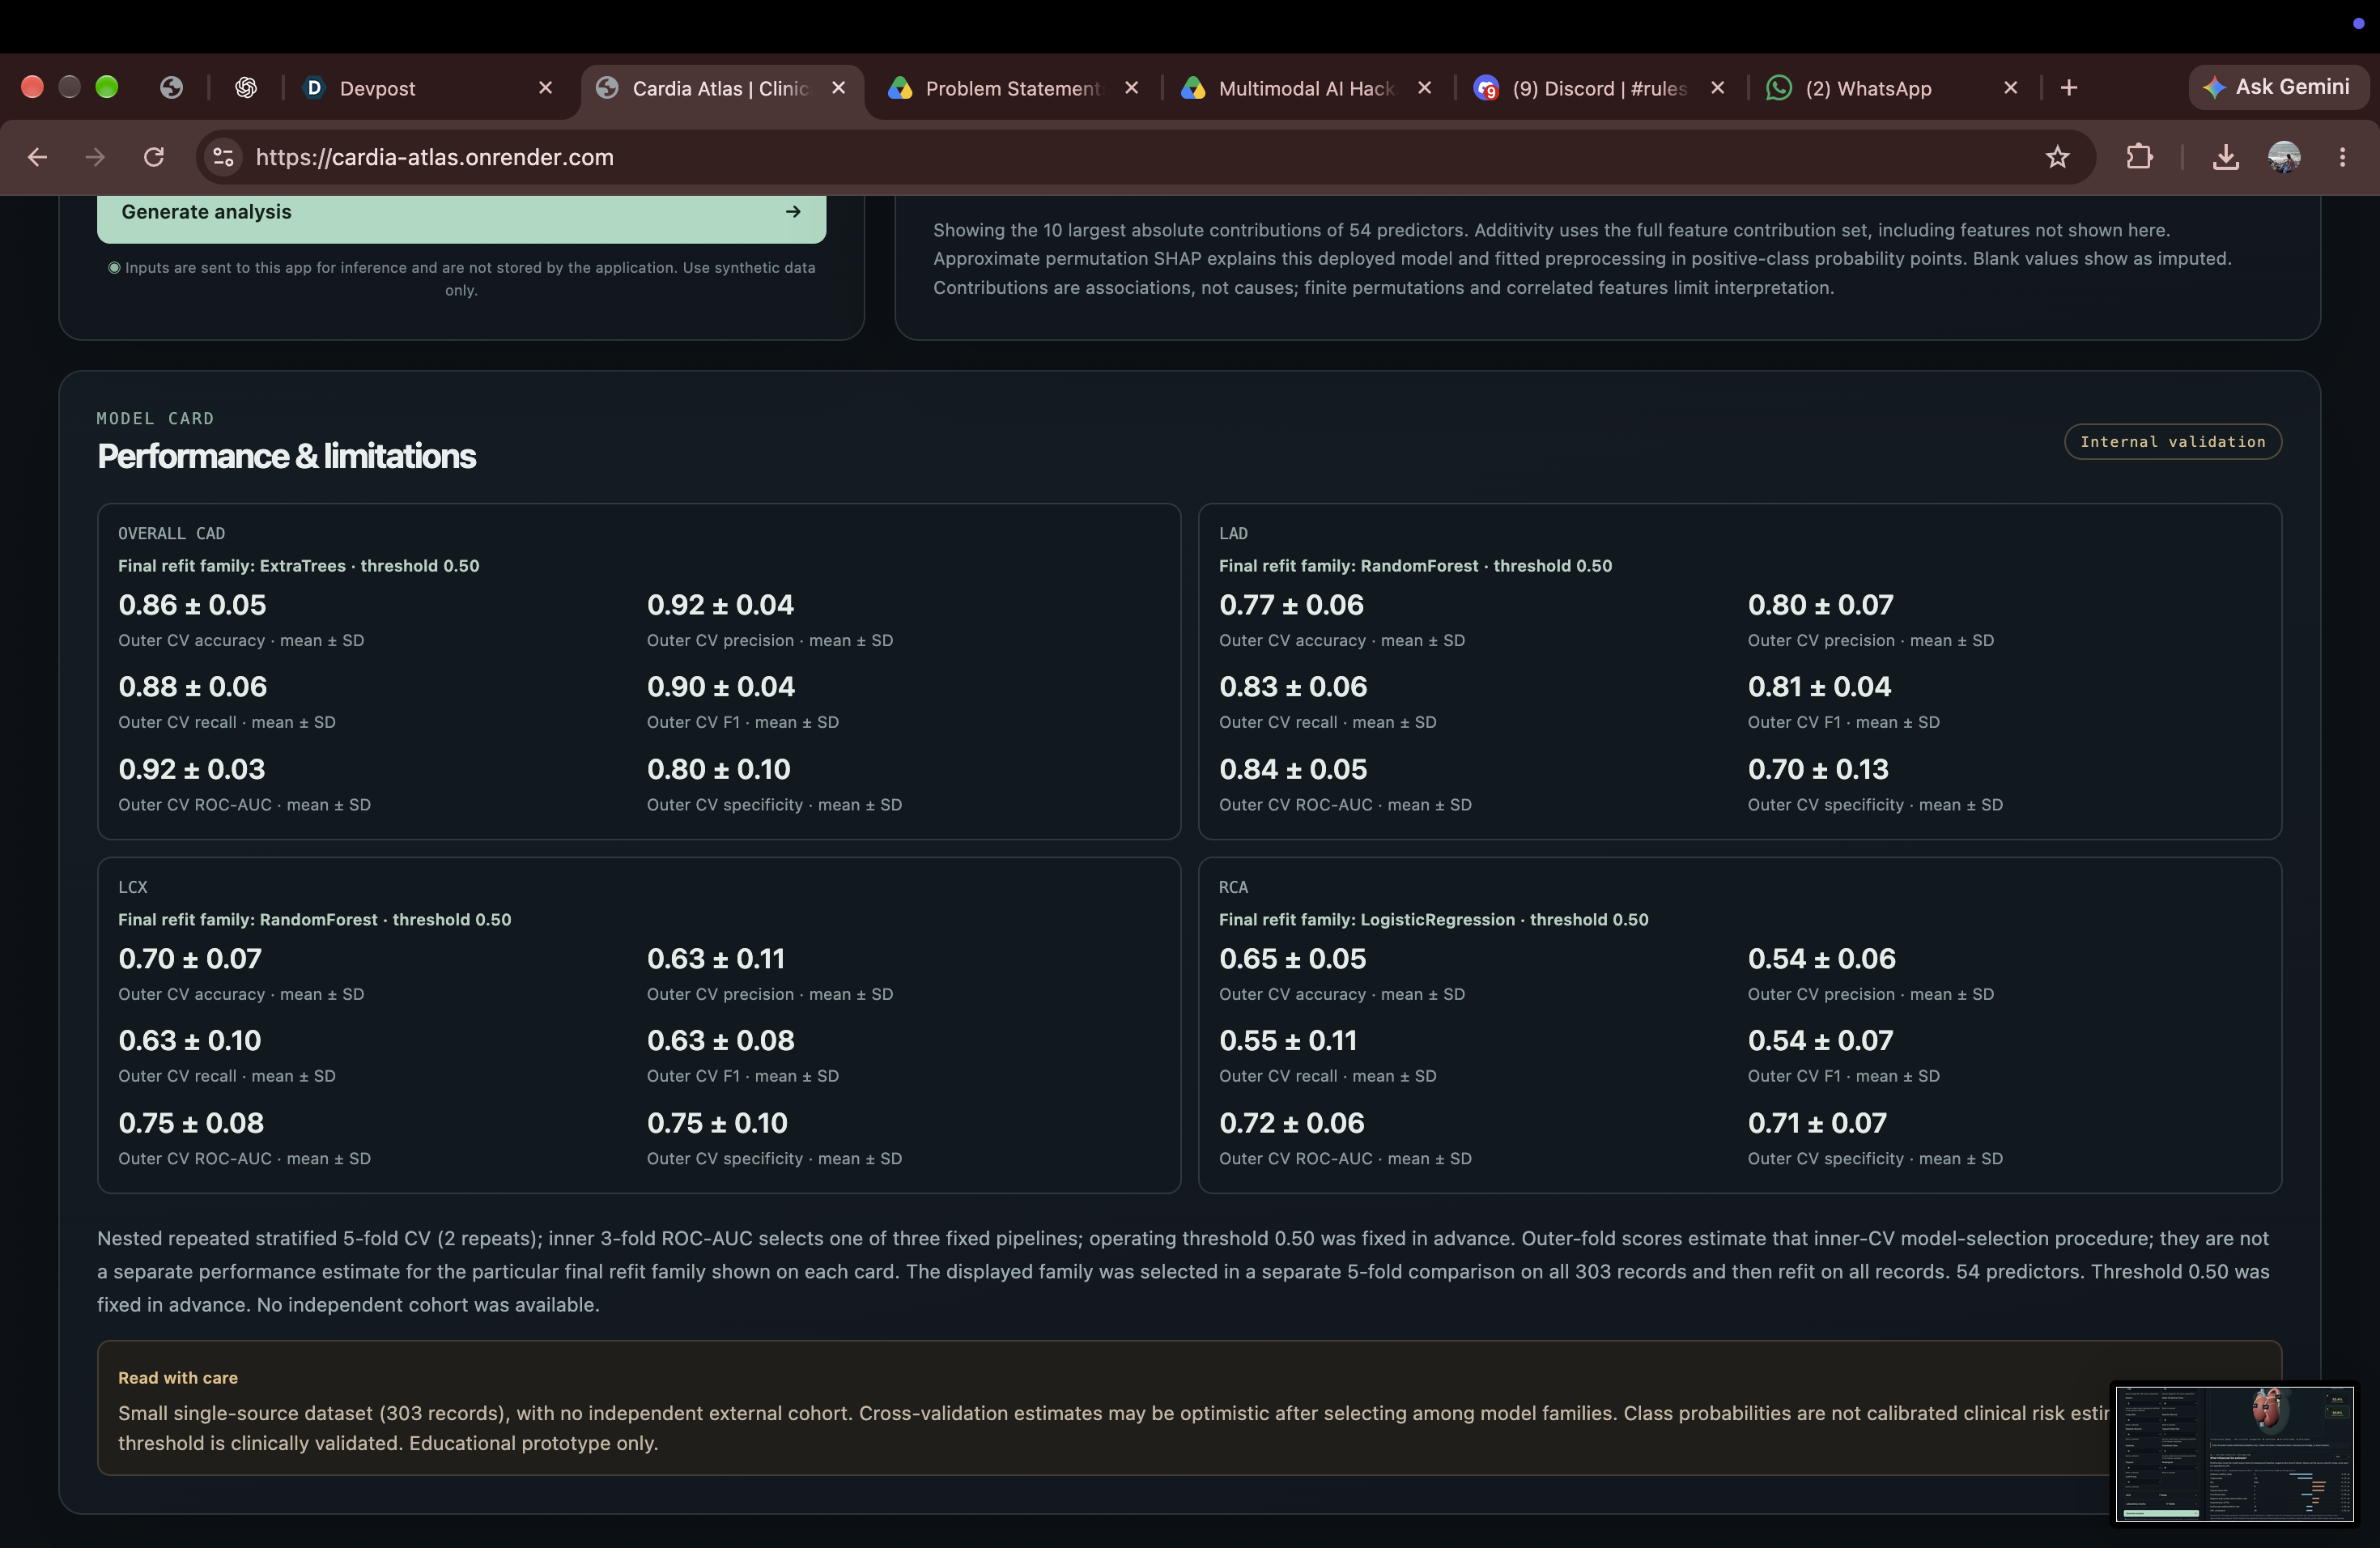
Cross-validation results for CAD, LAD, LCX and RCA, with model details and limitations.
Inspiration
I built Cardia Atlas to make coronary predictions easier to understand. A probability alone gives limited context. Seeing the related vessels and the clinical factors influencing a prediction makes the result easier to explore.
The project brings clinical data, machine learning, an interactive 3D coronary view, and patient-specific explanations into one educational dashboard.
What it does
Cardia Atlas predicts overall coronary artery disease (CAD) and stenosis in three coronary arteries: the left anterior descending artery (LAD), left circumflex artery (LCX), and right coronary artery (RCA).
It uses demographic information, medical history, ECG findings, laboratory measurements, and echocardiographic features.
The dashboard displays all four predictions alongside an interactive 3D coronary view. Users can rotate and zoom the model, select vessels, and explore colours mapped to predicted probabilities.
Patient-specific SHAP explanations show which inputs increased or decreased each model’s predicted probability. Synthetic demo values let visitors explore the application without entering real patient information.
How I built it
The backend uses Python, FastAPI, scikit-learn, and SHAP. The frontend uses HTML, CSS, JavaScript, and Three.js. The application is deployed on Render.
The models were developed using the UCI Extension of the Z-Alizadeh Sani dataset, containing 303 records. After preprocessing and removing a constant feature, 54 predictors were retained.
Cath, LAD, LCX, and RCA outcome columns were excluded from the predictors for every target to prevent target leakage.
Evaluation used five outer cross-validation folds repeated twice, with three-fold inner cross-validation for model-family selection. The final deployed models were selected through a separate five-fold comparison on the complete dataset and then refitted on all records.
The deployed model families are Extra Trees for CAD, Random Forest for LAD and LCX, and Logistic Regression for RCA. The classification threshold was fixed at 0.50.
Challenges I faced
The main challenges were preventing target leakage, evaluating models on a small dataset with uneven class distributions, and keeping predictions, vessel colours, and explanations consistent across the interface.
Communicating uncertainty was another important challenge. I reported each target separately so that the stronger CAD result would not hide weaker vessel-level performance.
Deployment also introduced practical constraints. Render’s free hosting can cause cold-start delays, and the interactive 3D view requires browser WebGL support.
Accomplishments I'm proud of
I connected four prediction targets, interactive 3D coronary visualisation, and patient-specific explanations in a working web application.
The following values are mean scores across the outer evaluation folds:
| Target | Accuracy | Precision | Recall | F1 | ROC-AUC |
|---|---|---|---|---|---|
| CAD | 0.86 | 0.92 | 0.88 | 0.90 | 0.92 |
| LAD | 0.77 | 0.80 | 0.83 | 0.81 | 0.84 |
| LCX | 0.70 | 0.63 | 0.63 | 0.63 | 0.75 |
| RCA | 0.65 | 0.54 | 0.55 | 0.54 | 0.72 |
Overall CAD achieved the strongest performance. LCX and RCA results were weaker, and those differences are reported openly.
These scores evaluate the nested model-selection procedure, rather than providing an independent test of the final deployed models. The accompanying report includes variability across folds and additional evaluation measures.
What I learned
I learned that a useful AI prototype needs more than a strong model score. Data preparation, validation, explanations, and interface design all influence how people interpret the results.
The project also reinforced why each outcome needs its own evaluation. Strong overall CAD performance does not imply equally strong predictions for every coronary artery.
What's next for Cardia Atlas
The next steps are external validation, calibration assessment, subgroup evaluation, and improving LCX and RCA performance.
I would also like to gather usability feedback from clinicians, refine the schematic heart view, and improve deployment responsiveness.
Limitations and responsible use
Cardia Atlas is an educational research prototype. It has not been externally or prospectively validated and must not be used for diagnosis, treatment decisions, or as a replacement for angiography or professional medical assessment.
Its predictions come from a small, single-source dataset and are not calibrated clinical risk estimates. No classification threshold has been clinically validated.
The 3D view is schematic, not patient-specific anatomical imaging. Predicted probabilities do not represent the percentage of blockage in an artery.
SHAP explanations describe model behaviour and associations, not causal relationships. Approximate calculations and correlated features also limit their interpretation.
AI assistance and attribution
OpenAI Codex and ChatGPT assisted with implementation, debugging, documentation, and presentation preparation.
The project uses the UCI Extension of the Z-Alizadeh Sani dataset, distributed under CC BY 4.0. Dataset attribution and open-source dependency acknowledgements are provided in the repository.
Project links
- Live application: https://cardia-atlas.onrender.com/
- Source code: https://github.com/pavitra-G16/cardia-atlas
Built With
- codex
- css
- fastapi
- html
- javascript
- numpy
- openai
- pandas
- python
- render
- scikit-learn
- shap
- three.js

Log in or sign up for Devpost to join the conversation.