
🌍 CarbonLens AI
AI-Powered Carbon Footprint Tracker for Businesses







📋 Table of Contents
- Overview
- Key Features
- System Architecture
- Tech Stack
- ML Model — Auto-Categorization
- Carbon Emission Formulas & Factors
- GHG Scope 1/2/3 Classification
- Gemini AI Integration
- Carbon Reduction Simulator
- PDF Report Generation
- Data Processing Pipeline
- API Reference
- Database Schema
- Frontend Architecture
- Project Structure
- Setup & Installation
- Sample Data
- Deployment
- Demo Flow
🌱 Overview
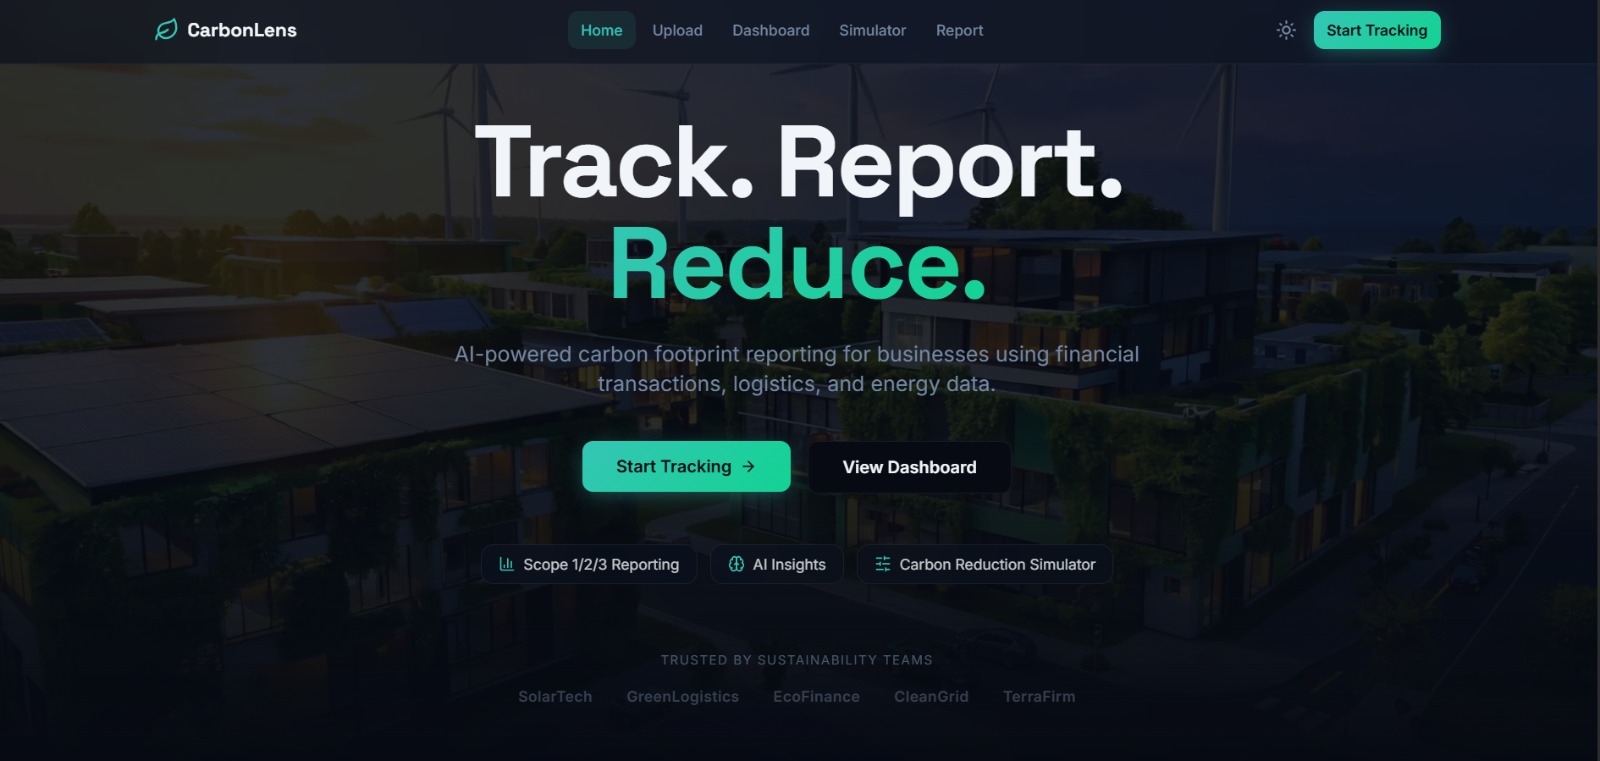
CarbonLens AI is a full-stack web application that helps businesses track, analyze, and reduce their carbon footprint. It uses machine learning to auto-categorize financial transactions into emission categories, applies scientifically-backed emission factors to calculate CO₂e, classifies emissions into GHG Protocol Scopes 1, 2, and 3, and provides AI-powered insights via Google Gemini for actionable sustainability recommendations.
Problem Statement: Businesses struggle to measure and manage carbon emissions from operations spread across energy consumption, travel, logistics, and procurement. CarbonLens AI automates this by turning raw CSV data into comprehensive carbon intelligence.
🚀 Key Features
| # | Feature | Description |
|---|---|---|
| 1 | AI Auto-Categorization | ML model (TF-IDF + Logistic Regression) classifies transaction descriptions into 5 emission categories |
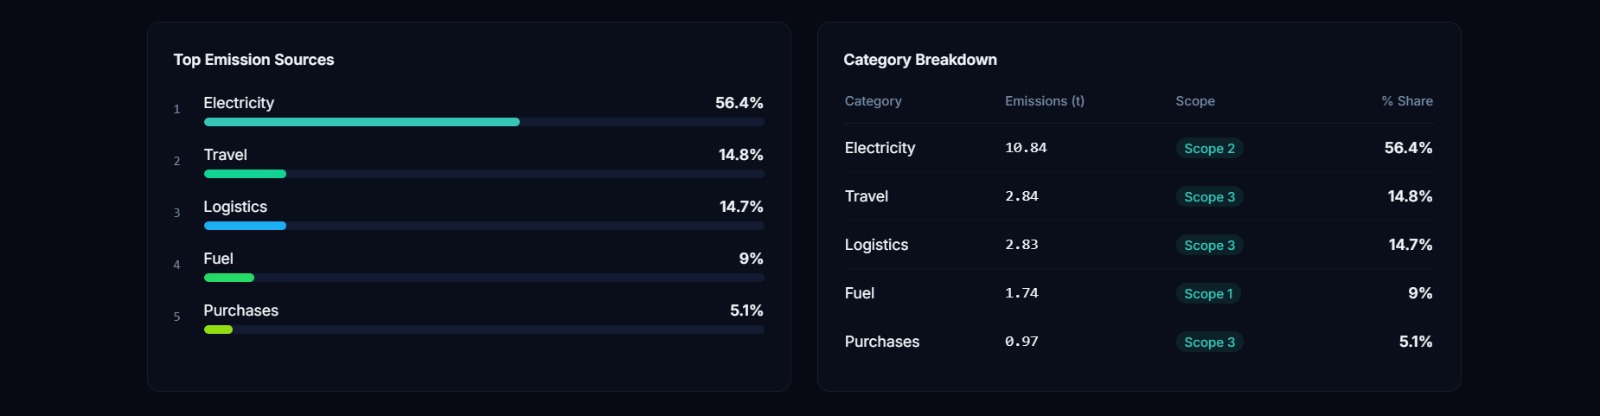
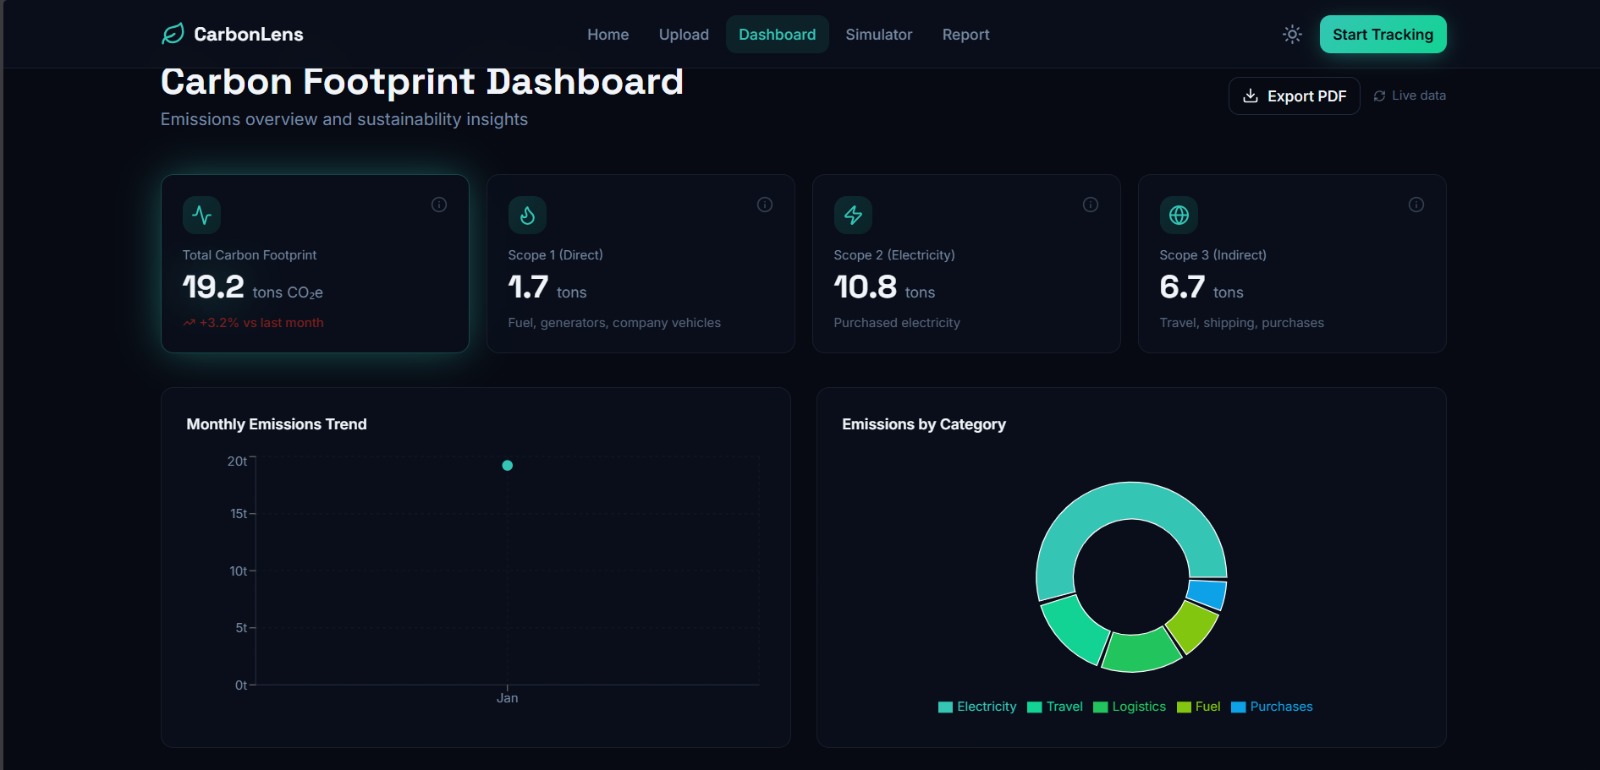
| 2 | Scope 1/2/3 Dashboard | Interactive dashboard with charts showing total emissions, scope breakdown, category trends, and top sources |
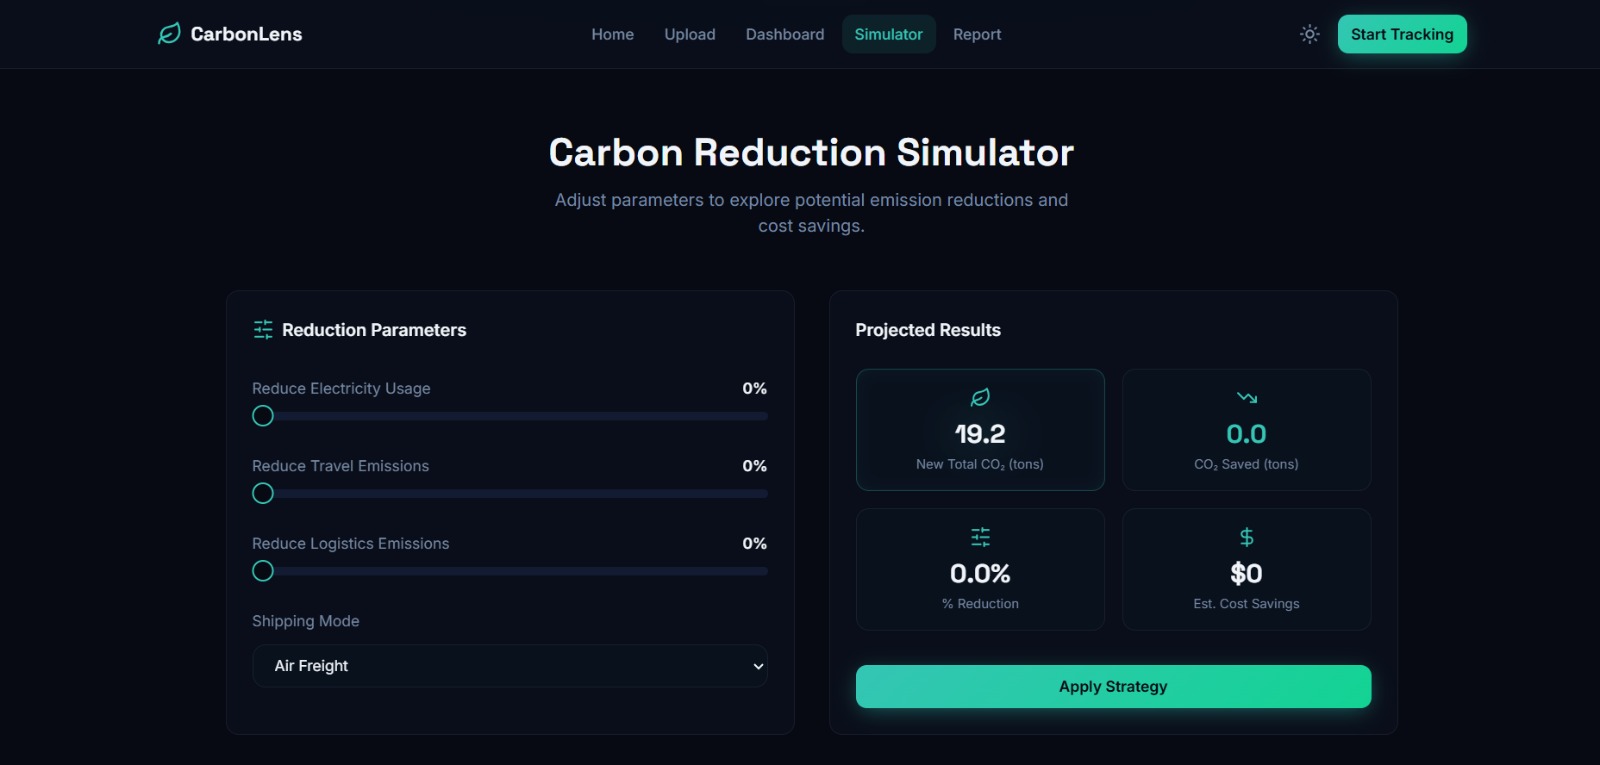
| 3 | Carbon Reduction Simulator | Users slide reduction percentages and switch shipping modes to see projected CO₂ savings + cost savings |
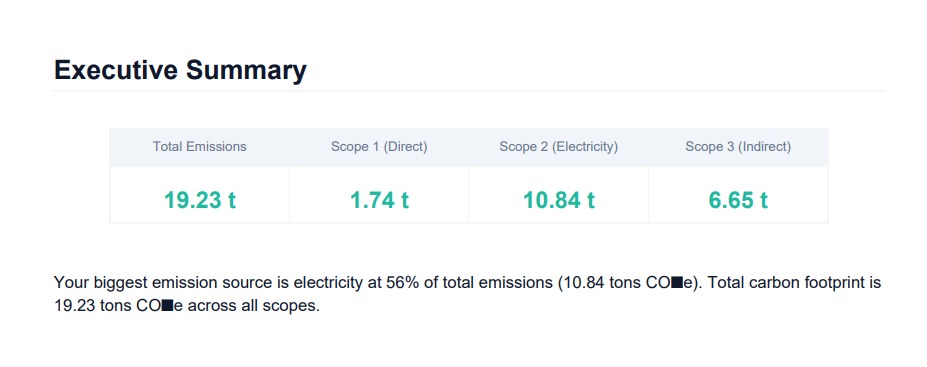
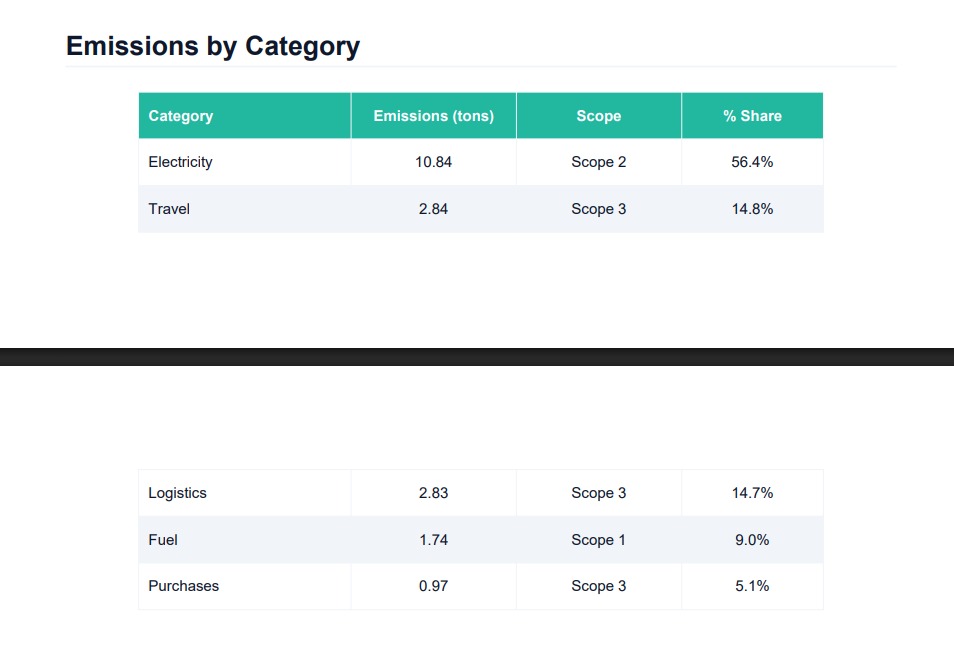
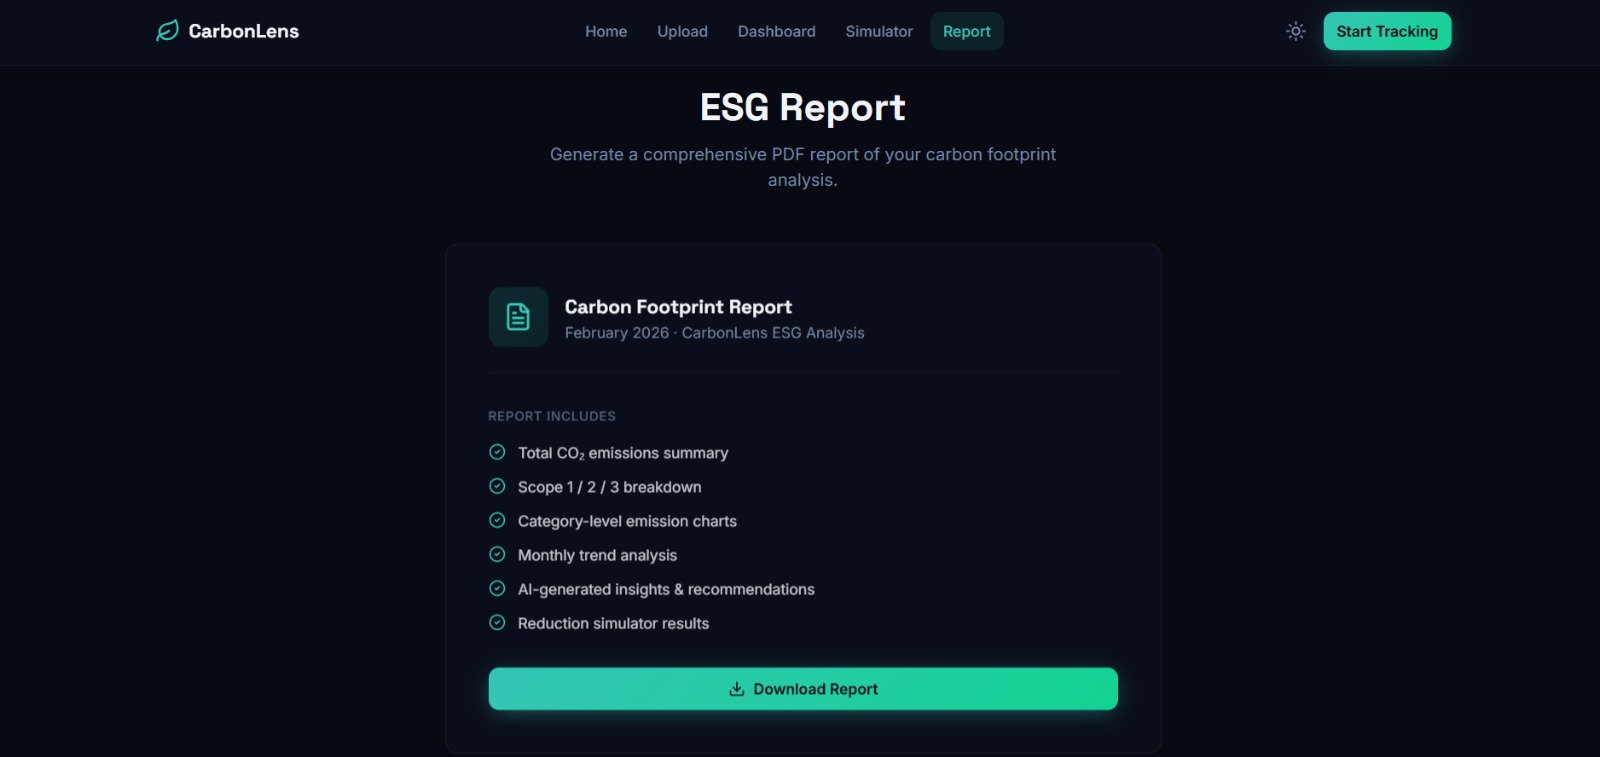
| 4 | PDF ESG Report Generator | Professional branded PDF report with KPIs, breakdowns, scope analysis, and AI recommendations |
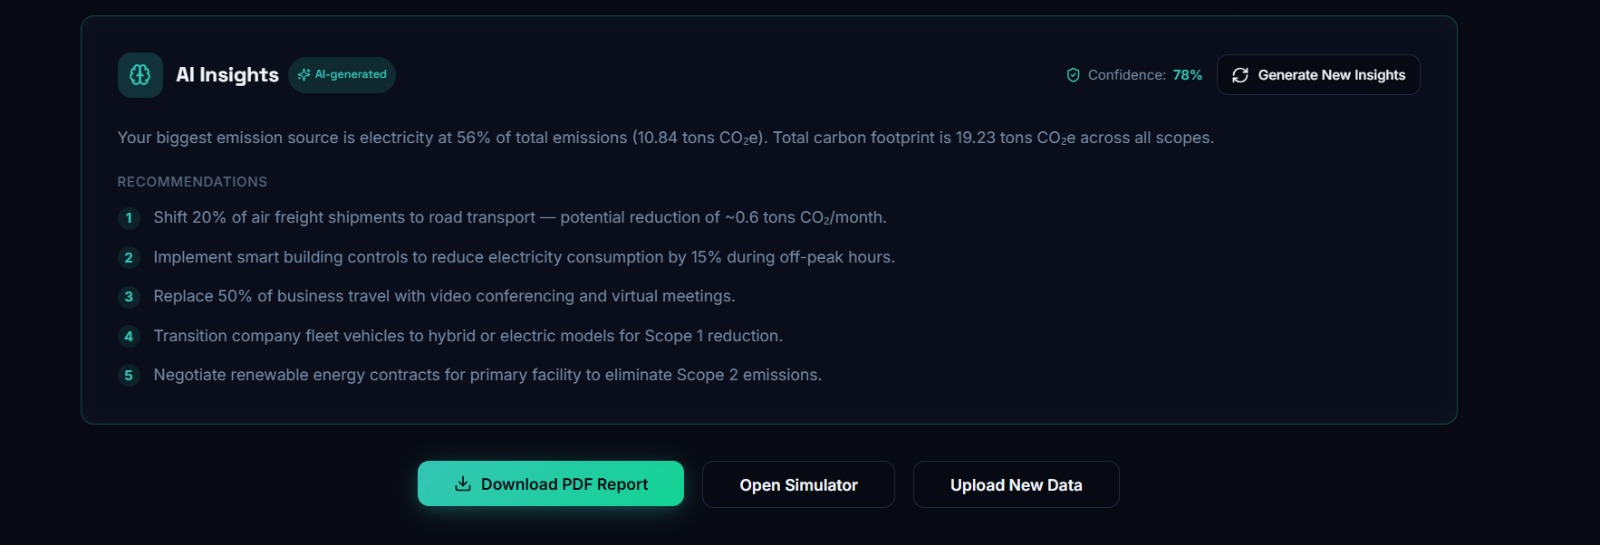
| 5 | AI Recommendations (Gemini) | Google Gemini 2.0 Flash analyzes emission data and generates executive summaries + 5 actionable reduction recommendations |
🏗 System Architecture
┌──────────────────────────────────────────────────────────────────────┐
│                        FRONTEND (React + Vite)                       │
│                                                                      │
│  ┌──────────┐ ┌──────────┐ ┌───────────┐ ┌──────────┐ ┌──────────┐ │
│  │  Upload   │ │Dashboard │ │ Simulator │ │ Insights │ │  Report  │ │
│  │  Section  │ │ Section  │ │  Section  │ │   Card   │ │ Section  │ │
│  └────┬─────┘ └────┬─────┘ └─────┬─────┘ └────┬─────┘ └────┬─────┘ │
│       │             │             │             │             │       │
│       └─────────────┴─────────────┴─────────────┴─────────────┘       │
│                               │  API Client (fetch)                   │
│                      /api proxy (Vite → :8000)                       │
└──────────────────────────────────┬───────────────────────────────────┘
                                   │
                                   ▼
┌──────────────────────────────────────────────────────────────────────┐
│                      BACKEND (FastAPI + Python)                      │
│                                                                      │
│  ┌─────────────────────────────────────────────────────────────────┐ │
│  │                         API Routes                              │ │
│  │  /upload  /process  /dashboard  /insights  /simulator  /report  │ │
│  └──────┬──────────┬──────────┬──────────┬──────────┬──────────┬───┘ │
│         │          │          │          │          │          │      │
│  ┌──────▼──────────▼──────────▼──────────▼──────────▼──────────▼───┐ │
│  │                       SERVICES LAYER                            │ │
│  │                                                                 │ │
│  │  File      Preprocessing   Categorization   Carbon Calc         │ │
│  │  Service   Service         Service (ML)     Service             │ │
│  │                                                                 │ │
│  │  Scope     Insights        PDF                                  │ │
│  │  Service   Service         Service                              │ │
│  │            (Gemini AI)     (ReportLab)                          │ │
│  └──────┬──────────┬──────────┬────────────────────────────────────┘ │
│         │          │          │                                      │
│  ┌──────▼──────────▼──────────▼────────────────────────────────────┐ │
│  │            SQLite Database (SQLAlchemy ORM)                     │ │
│  │  upload_sessions │ processed_emissions │ dashboard_summaries    │ │
│  │  insight_records                                                │ │
│  └─────────────────────────────────────────────────────────────────┘ │
│                                                                      │
│  ┌──────────────────┐  ┌───────────────────────────────────────────┐ │
│  │   ML Model        │  │   External APIs                          │ │
│  │  TF-IDF +         │  │   Google Gemini 2.0 Flash                │ │
│  │  Logistic Regr.   │  │   (AI Insights & Recommendations)       │ │
│  └──────────────────┘  └───────────────────────────────────────────┘ │
└──────────────────────────────────────────────────────────────────────┘
🛠 Tech Stack
Backend
| Technology | Version | Purpose |
|---|---|---|
| Python | 3.12 | Core programming language |
| FastAPI | 0.115.0 | High-performance async web framework |
| Uvicorn | 0.30.6 | ASGI server with hot reload |
| SQLAlchemy | 2.0.32 | ORM for database operations |
| SQLite | — | Lightweight embedded database |
| pandas | 2.2.2 | DataFrame-based data processing |
| scikit-learn | 1.5.1 | ML model training & inference |
| joblib | 1.4.2 | Model serialization (.joblib) |
| ReportLab | 4.2.2 | PDF generation engine |
| google-generativeai | 0.7.2 | Gemini API SDK |
| Pydantic | 2.9.1 | Request/response data validation |
| pydantic-settings | 2.5.2 | Environment config management |
| python-multipart | 0.0.9 | File upload handling |
| matplotlib | 3.9.2 | Chart rendering |
Frontend
| Technology | Version | Purpose |
|---|---|---|
| React | 18.3.1 | UI component library |
| TypeScript | 5.8.3 | Type-safe JavaScript |
| Vite | 5.4.19 | Build tool & dev server |
| TailwindCSS | 3.4.17 | Utility-first CSS framework |
| shadcn/ui | — | Radix-based UI component system |
| Recharts | 2.15.4 | React charting library |
| Framer Motion | 12.33.0 | Animation library |
| TanStack React Query | 5.83 | Server state management |
| React Router DOM | 6.30 | Client-side routing |
| Lucide React | — | Icon library |
| next-themes | — | Dark/light mode toggle |
| Zod | 3.25 | Schema validation |
| Sonner | — | Toast notifications |
| Vitest | 3.2 | Unit testing framework |
🤖 ML Model — Auto-Categorization
Algorithm
CarbonLens AI uses a two-stage classification pipeline to categorize business transactions into emission categories:
Stage 1: TF-IDF Vectorization → Stage 2: Logistic Regression → Category
Stage 1 — TF-IDF (Term Frequency–Inverse Document Frequency) Vectorizer
Converts text descriptions into numerical feature vectors.
Formula:
$$\text{TF-IDF}(t, d) = \text{TF}(t, d) \times \text{IDF}(t)$$
Where:
$$\text{TF}(t, d) = \frac{\text{count of term } t \text{ in document } d}{\text{total terms in } d}$$
$$\text{IDF}(t) = \log\left(\frac{N}{1 + \text{df}(t)}\right) + 1$$
- $N$ = total number of documents
- $\text{df}(t)$ = number of documents containing term $t$
Configuration:
| Parameter | Value | Description |
|---|---|---|
max_features |
500 | Maximum vocabulary size |
ngram_range |
(1, 2) | Uses both unigrams and bigrams |
stop_words |
"english" |
Removes common English words |
Stage 2 — Logistic Regression Classifier
Multi-class classifier with softmax output.
Decision function:
$$P(y = k \mid x) = \frac{e^{w_k^T x + b_k}}{\sum_{j=1}^{K} e^{w_j^T x + b_j}}$$
Where $w_k$ = weight vector for class $k$, $x$ = TF-IDF feature vector, $K$ = 5 categories.
Configuration:
| Parameter | Value | Description |
|---|---|---|
max_iter |
1000 | Maximum optimization iterations |
C |
1.0 | Inverse regularization strength |
class_weight |
"balanced" |
Adjusts weights inversely proportional to class frequency |
random_state |
42 | Reproducibility seed |
solver |
lbfgs |
Default — Limited-memory BFGS optimizer |
Validation: 3-fold stratified cross-validation
Training Data
- File:
data/training_categories.csv - Samples: 62 labeled transaction descriptions
- 5 Categories: electricity (10), fuel (10), travel (12), logistics (16), purchases (14)
Categorization Fallbacks
Input Description
    │
    ├─ Has 'category' column? ──► Use existing (validate against known categories)
    │
    ├─ ML model available? ──► TF-IDF transform → Logistic Regression predict
    │
    ├─ Keyword matching ──► Score description against keyword dictionaries
    │                        Pick category with highest keyword overlap
    │
    └─ Default ──► "purchases"
Keyword dictionaries (from constants.py):
| Category | Keywords |
|---|---|
| electricity | electric, power, grid, kwh, utility, energy bill |
| fuel | diesel, petrol, gasoline, gas, lpg, fuel, propane |
| travel | flight, airline, train, bus, taxi, uber, hotel, travel |
| logistics | shipping, freight, courier, fedex, ups, dhl, cargo, delivery |
| purchases | office, supplies, equipment, furniture, software, purchase, IT, food |
🧮 Carbon Emission Formulas & Factors
Emission Factors (kg CO₂e per unit)
All factors are based on internationally recognized standards (DEFRA, IEA, EPA).
Energy & Fuel
| Source | Factor | Unit |
|---|---|---|
| Grid Electricity | 0.417 | kg CO₂e / kWh |
| Diesel | 2.68 | kg CO₂e / litre |
| Petrol / Gasoline | 2.31 | kg CO₂e / litre |
| Natural Gas | 2.04 | kg CO₂e / m³ |
| LPG | 1.51 | kg CO₂e / litre |
Travel (Passenger Transport)
| Mode | Factor | Unit |
|---|---|---|
| Flight (Economy) | 0.255 | kg CO₂e / passenger-km |
| Car / Taxi | 0.171 | kg CO₂e / passenger-km |
| Bus | 0.089 | kg CO₂e / passenger-km |
| Train | 0.041 | kg CO₂e / passenger-km |
Logistics (Freight Transport)
| Mode | Factor | Unit |
|---|---|---|
| Air Freight | 0.602 | kg CO₂e / tonne-km |
| Road Freight | 0.096 | kg CO₂e / tonne-km |
| Rail Freight | 0.028 | kg CO₂e / tonne-km |
| Sea Freight | 0.016 | kg CO₂e / tonne-km |
Purchased Goods & Services (Economic Input-Output)
| Type | Factor | Unit |
|---|---|---|
| Office Supplies | 0.50 | kg CO₂e / $ |
| IT Equipment | 0.80 | kg CO₂e / $ |
| Food & Catering | 0.90 | kg CO₂e / $ |
| Professional Services | 0.30 | kg CO₂e / $ |
Calculation Formulas
1. Transaction-Based ($ → estimated CO₂e)
When only dollar amounts are available, unit costs are estimated to derive physical quantities:
| Category | Formula |
|---|---|
| Electricity | $\text{kWh} = \frac{\text{amount}}{\$0.12/\text{kWh}}$, then $\text{CO₂e} = \text{kWh} \times 0.417$ |
| Fuel | $\text{litres} = \frac{\text{amount}}{\$1.50/\text{litre}}$, then $\text{CO₂e} = \text{litres} \times 2.31$ |
| Travel | $\text{km} = \frac{\text{amount}}{\$0.30/\text{km}}$, then $\text{CO₂e} = \text{km} \times 0.171$ |
| Logistics | $\text{tonne-km} = \frac{\text{amount}}{\$0.50/\text{tonne-km}}$, then $\text{CO₂e} = \text{tonne-km} \times 0.096$ |
| Purchases | $\text{CO₂e} = \text{amount} \times 0.50$ |
2. Energy-Based (Direct Measurement)
$$\text{CO₂e (kg)} = \text{consumption (kWh or litres)} \times \text{emission factor}$$
3. Logistics-Based (Distance × Weight)
$$\text{CO₂e (kg)} = \text{distance (km)} \times \frac{\text{weight (kg)}}{1000} \times \text{mode factor}$$
Unit Conversion
$$\text{CO₂e (tonnes)} = \frac{\text{CO₂e (kg)}}{1000}$$
🎯 GHG Scope 1/2/3 Classification
Follows the GHG Protocol Corporate Standard — the most widely used greenhouse gas accounting framework.
┌─────────────────────────────────────────────────────────────┐
│                    GHG Protocol Scopes                       │
│                                                             │
│  ┌─────────────┐  ┌─────────────┐  ┌─────────────────────┐ │
│  │  SCOPE 1    │  │  SCOPE 2    │  │      SCOPE 3        │ │
│  │  Direct     │  │  Indirect   │  │  Value Chain         │ │
│  │  Emissions  │  │  (Energy)   │  │  (Other Indirect)   │ │
│  │             │  │             │  │                     │ │
│  │  • Fuel     │  │  • Elec-    │  │  • Travel           │ │
│  │  combustion │  │    tricity  │  │  • Logistics        │ │
│  │  (company-  │  │  (purchased │  │  • Purchases        │ │
│  │   owned)    │  │   grid)     │  │  (goods & services) │ │
│  └─────────────┘  └─────────────┘  └─────────────────────┘ │
└─────────────────────────────────────────────────────────────┘
| Category | Scope | Label | Rationale |
|---|---|---|---|
| Fuel | Scope 1 | Direct Emissions | Company-owned vehicle/equipment combustion |
| Electricity | Scope 2 | Energy Indirect | Purchased electricity from the grid |
| Travel | Scope 3 | Other Indirect | Employee business travel |
| Logistics | Scope 3 | Other Indirect | Upstream/downstream transportation |
| Purchases | Scope 3 | Other Indirect | Purchased goods and services |
Assignment Logic:
SCOPE_MAPPING = {
    "fuel": 1,
    "electricity": 2,
    "travel": 3,
    "logistics": 3,
    "purchases": 3,
}
df["scope"] = df["category"].map(SCOPE_MAPPING).fillna(3)
🧠 Gemini AI Integration
Model
Google Gemini 2.0 Flash — fast, multimodal large language model optimized for quick responses.
How It Works
- Data aggregation — Total emissions, scope breakdown (%), and category percentages are computed from the processed emissions table
- Prompt engineering — A structured prompt is built with all emission data:
You are a sustainability expert analyzing carbon footprint data.

Total Emissions: {total} tonnes CO₂e
Scope Breakdown: Scope 1: {s1}%, Scope 2: {s2}%, Scope 3: {s3}%
Category Breakdown: Electricity: {e}%, Fuel: {f}%, Travel: {t}%, ...

Provide:
SUMMARY: 2-3 sentence executive summary of carbon performance
RECOMMENDATIONS:
1. [recommendation with estimated CO₂ reduction]
2. ...
(5 total actionable recommendations)
- Response parsing — Extracts
SUMMARY:andRECOMMENDATIONS:sections from Gemini response - Persistence — Results saved to
insight_recordsDB table with confidence score
Confidence Scores
| Source | Confidence |
|---|---|
| Gemini AI response | 0.92 |
| Rule-based fallback | 0.78 |
Fallback System
When Gemini API key is missing or API call fails, a rule-based insights engine activates:
- Identifies the top emission category (highest %)
- Generates category-specific recommendations (e.g., "Switch to renewable energy" for electricity-heavy profiles)
- Estimates tonnage reductions proportional to actual emissions
- Always returns valid response — system never fails silently
📊 Carbon Reduction Simulator
Input Parameters
| Parameter | Type | Range | Default |
|---|---|---|---|
electricity_reduction |
percentage | 0–100% | 0% |
travel_reduction |
percentage | 0–100% | 0% |
logistics_reduction |
percentage | 0–100% | 0% |
shipping_mode |
enum | sea / road / air | air |
Calculation Logic
Shipping mode multipliers (applied to logistics emissions):
| Mode | Multiplier | Rationale |
|---|---|---|
| Sea | 0.70 | Sea freight has 97% lower emissions than air |
| Road | 0.85 | Moderate reduction vs. air freight |
| Air | 1.00 | Baseline (no reduction) |
Per-category calculation:
$$\text{New Emissions}{\text{cat}} = \text{Original}{\text{cat}} \times \left(1 - \frac{\text{reduction\%}}{100}\right) \times \text{mode multiplier (if logistics)}$$
Cost savings estimate:
$$\text{Cost Savings} = \text{CO₂ Saved (tonnes)} \times \$850$$
Where $850/tonne is based on voluntary carbon credit market estimates.
📄 PDF Report Generation
Engine
ReportLab (Python PDF library) generating A4 pages.
Brand Design
| Element | Value |
|---|---|
| Primary color | #22b8a0 (Teal) |
| Dark color | #0f172a (Slate 900) |
| Font | Helvetica |
Report Sections
- Title Block — CarbonLens AI logo, company name, generation date
- KPI Summary Table — Total emissions, Scope 1, Scope 2, Scope 3 (in tonnes CO₂e)
- Executive Summary — AI-generated summary from Gemini
- Category Breakdown Table — Emissions per category with percentages
- GHG Scope Breakdown — Scope 1/2/3 with descriptions per GHG Protocol
- AI Recommendations — 5 actionable recommendations with estimated reductions
- Footer — "Report generated by CarbonLens AI"
Output
reports/CarbonLens_Report_{session_id}_{YYYY-MM-DD}.pdf
⚙️ Data Processing Pipeline
End-to-end flow when user clicks "Process Data":
Step 1: PREPROCESSING
    ├── Transactions CSV → Normalize columns, strip $ signs, lowercase descriptions
    ├── Energy CSV → Map column aliases, infer units (kWh/litres)
    └── Logistics CSV → Map aliases, convert weight_tons → weight_kg (×1000)

Step 2: ML CATEGORIZATION (Transactions only)
    ├── If 'category' column exists → Validate & normalize
    ├── Elif ML model loaded → TF-IDF transform → LogisticRegression predict
    ├── Elif keyword match found → Pick highest-scoring category
    └── Else → Default to "purchases"

Step 3: EMISSION CALCULATION
    ├── Transactions → $ amount ÷ unit_cost → physical units → × emission factor
    ├── Energy → Direct amount × emission factor
    └── Logistics → distance × (weight/1000) × mode factor

Step 4: SCOPE ASSIGNMENT
    └── fuel→1, electricity→2, travel/logistics/purchases→3

Step 5: DATABASE STORAGE
    ├── Save each row to processed_emissions table
    └── Aggregate totals → Save to dashboard_summaries table

Step 6: RESPONSE
    └── Return total emissions, scope breakdown, category breakdown, monthly trends
📡 API Reference
Base URL: http://localhost:8000/api
| Method | Endpoint | Description | Request | Response |
|---|---|---|---|---|
GET |
/health |
Health check | — | {status, service, version} |
POST |
/upload/transactions |
Upload transactions CSV | multipart/form-data (file) |
{session_id, filename, rows} |
POST |
/upload/energy |
Upload energy CSV | multipart/form-data (file) |
{session_id, filename, rows} |
POST |
/upload/logistics |
Upload logistics CSV | multipart/form-data (file) |
{session_id, filename, rows} |
GET |
/upload/status/{session_id} |
Check upload status | — | {session_id, files: {...}} |
POST |
/process?session_id= |
Run full processing pipeline | query param | {total_emissions, scopes, categories} |
GET |
/dashboard/{session_id} |
Get dashboard data | — | {total, scopes, categories, trends, top_sources} |
POST |
/insights |
Generate AI insights | {session_id} |
{summary, recommendations[], confidence} |
POST |
/simulator |
Run reduction simulation | {session_id, reductions} |
{original, new_total, saved, cost_savings} |
GET |
/report/pdf/{session_id} |
Download PDF report | — | PDF file stream |
Interactive API Docs: http://localhost:8000/docs (Swagger UI)
🗄 Database Schema
Engine: SQLite via SQLAlchemy 2.0 ORM
Tables
upload_sessions
| Column | Type | Description |
|---|---|---|
| id | Integer (PK) | Auto-increment |
| session_id | String (unique, indexed) | UUID-format session identifier |
| created_at | DateTime | Upload timestamp |
| transactions_file | String (nullable) | Transactions CSV filename |
| energy_file | String (nullable) | Energy CSV filename |
| logistics_file | String (nullable) | Logistics CSV filename |
| status | String | "pending" or "processed" |
processed_emissions
| Column | Type | Description |
|---|---|---|
| id | Integer (PK) | Auto-increment |
| session_id | String (indexed) | Links to upload session |
| category | String | electricity / fuel / travel / logistics / purchases |
| scope | Integer | 1, 2, or 3 |
| description | String | Original transaction description |
| amount | Float | Original monetary or physical amount |
| unit | String | kWh, litres, km, $, etc. |
| emissions_kg | Float | Calculated CO₂e in kilograms |
| emissions_tons | Float | Calculated CO₂e in metric tonnes |
| source_file | String | Which CSV file this row came from |
| created_at | DateTime | Processing timestamp |
dashboard_summaries
| Column | Type | Description |
|---|---|---|
| id | Integer (PK) | Auto-increment |
| session_id | String (unique) | Links to session |
| total_emissions_tons | Float | Sum of all emissions |
| scope1_tons | Float | Scope 1 total |
| scope2_tons | Float | Scope 2 total |
| scope3_tons | Float | Scope 3 total |
| category_breakdown | JSON | {category: tonnes} dict |
| monthly_trend | JSON | [{month, emissions}] array |
| top_sources | JSON | Top emission sources list |
| created_at | DateTime | Aggregation timestamp |
insight_records
| Column | Type | Description |
|---|---|---|
| id | Integer (PK) | Auto-increment |
| session_id | String (indexed) | Links to session |
| summary | Text | AI-generated executive summary |
| recommendations | JSON | Array of recommendation strings |
| confidence | Float | 0.0–1.0 confidence score |
| created_at | DateTime | Generation timestamp |
🎨 Frontend Architecture
Component Hierarchy
App.tsx
├── ThemeProvider (dark mode default)
├── QueryClientProvider (TanStack)
├── SessionProvider (useSession context)
├── TooltipProvider (Radix)
└── BrowserRouter
    └── Index.tsx
        ├── Navbar
        ├── HeroSection
        ├── UploadSection
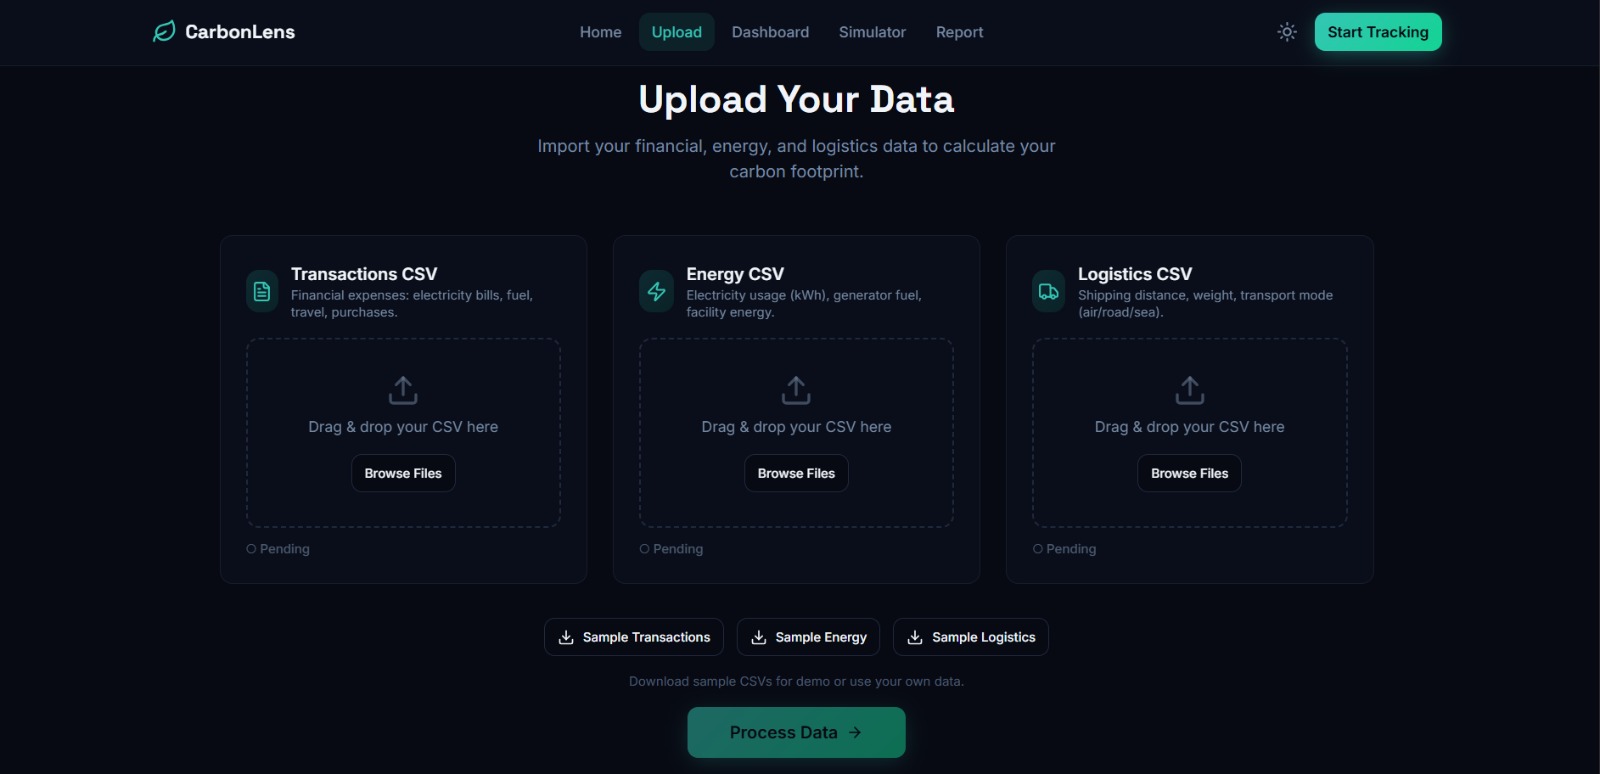
        │   ├── UploadCard (Transactions)
        │   ├── UploadCard (Energy)
        │   └── UploadCard (Logistics)
        │   └── Process Data Button
        ├── DashboardSection
        │   ├── KPICard (Total Emissions)
        │   ├── KPICard (Scope 1)
        │   ├── KPICard (Scope 2)
        │   ├── KPICard (Scope 3)
        │   ├── EmissionsCharts
        │   │   ├── AreaChart (Monthly Trend)
        │   │   └── PieChart (Category Split)
        │   └── BreakdownSection
        │       └── Top Sources Table
        ├── AIInsightsCard
        │   ├── Executive Summary
        │   └── Recommendations List
        ├── SimulatorSection
        │   ├── Sliders (electricity, travel, logistics %)
        │   ├── Shipping Mode Selector
        │   └── Results (saved, cost, % reduction)
        ├── ReportSection
        │   └── Download PDF Button
        └── Footer
Session State (React Context)
interface SessionState {
  sessionId: string | null;
  uploads: {
    transactions: { file: File | null; uploaded: boolean; rows: number };
    energy: { file: File | null; uploaded: boolean; rows: number };
    logistics: { file: File | null; uploaded: boolean; rows: number };
  };
  isProcessed: boolean;
  dashboardData: DashboardData | null;
  insightsData: InsightsData | null;
  isProcessing: boolean;
  reset: () => void;
}
📁 Project Structure
CarbonLens AI/
│
├── README.md                          # This file
├── .gitignore                         # Git ignore rules
│
├── backend/                           # Python FastAPI Backend
│   ├── app/
│   │   ├── __init__.py
│   │   ├── main.py                    # FastAPI app factory & router registration
│   │   ├── ml_train.py                # ML model training script
│   │   │
│   │   ├── core/
│   │   │   ├── config.py              # Pydantic settings (.env loader)
│   │   │   ├── cors.py                # CORS middleware setup
│   │   │   └── database.py            # SQLAlchemy engine, session, Base
│   │   │
│   │   ├── models/
│   │   │   └── db_models.py           # SQLAlchemy ORM models (4 tables)
│   │   │
│   │   ├── schemas/
│   │   │   ├── upload_schemas.py      # Upload request/response schemas
│   │   │   ├── dashboard_schemas.py   # Dashboard data schemas
│   │   │   └── insights_schemas.py    # Insights & simulator schemas
│   │   │
│   │   ├── services/
│   │   │   ├── file_service.py        # File upload/read management
│   │   │   ├── preprocessing_service.py  # CSV cleaning & normalization
│   │   │   ├── categorization_service.py # ML + keyword categorization
│   │   │   ├── carbon_calc_service.py    # Emission calculation engine
│   │   │   ├── scope_service.py          # GHG scope assignment
│   │   │   ├── insights_service.py       # Gemini AI integration
│   │   │   └── pdf_service.py            # PDF report generator
│   │   │
│   │   ├── api/routes/
│   │   │   ├── health.py              # GET /api/health
│   │   │   ├── upload.py              # POST /api/upload/{type}
│   │   │   ├── process.py             # POST /api/process
│   │   │   ├── dashboard.py           # GET /api/dashboard/{session_id}
│   │   │   ├── insights.py            # POST /api/insights & /api/simulator
│   │   │   └── report.py              # GET /api/report/pdf/{session_id}
│   │   │
│   │   └── utils/
│   │       ├── constants.py           # Emission factors, scope mappings, keywords
│   │       └── helpers.py             # Utility functions
│   │
│   ├── data/
│   │   ├── sample_transactions.csv    # 32 sample transaction rows
│   │   ├── sample_energy.csv          # 12 sample energy readings
│   │   ├── sample_logistics.csv       # 15 sample shipment records
│   │   └── training_categories.csv    # 62 labeled samples for ML training
│   │
│   ├── ml/                            # Generated ML artifacts
│   │   ├── model.joblib               # Trained Logistic Regression model
│   │   └── vectorizer.joblib          # Fitted TF-IDF vectorizer
│   │
│   ├── uploads/                       # Runtime: uploaded CSV files
│   ├── reports/                       # Runtime: generated PDF reports
│   ├── requirements.txt               # Python dependencies
│   ├── .env                           # Environment variables (not in git)
│   └── .env.example                   # Example env template
│
└── frontend/                          # React + TypeScript Frontend
    ├── src/
    │   ├── App.tsx                     # Root app with providers
    │   ├── main.tsx                    # React entry point
    │   ├── index.css                   # Global styles + Tailwind
    │   │
    │   ├── components/
    │   │   ├── Navbar.tsx              # Navigation bar
    │   │   ├── HeroSection.tsx         # Landing hero section
    │   │   ├── UploadSection.tsx       # CSV upload + process trigger
    │   │   ├── DashboardSection.tsx    # KPIs + charts + breakdown
    │   │   ├── EmissionsCharts.tsx     # Area chart + pie chart
    │   │   ├── BreakdownSection.tsx    # Top sources table
    │   │   ├── KPICard.tsx             # Single KPI display card
    │   │   ├── AIInsightsCard.tsx      # AI summary + recommendations
    │   │   ├── SimulatorSection.tsx    # Carbon reduction simulator
    │   │   ├── ReportSection.tsx       # PDF download section
    │   │   ├── Footer.tsx             # Page footer
    │   │   └── ui/                    # 40+ shadcn/ui components
    │   │
    │   ├── hooks/
    │   │   ├── useSession.tsx          # Session context + state
    │   │   ├── useScrollSpy.ts         # Scroll-aware navigation
    │   │   └── use-mobile.tsx          # Mobile detection hook
    │   │
    │   ├── lib/
    │   │   ├── api.ts                  # Backend API client (typed fetch)
    │   │   └── utils.ts                # Tailwind cn() helper
    │   │
    │   └── pages/
    │       ├── Index.tsx               # Main single-page layout
    │       └── NotFound.tsx            # 404 page
    │
    ├── package.json
    ├── vite.config.ts                  # Vite config + API proxy
    ├── tailwind.config.ts
    ├── tsconfig.json
    └── vitest.config.ts
⚡ Setup & Installation
Prerequisites
- Python 3.12+
- Node.js 18+
- npm or bun
- Google Gemini API Key — Get one here
1. Clone the Repository
git clone https://github.com/YOUR_USERNAME/CarbonLens-AI.git
cd CarbonLens-AI
2. Backend Setup
cd backend

# Create virtual environment
python -m venv venv

# Activate (Windows)
.\venv\Scripts\activate

# Activate (Mac/Linux)
source venv/bin/activate

# Install dependencies
pip install -r requirements.txt

# Configure environment
cp .env.example .env
# Edit .env and add your GEMINI_API_KEY

# Train ML model
python -m app.ml_train

# Start backend server
uvicorn app.main:app --reload --port 8000
3. Frontend Setup
cd frontend

# Install dependencies
npm install

# Start dev server
npm run dev
4. Open the App
- Frontend: http://localhost:8080
- Backend API: http://localhost:8000
- API Docs: http://localhost:8000/docs
📦 Sample Data
Pre-built CSV files in backend/data/ for quick testing:
sample_transactions.csv (32 rows)
date,description,amount,category
2026-01-03,Office electricity bill January,2850,electricity
2026-01-05,Diesel fuel for company vehicles,1200,fuel
2026-01-10,Flight booking to London conference,3500,travel
sample_energy.csv (12 rows)
date,type,amount,unit
2026-01-01,electricity,4200,kWh
2026-02-01,natural_gas,850,m3
2026-03-01,diesel,320,litres
sample_logistics.csv (15 rows)
date,mode,distance_km,weight_kg,description
2026-01-05,air,5200,2500,International air freight to UK
2026-01-12,road,450,8000,Regional truck delivery
2026-01-18,sea,12000,25000,Bulk shipping to Asia
🌐 Deployment
Backend — Render
| Setting | Value |
|---|---|
| Runtime | Python 3 |
| Build Command | pip install -r requirements.txt |
| Start Command | uvicorn app.main:app --host 0.0.0.0 --port $PORT |
| Env Vars | GEMINI_API_KEY, DATABASE_URL, FRONTEND_URL |
Frontend — Vercel
| Setting | Value |
|---|---|
| Framework | Vite |
| Build Command | npm run build |
| Output Directory | dist |
| Env Vars | VITE_API_URL=https://your-backend.onrender.com |
🎬 Demo Flow
1. Open CarbonLens AI in browser
2. Upload 3 sample CSVs (transactions, energy, logistics)
3. Click "Process Data" → Pipeline runs in ~2 seconds
4. Dashboard populates with:
   • Total CO₂e emissions
   • Scope 1/2/3 breakdown
   • Monthly emission trends (area chart)
   • Category distribution (pie chart)
   • Top emission sources table
5. AI Insights generates:
   • Executive summary
   • 5 actionable recommendations
6. Simulator: drag sliders to see CO₂ reduction projections
7. Download professional PDF ESG report
🌍 Making business sustainability measurable, actionable, and AI-powered.
Built With
- fastapi
- framer-motion
- google-gemini-api
- pandas
- python
- react
- recharts
- reportlab
- scikit-learn
- sqlalchemy
- sqlite
- tailwind-css
- typescript
- vercel
- vite

Log in or sign up for Devpost to join the conversation.