
Inspiration
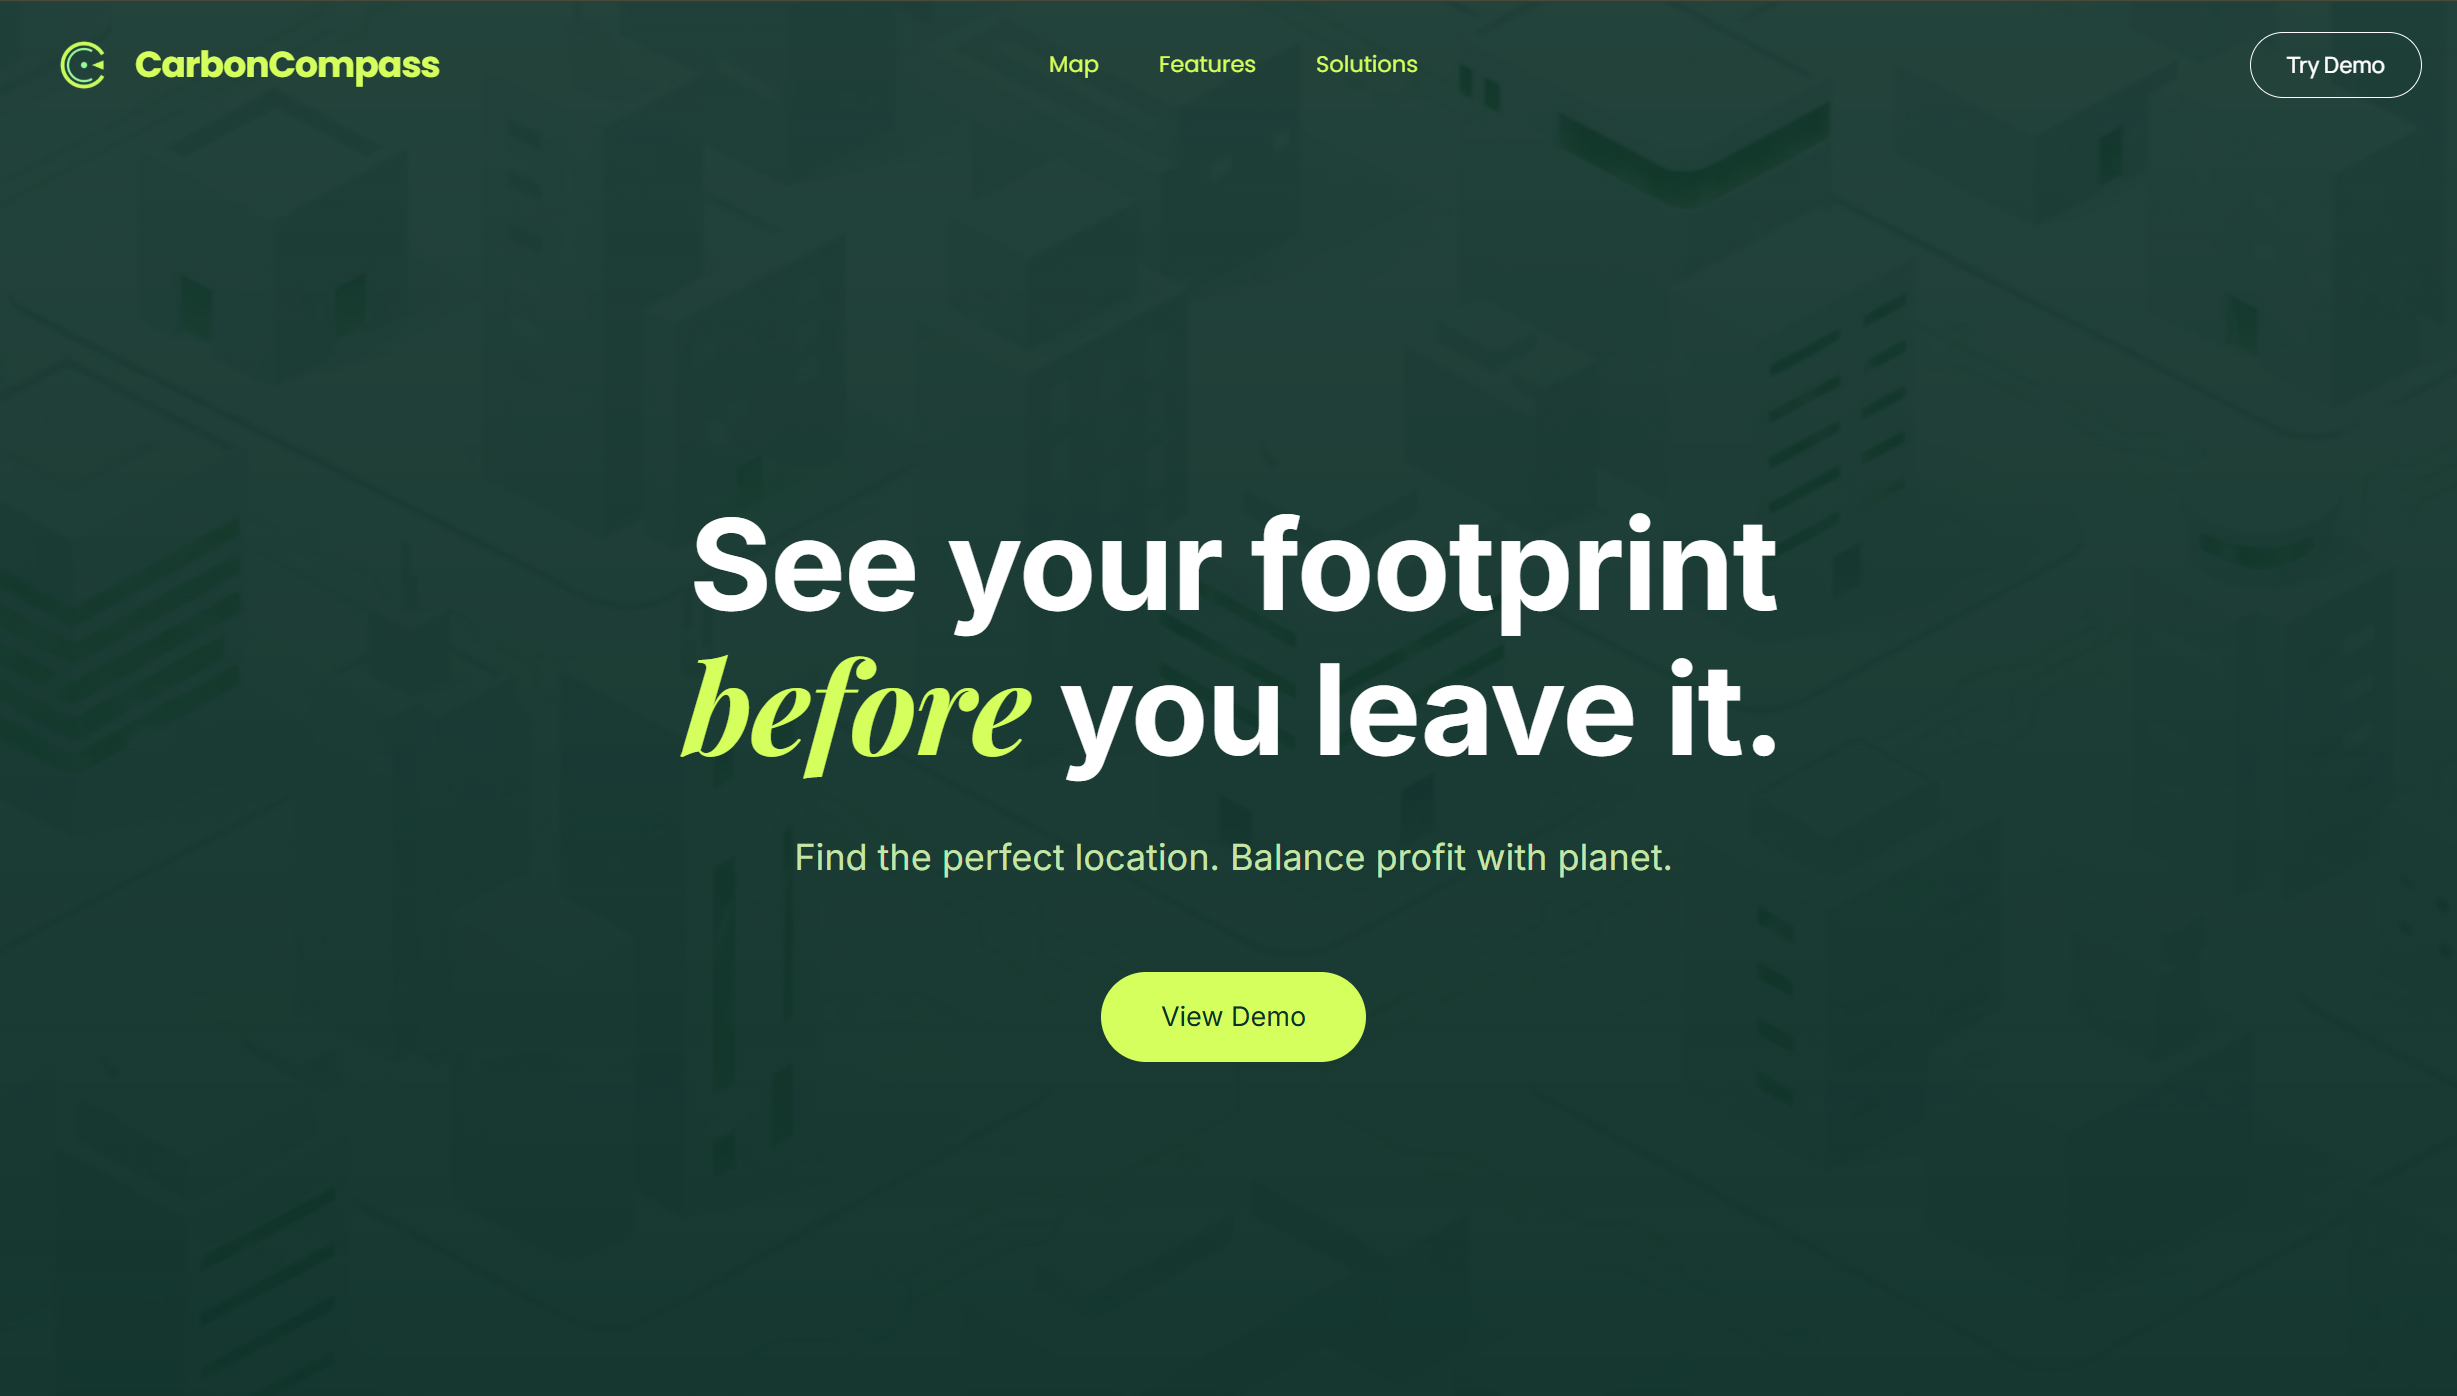
In the fever of entrepreneurship, new businesses often open with excitement but overlook their environmental impact. CarbonCompass was inspired by this imbalance — we wanted to build a tool that helps founders visualize both profitability and sustainability before they choose a location. We realized there was no simple way to see how a new venture affects carbon output, energy use, and local waste systems. That insight sparked our mission: See your business’s footprint before you leave it.
What it does
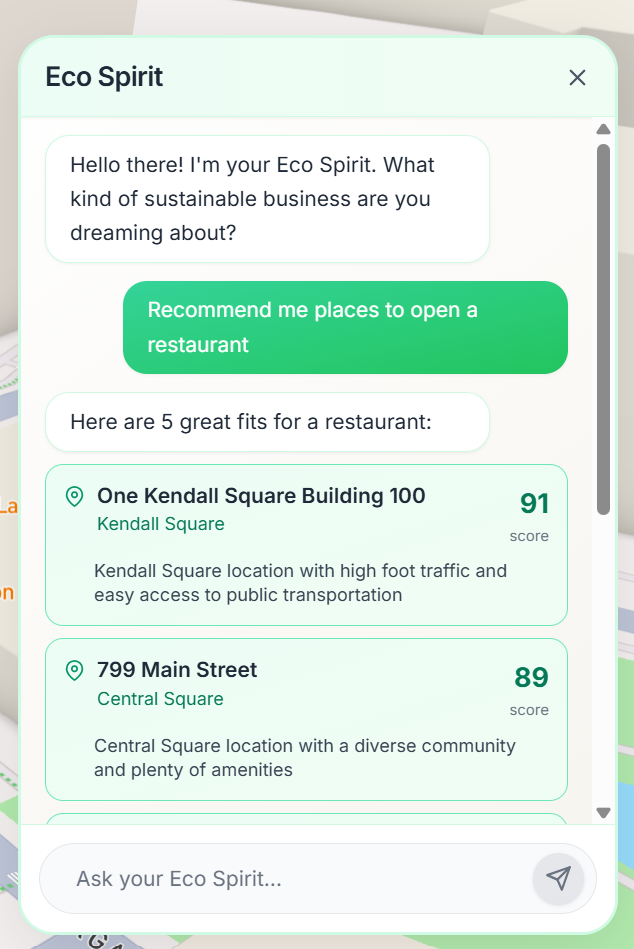
CarbonCompass analyzes cities and recommends the most sustainable neighborhoods for starting a business. Users simply type a short idea like “eco café” or “boutique retail” into a chat window, and the AI recommends 2–3 optimal areas on an interactive 3D Mapbox map. Each site is color-coded by a Green Score, which reflects:
- Energy efficiency
- Waste generation potential
- Walkability and transit access
- Safety and zoning risk
For every recommendation, the app explains why that neighborhood fits best — balancing profit potential with environmental responsibility.
How we built it
We built CarbonCompass using a full-stack cloud-native architecture designed for scalability and speed.
- Frontend: Built in React with TailwindCSS and Mapbox GL JS to render real-time, color-coded 3D maps.
- Backend: Implemented with Cloudflare Workers, which handle JSON data parsing, sustainability calculations, and AI routing.
- Database: Cloudflare D1 stores user sessions and chat history; Cloudflare R2 stores geospatial and sustainability data.
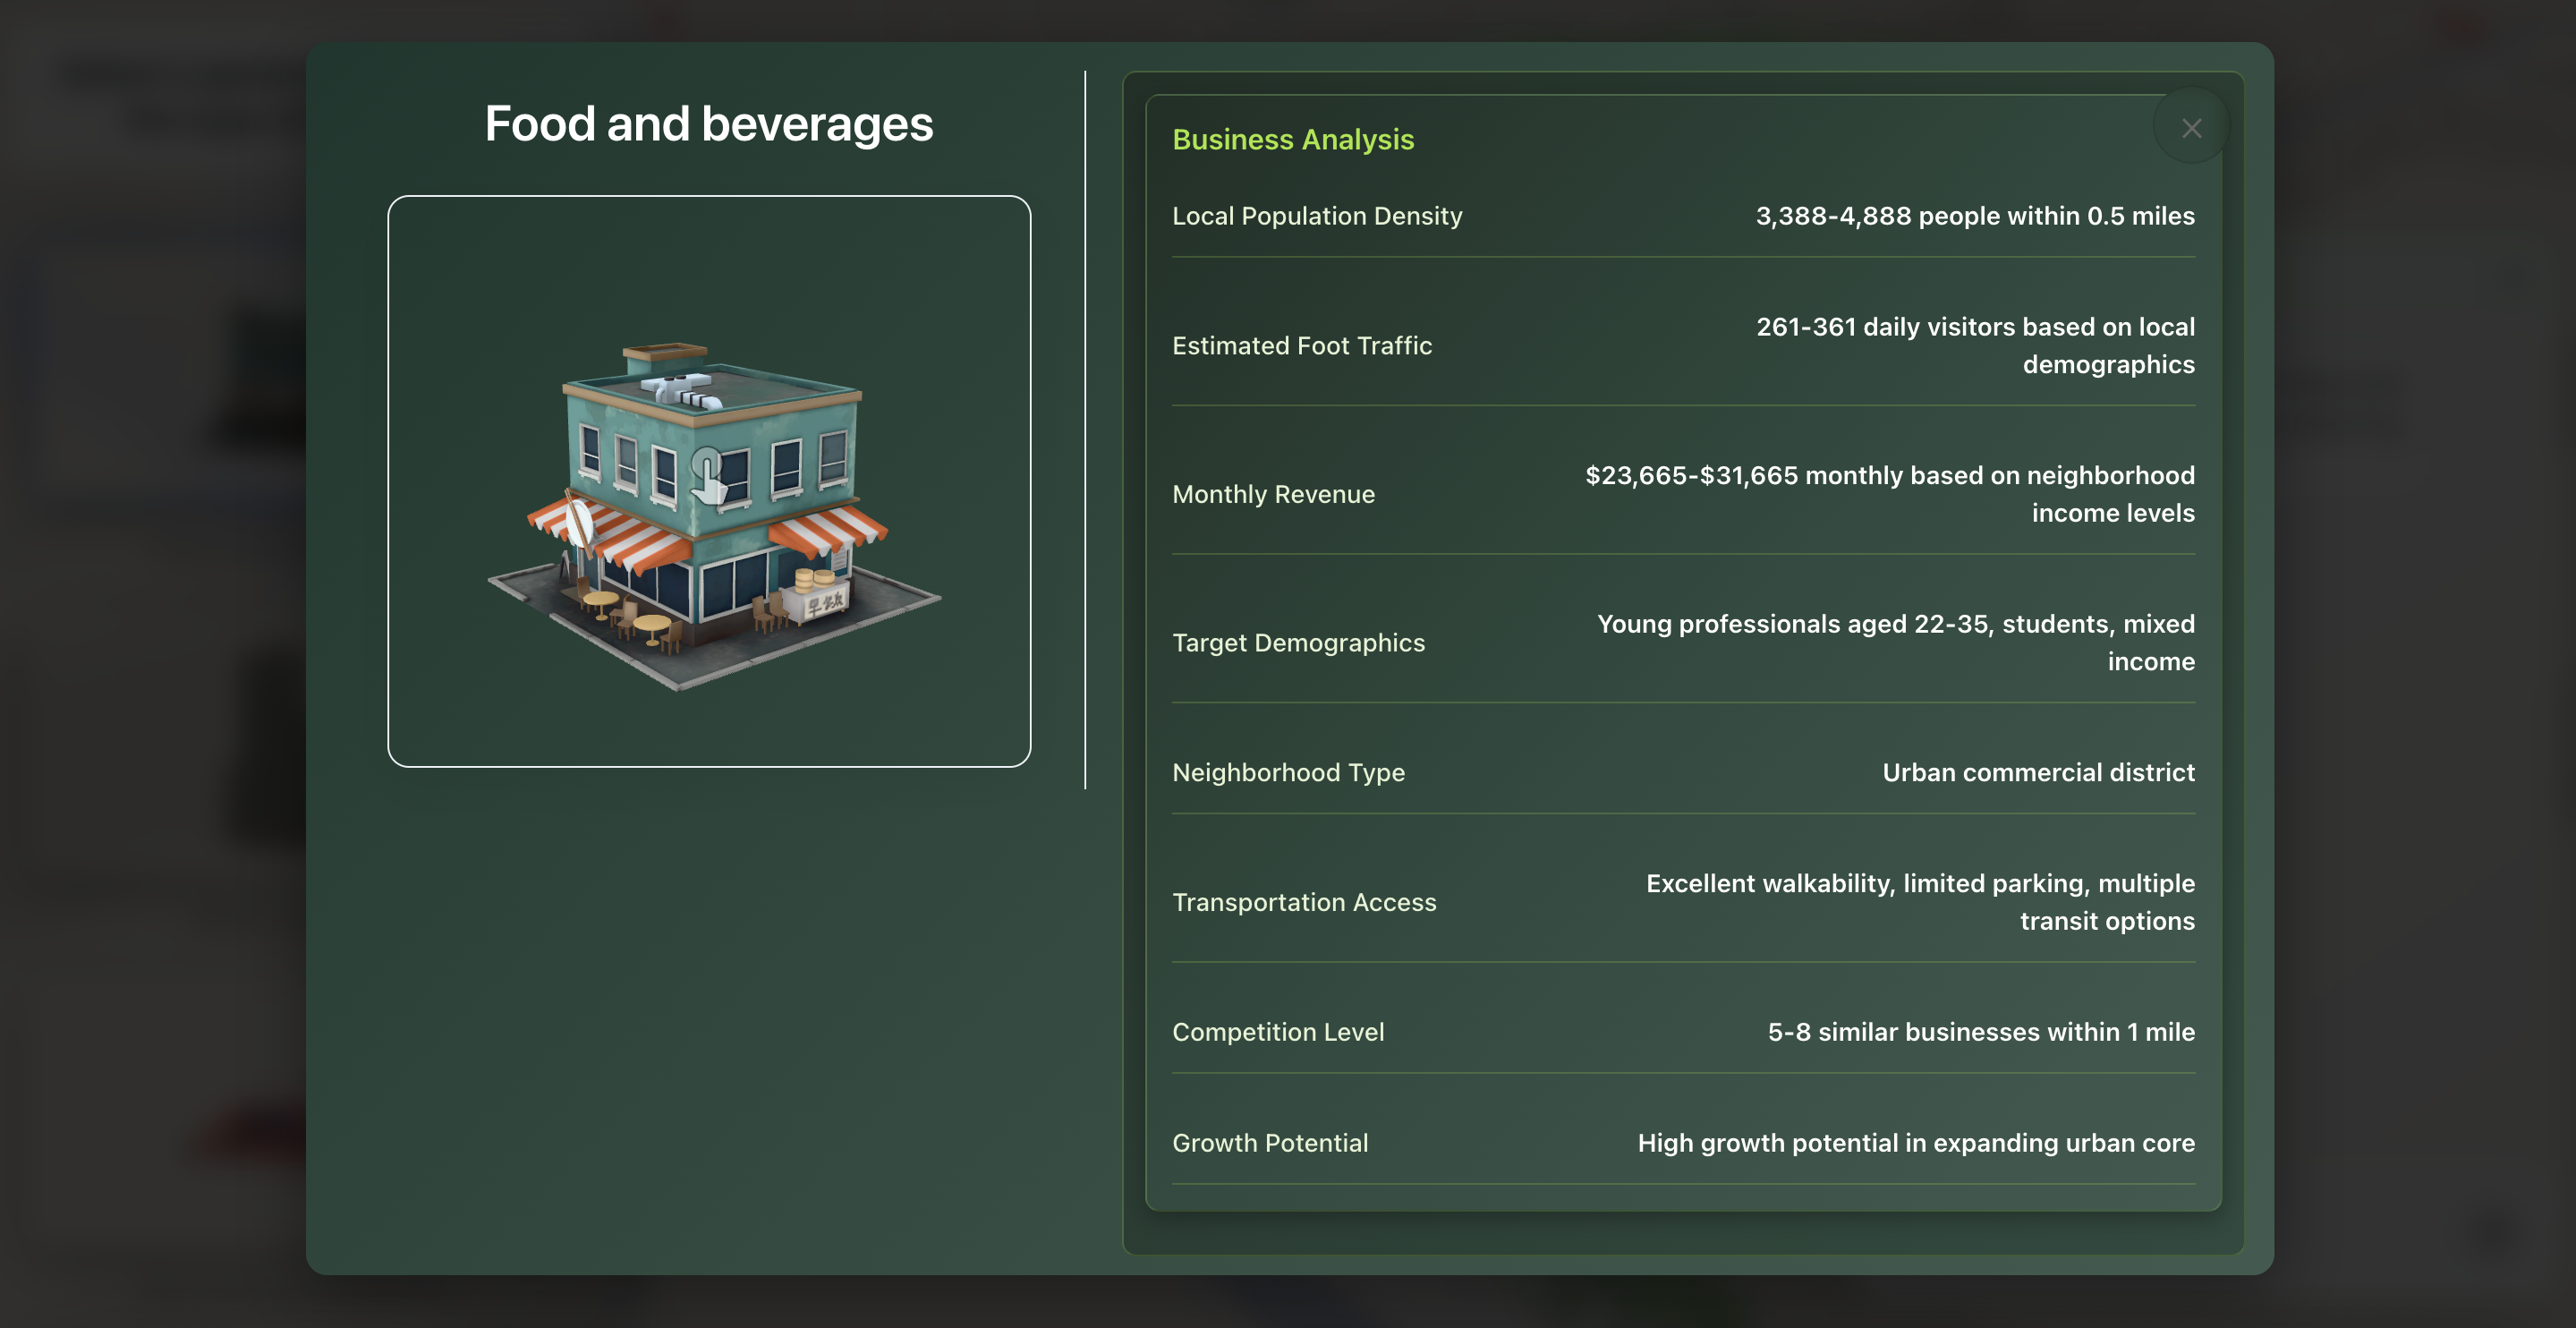
- AI Integration: The Gemini API processes natural-language business descriptions and building datasets to produce structured recommendations like:
Visualization
We used dynamic Mapbox layers and interactive popups for contextual eco-data, making the interface intuitive and responsive. Each recommended building dynamically updates its style, allowing users to visually compare sustainability scores in real-time.
Challenges we ran into
- Data integration: Combining multiple environmental indicators (energy, waste, safety) into one coherent model.
- AI optimization: Running AI inference inside serverless Workers without exceeding compute limits.
- Frontend synchronization: Keeping map markers, chat sessions, and backend responses perfectly aligned.
- UI complexity: Designing a minimalist interface that still conveys deep sustainability insights.
Accomplishments that we're proud of
- Built a fully operational AI-driven sustainability recommender in under 48 hours.
- Designed a transparent Green Score algorithm using weighted factors for emissions, walkability, and zoning.
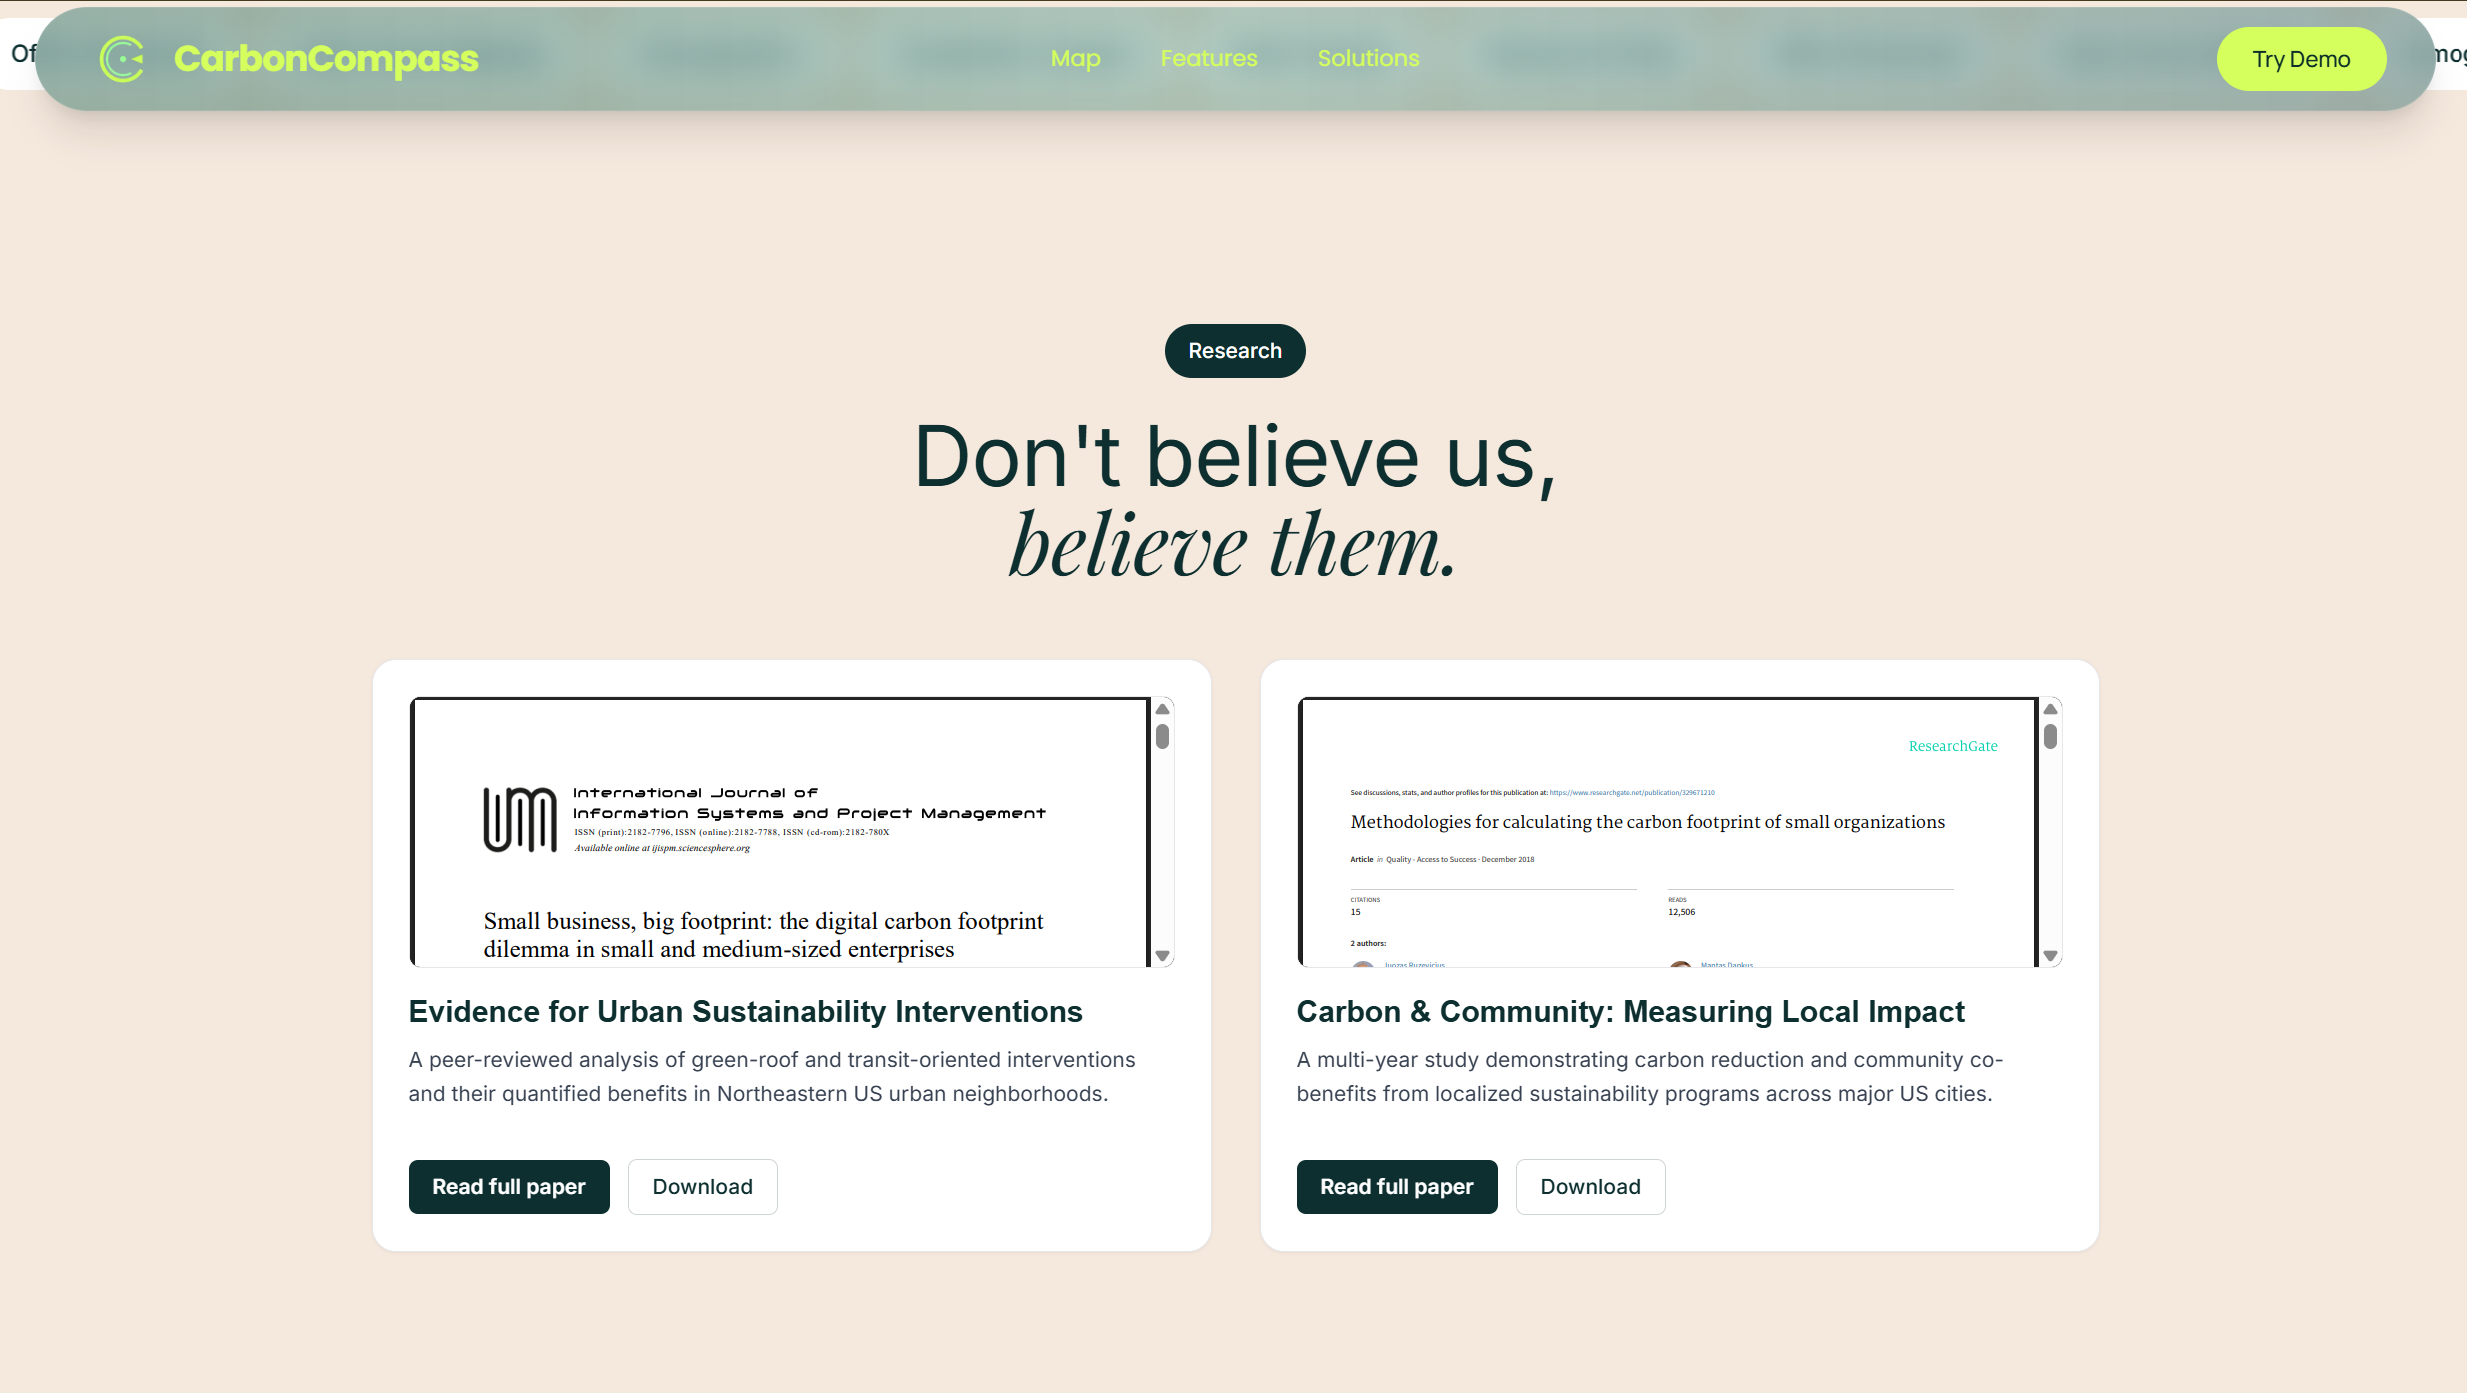
- Created a research-ready system that can later support academic validation.
- Integrated Gemini API, Cloudflare D1/R2, and Mapbox GL JS seamlessly in a real-time app.
What we learned
We learned how environmental datasets can be converted into business intelligence through AI reasoning. We deepened our understanding of geospatial visualization, prompt engineering, and sustainability modeling.
The biggest takeaway: entrepreneurship and ecology aren’t opposites — they’re co-dependent when powered by data.
Mathematically, our scoring function uses weighted environmental factors:
$$ G = w_1E + w_2W + w_3T + w_4S + w_5Z $$
Where \(E\) is energy efficiency, \(W\) is waste reduction, \(T\) is transit accessibility, \(S\) is safety, and \(Z\) is zoning impact.
Each weight \(w_i\) was tuned through trial and literature-based benchmarks to ensure balanced sustainability scoring.
What's next for CarbonCompass
We plan to:
- Integrate real-time municipal data (emissions, waste collection, solar coverage).
- Expand to more cities and scale the Green Score through ML regression.
- Provide exportable 1-page Sustainability Briefs for startup applications.
- Collaborate with urban researchers to validate the correlation between business location and carbon efficiency.
Built With
- api
- blender
- cloudflare
- d1
- gaussian
- gemini
- gl
- javascript
- json
- lidar
- mapbox
- r2
- react
- tailwindcss
- typescript
- workers


Log in or sign up for Devpost to join the conversation.