Inspiration I created CarbonCalc Pro out of a deep concern for the environment and a passion for technology. I was inspired by the growing need for accessible tools that help individuals understand and manage their carbon footprint. With climate change affecting communities worldwide, I wanted to build something that not only educates but also motivates people to take action.
What I Learned Sustainability & Environmental Impact: Researching emission factors, energy usage statistics, and the environmental effects of everyday activities opened my eyes to how our daily choices contribute to global carbon emissions.
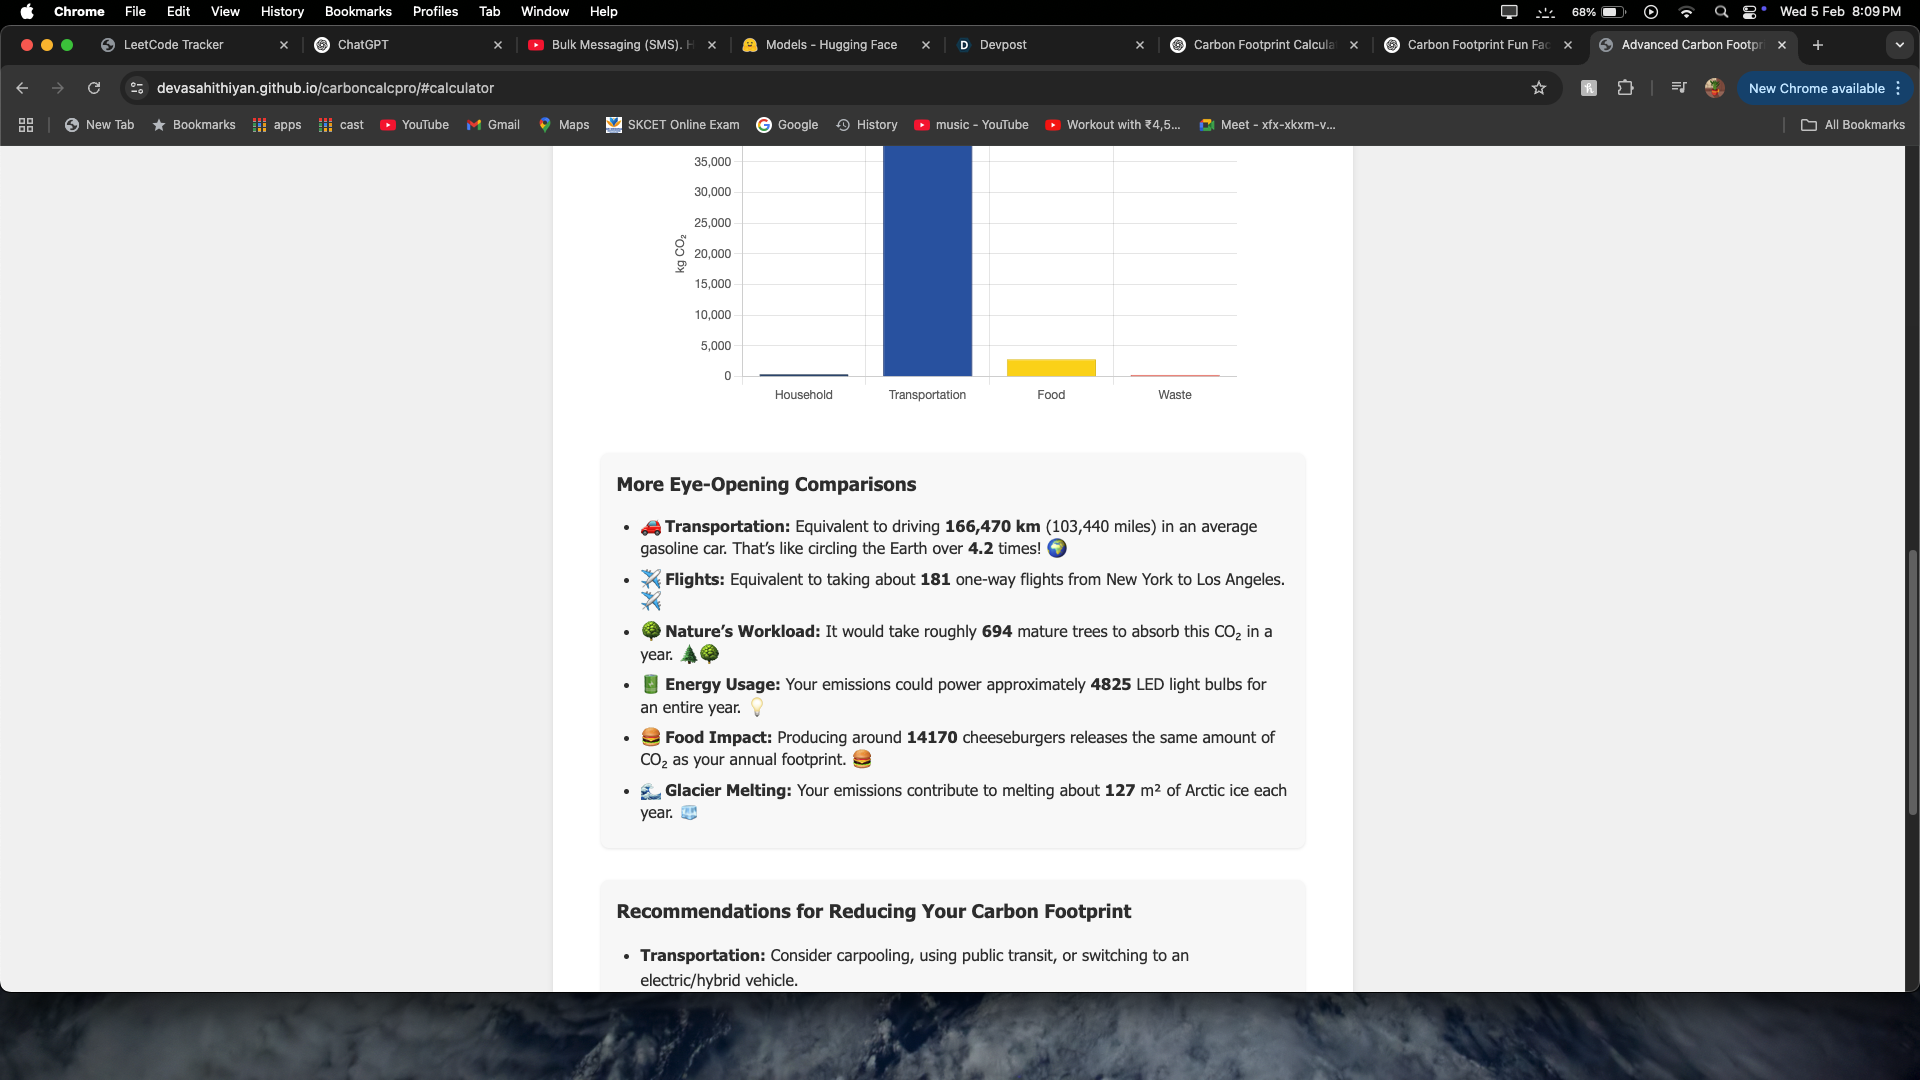
Full-Stack Development: Building a multi-step web application using HTML, CSS, and JavaScript deepened my understanding of client-side development. I also learned how to integrate third-party libraries like Chart.js to enhance data visualization.
User Experience (UX) Design: I explored different UI/UX patterns to create an engaging and intuitive interface. The feedback from users about the ease of navigation and the clarity of the comparisons helped me refine the design significantly.
How I Built the Project Planning & Research: I began by researching various carbon footprint calculators and gathering data on emission factors from reputable sources like the U.S. EPA and IPCC. This helped form the backbone of the calculations in the application.
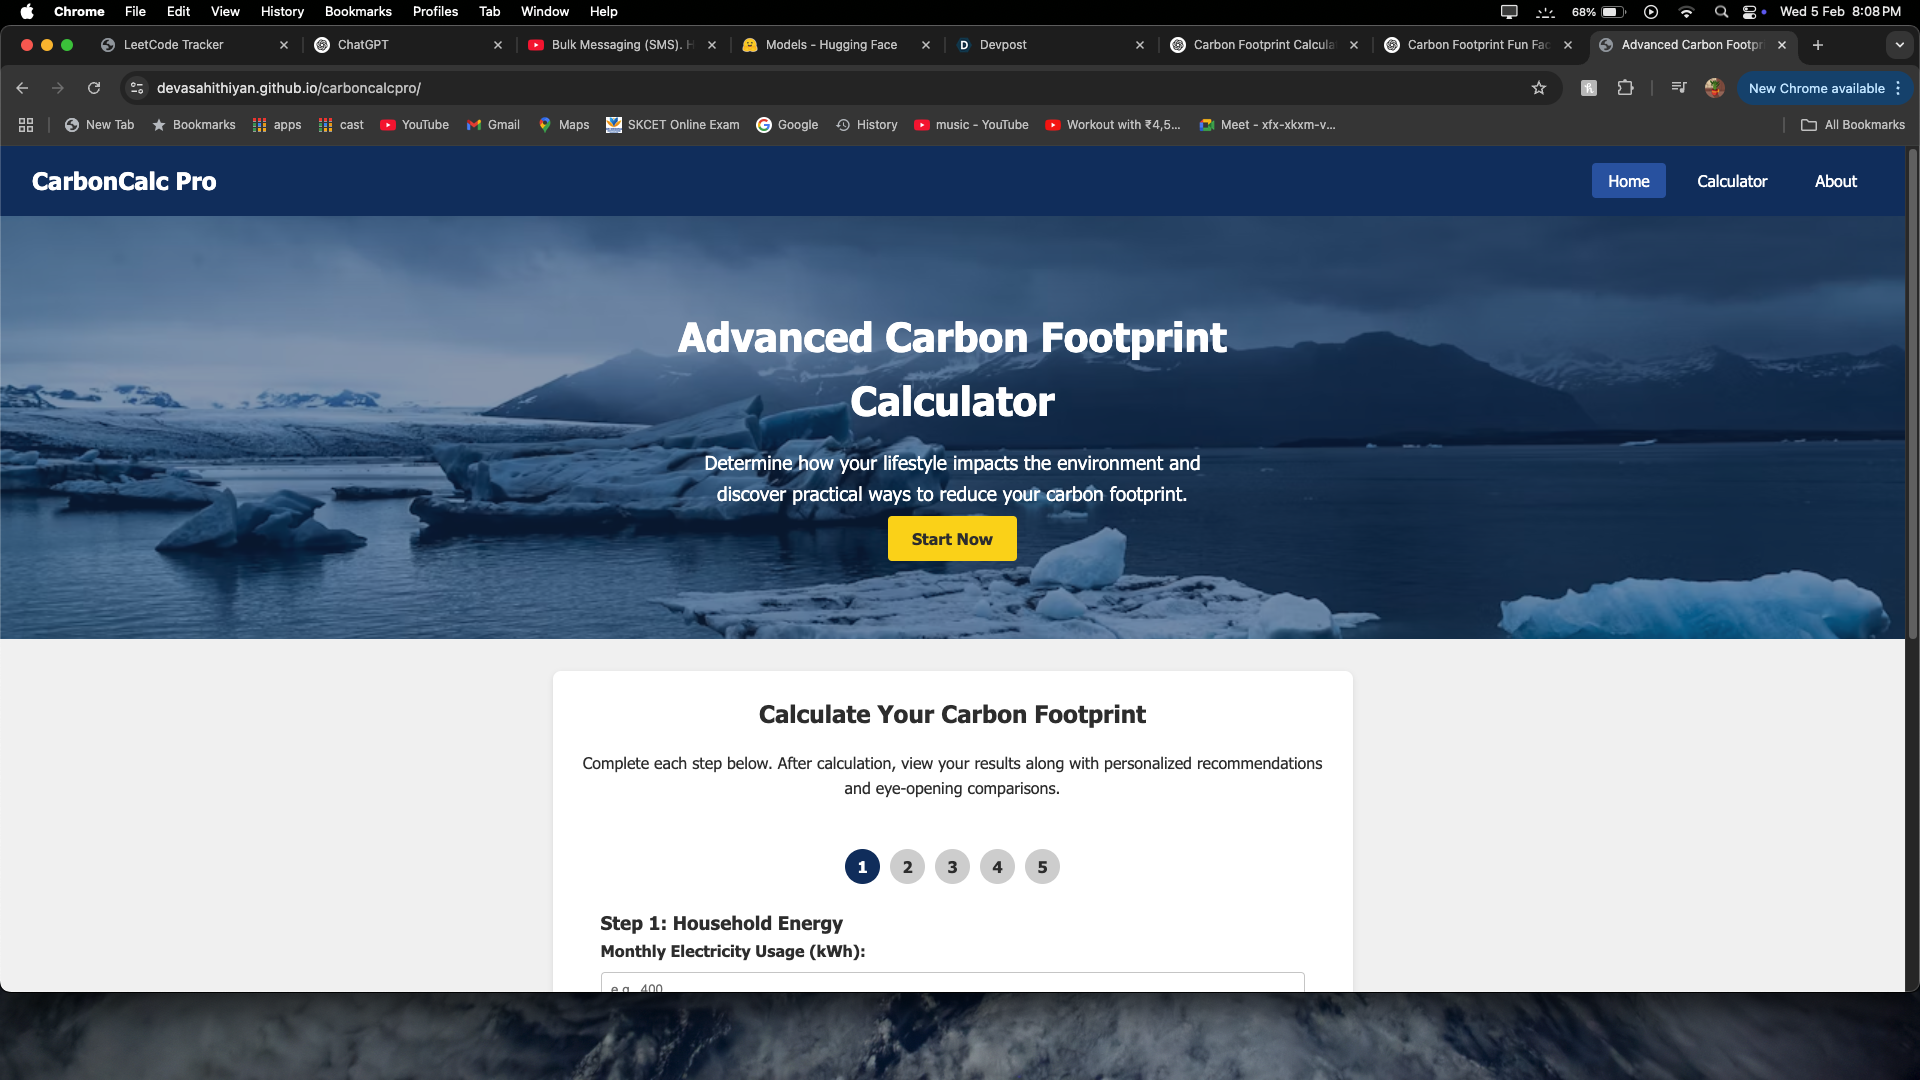
Design & Prototyping: I sketched out the UI design and mapped the user journey from input to result. Using a multi-step form allowed me to break down complex inputs into manageable sections for a better user experience.
Development:
HTML & CSS: I built the structure and style of the website, ensuring it was responsive and visually appealing. JavaScript: I implemented the core logic for the carbon footprint calculations and integrated Chart.js to create dynamic, interactive charts. I also added fun facts and comparisons to provide context and insight. Testing & Refinement: After initial development, I tested the application extensively, making adjustments based on usability feedback and ensuring that the calculations were as accurate as possible. Challenges Faced Data Accuracy: One of the biggest challenges was sourcing accurate and up-to-date emission factors. Balancing precision with simplicity for user understanding required careful consideration.
UI/UX Design: Designing a multi-step form that was both intuitive and engaging posed its own set of challenges. I had to iterate on the design multiple times to ensure the flow was smooth and the information was presented clearly.
Integration of External Libraries: Integrating Chart.js and ensuring it worked seamlessly across different browsers and devices required troubleshooting and fine-tuning.
Performance Optimization: As the project grew in complexity, I had to optimize the code to ensure the application remained responsive and user-friendly even on lower-end devices.


Log in or sign up for Devpost to join the conversation.