Inspiration
The internet feels invisible, but it has a real carbon footprint. Data centers already consume around 1–2% of global electricity, and that number keeps growing. I was inspired by a simple question: what if people could actually see the environmental cost of their browsing habits?
Most users don’t realize that streaming videos, loading heavy websites, or keeping dozens of tabs open all contribute to carbon emissions. I wanted to make that invisible impact visible and engaging. The retro vending machine concept came from the idea of “dispensing” sustainability tools in a way that feels accessible and fun.
What it does
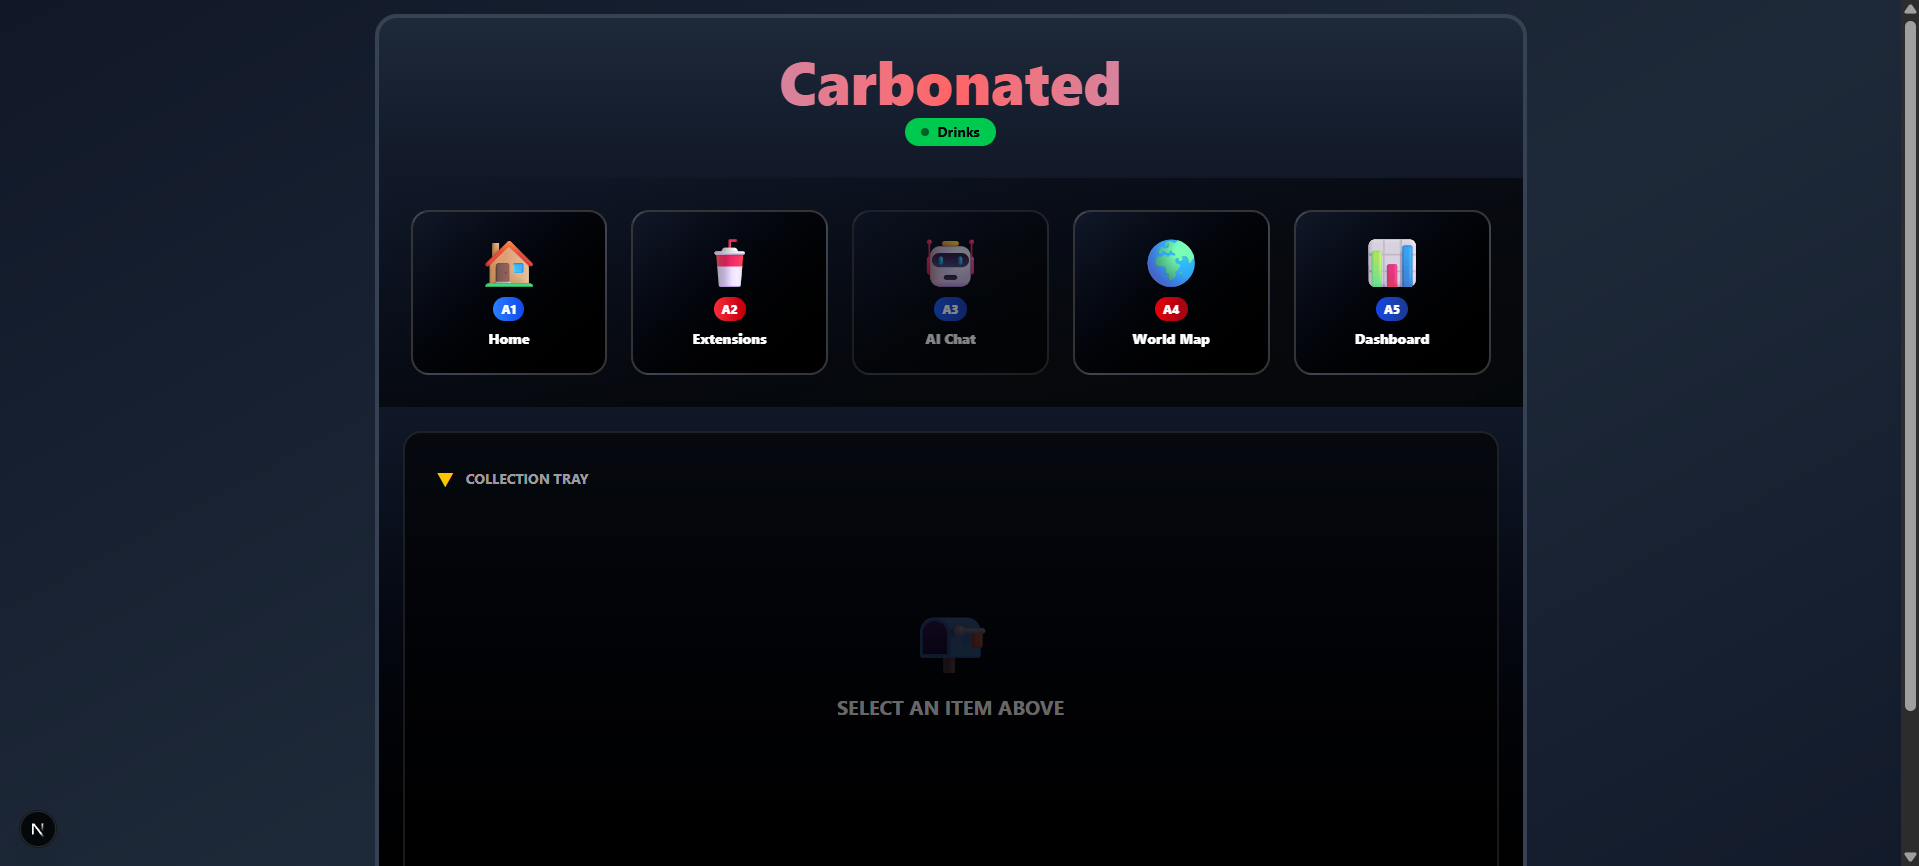
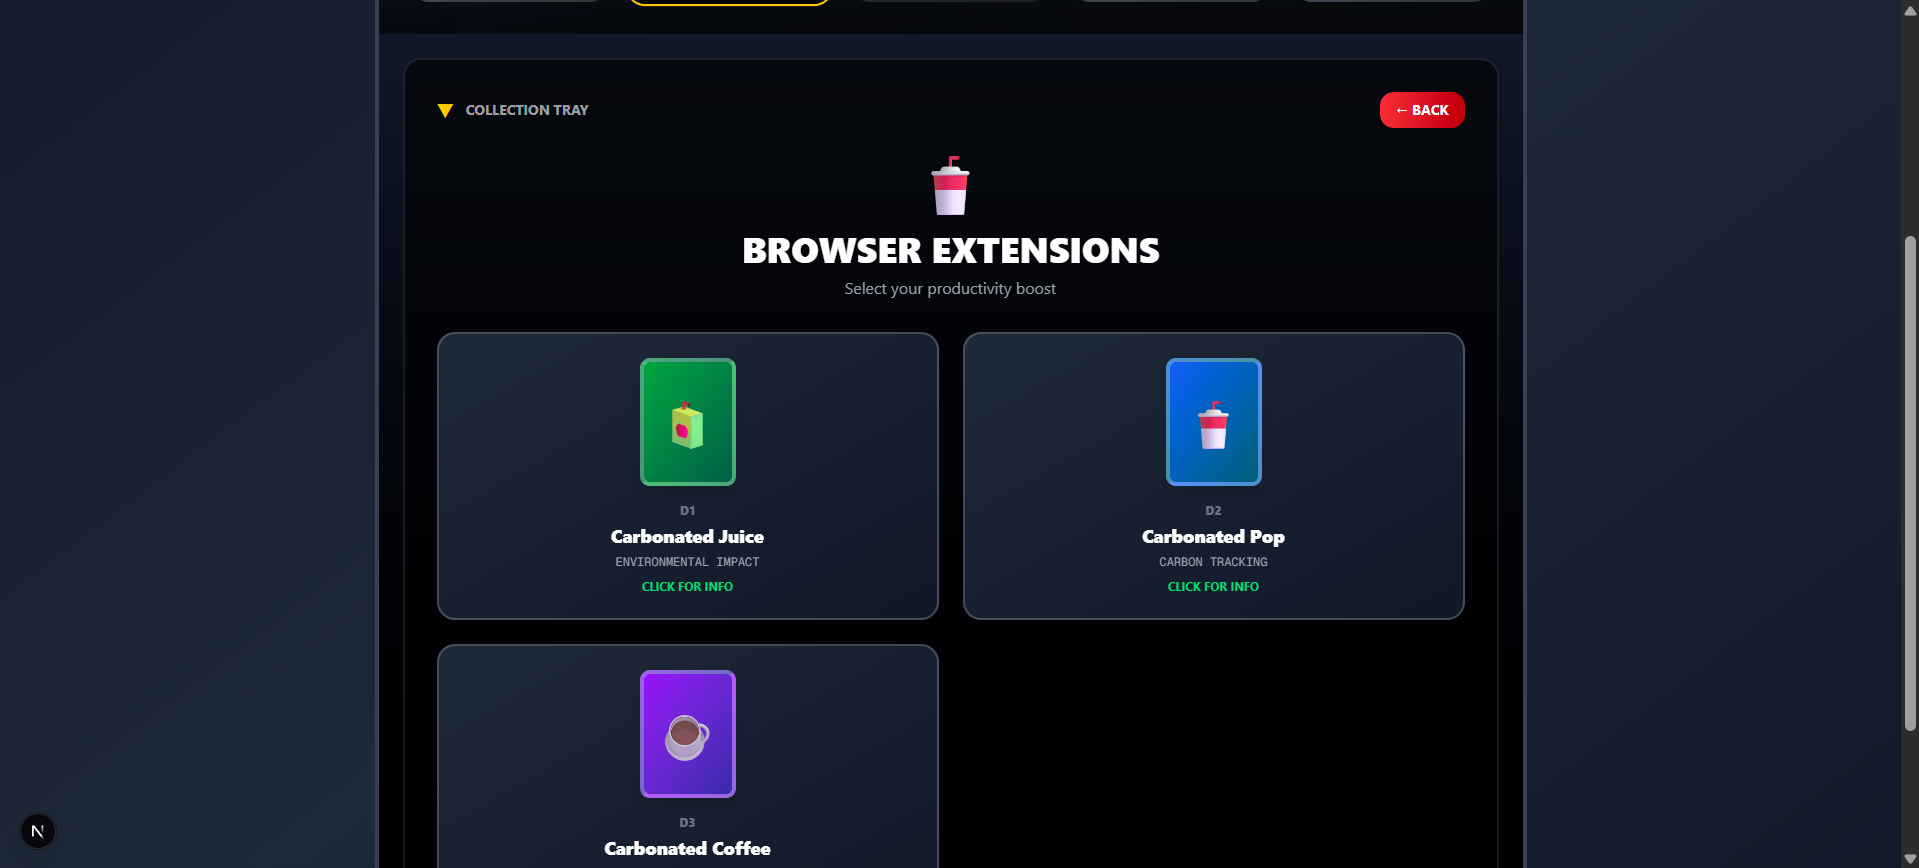
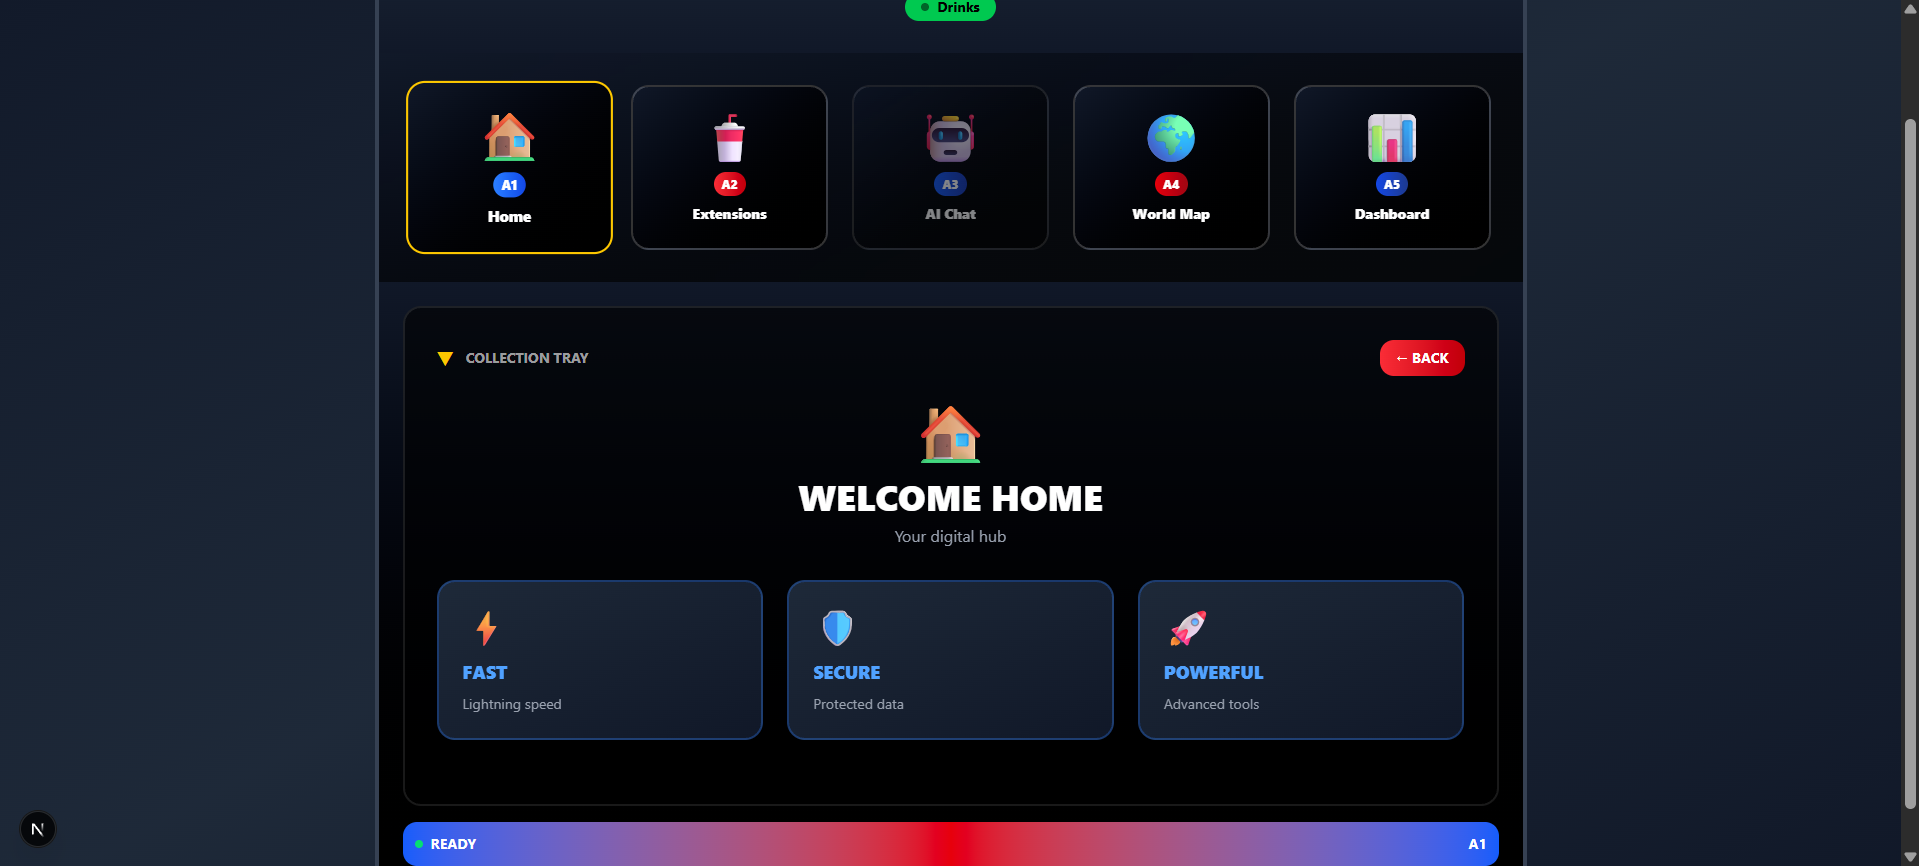
Carbonated is an interactive digital vending machine that showcases three carbon-aware browser extensions through a retro-futuristic interface:
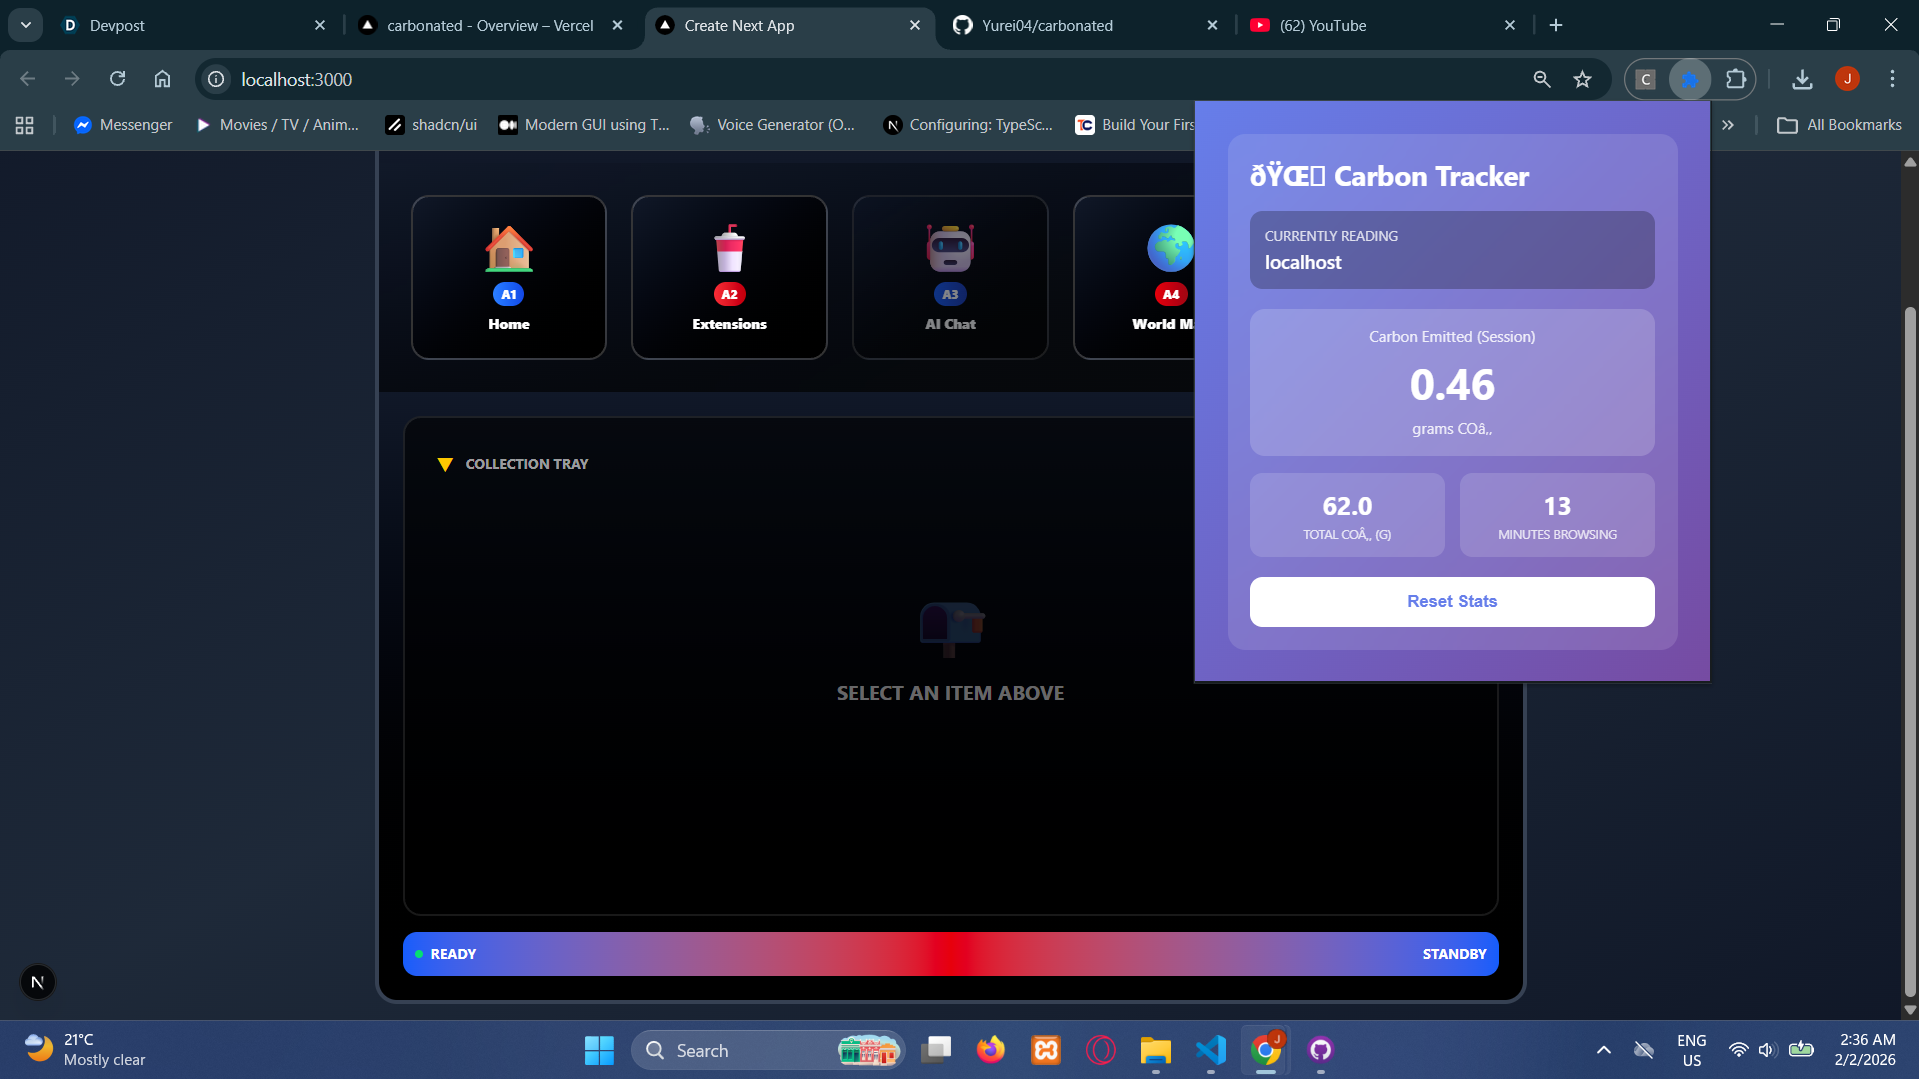
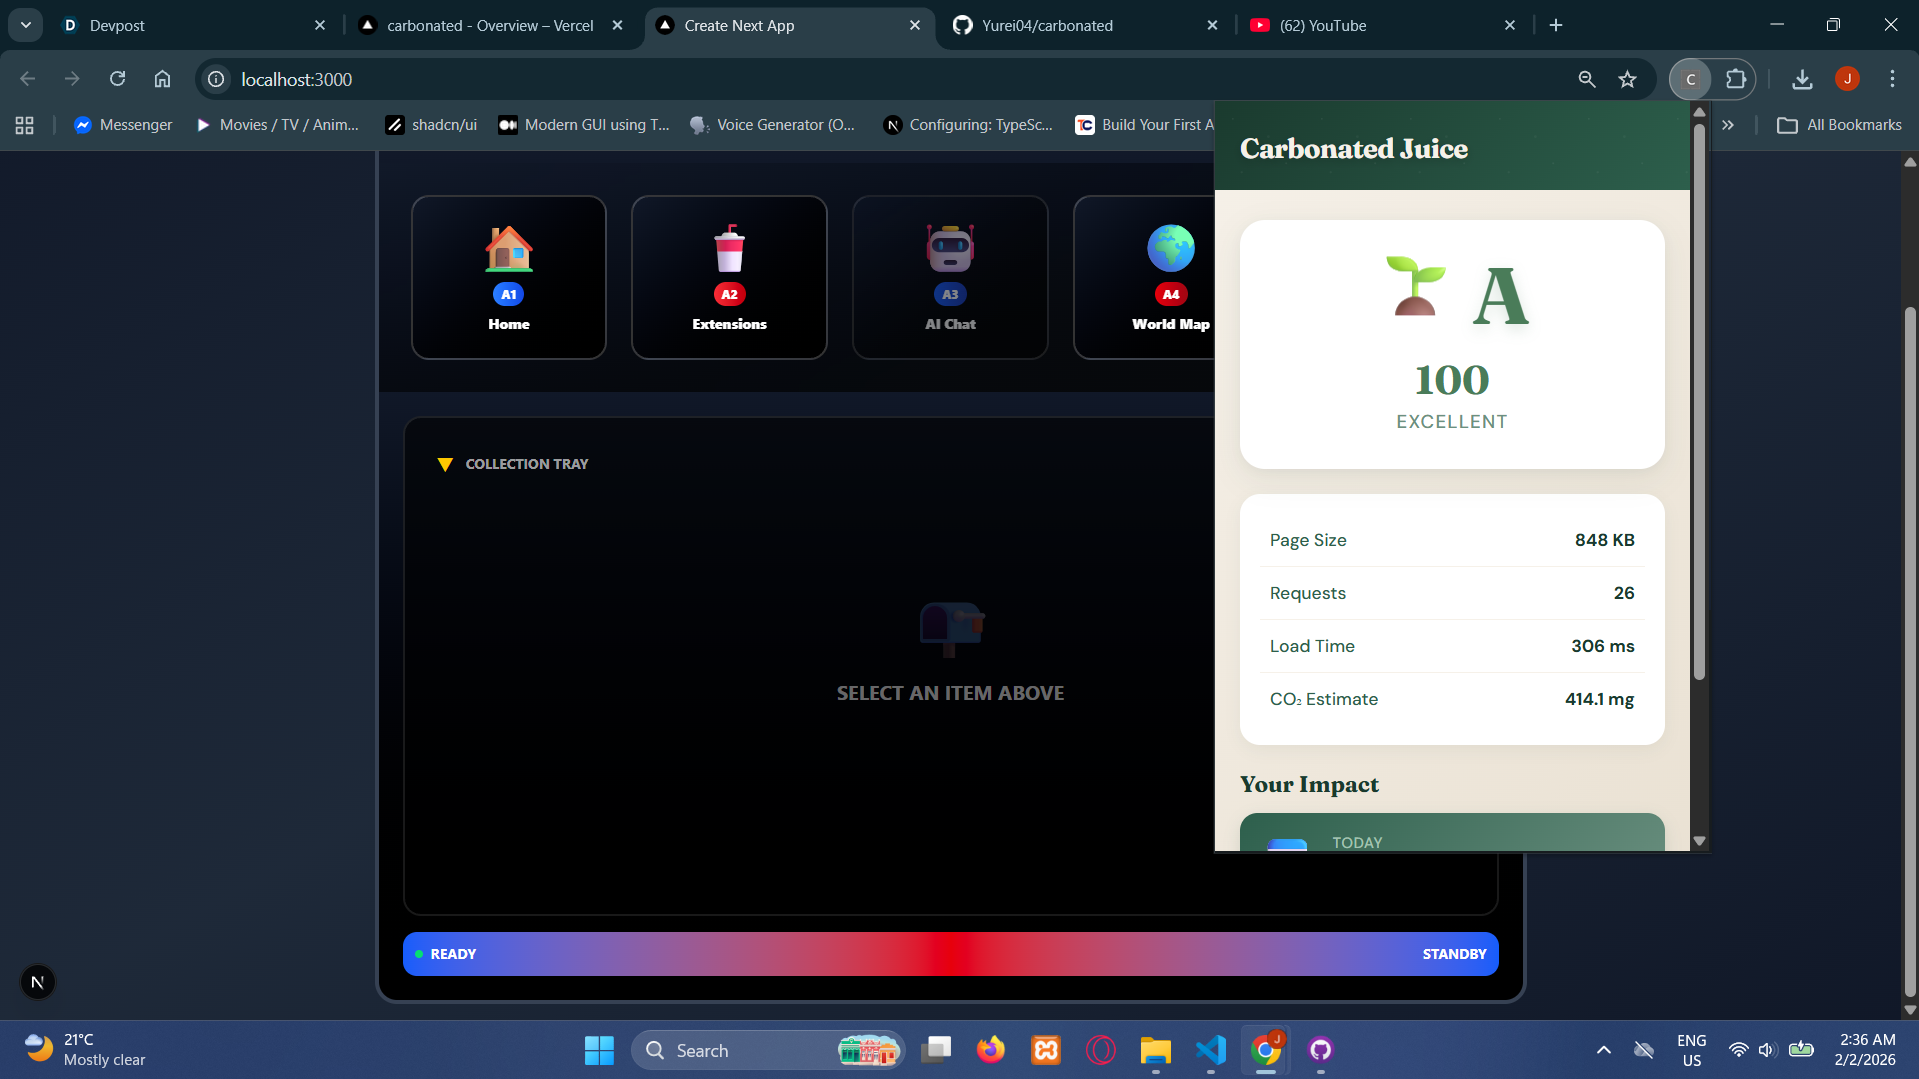
- Carbonated Juice tracks and scores the carbon footprint of websites in real time, logs cumulative impact, and suggests more sustainable alternatives.
- Carbonated Pop monitors carbon emissions per second while browsing, with live dashboards, alerts, and historical analytics.
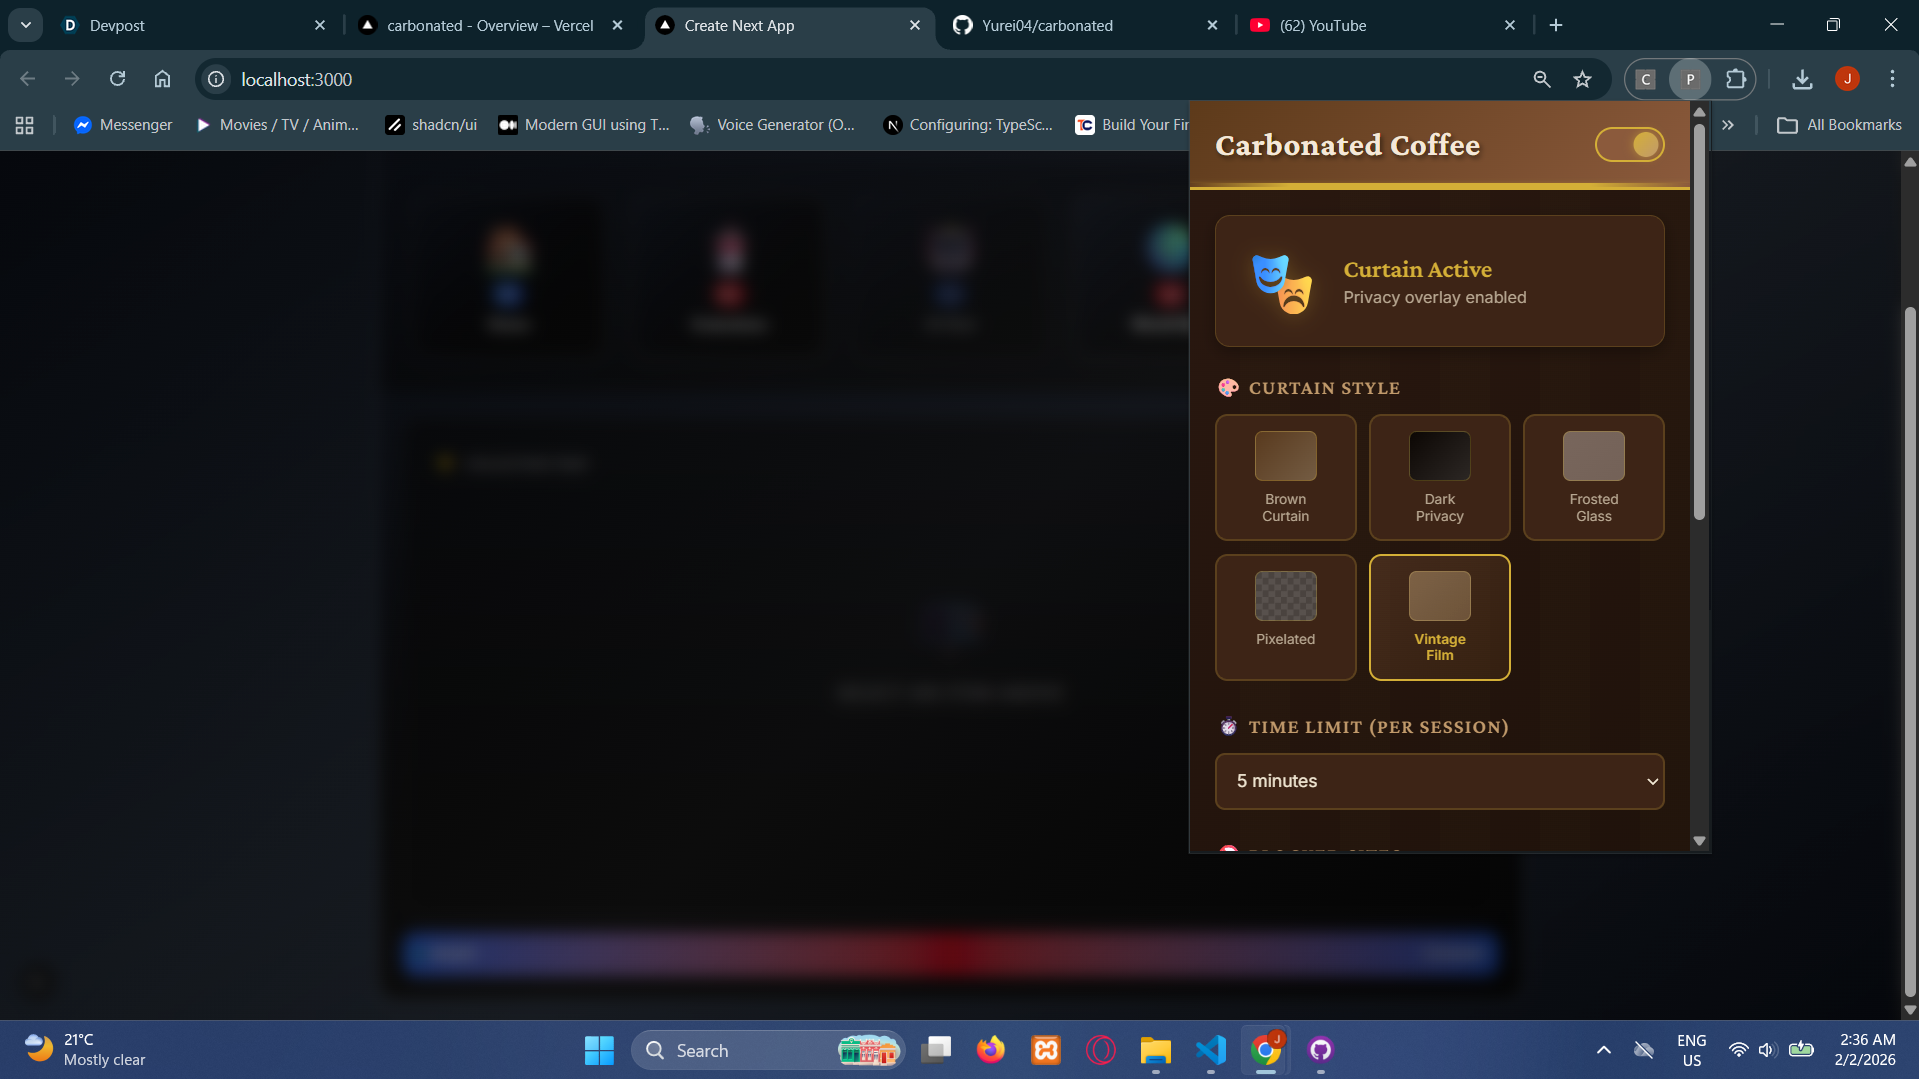
- Carbonated Coffee encourages mindful browsing by blocking distracting sites with a visual curtain, reducing unnecessary screen time and carbon waste.
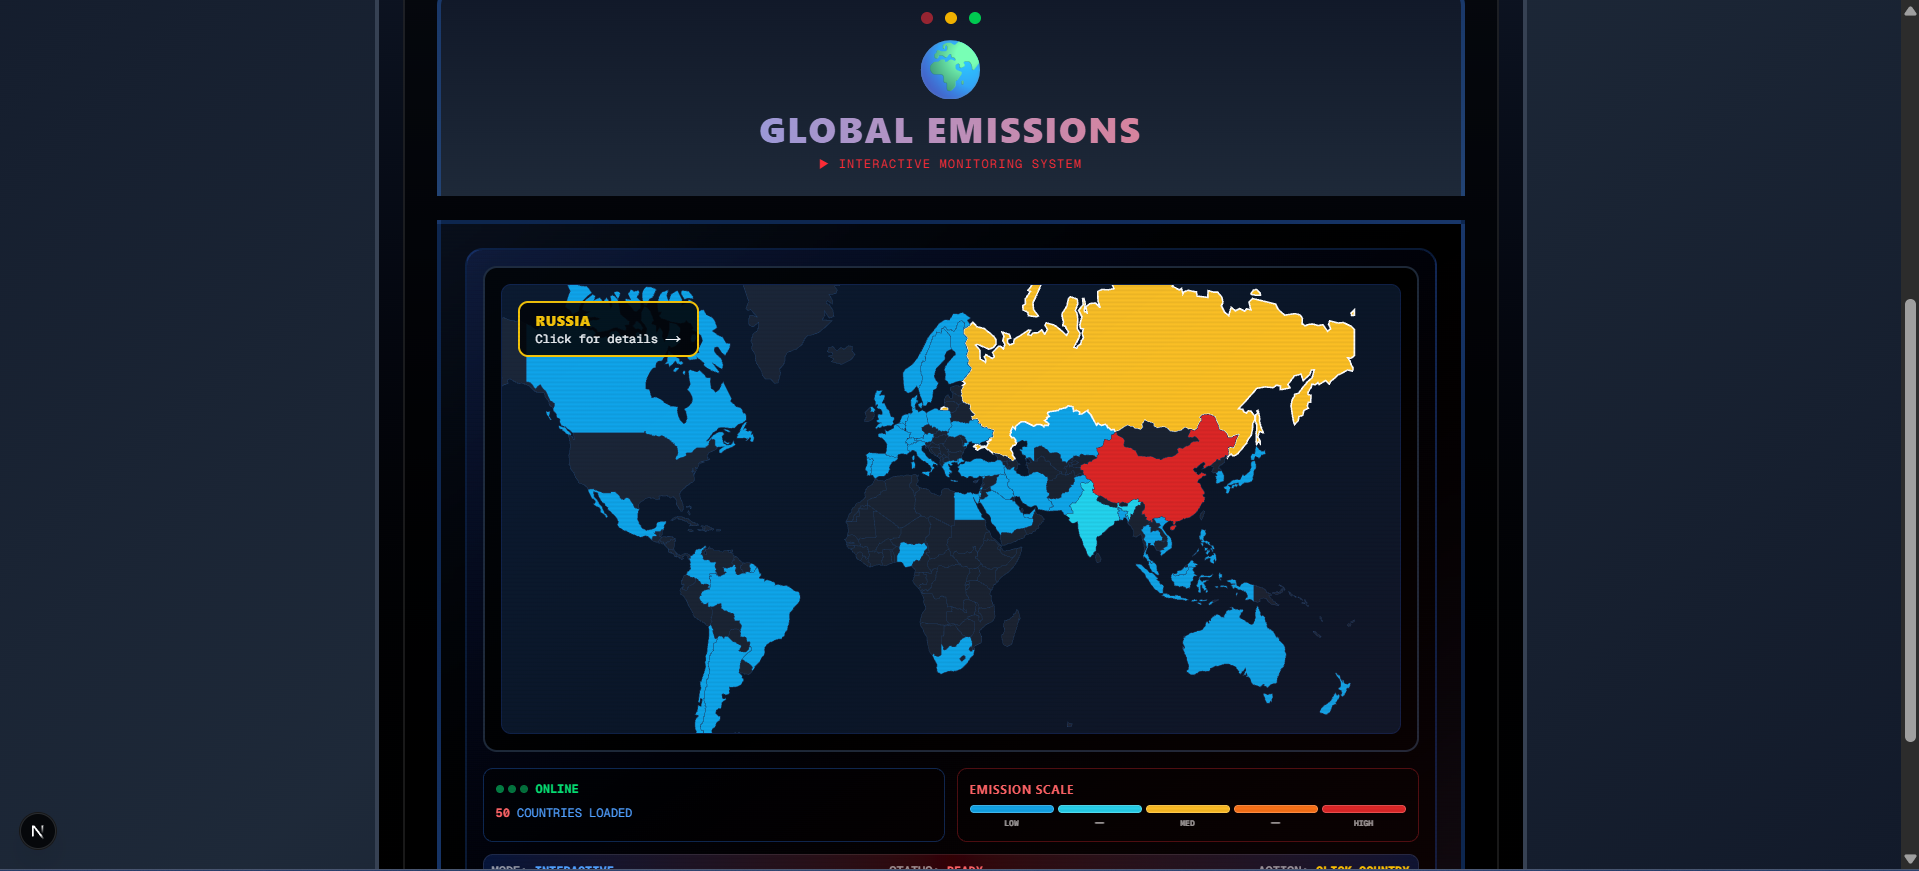
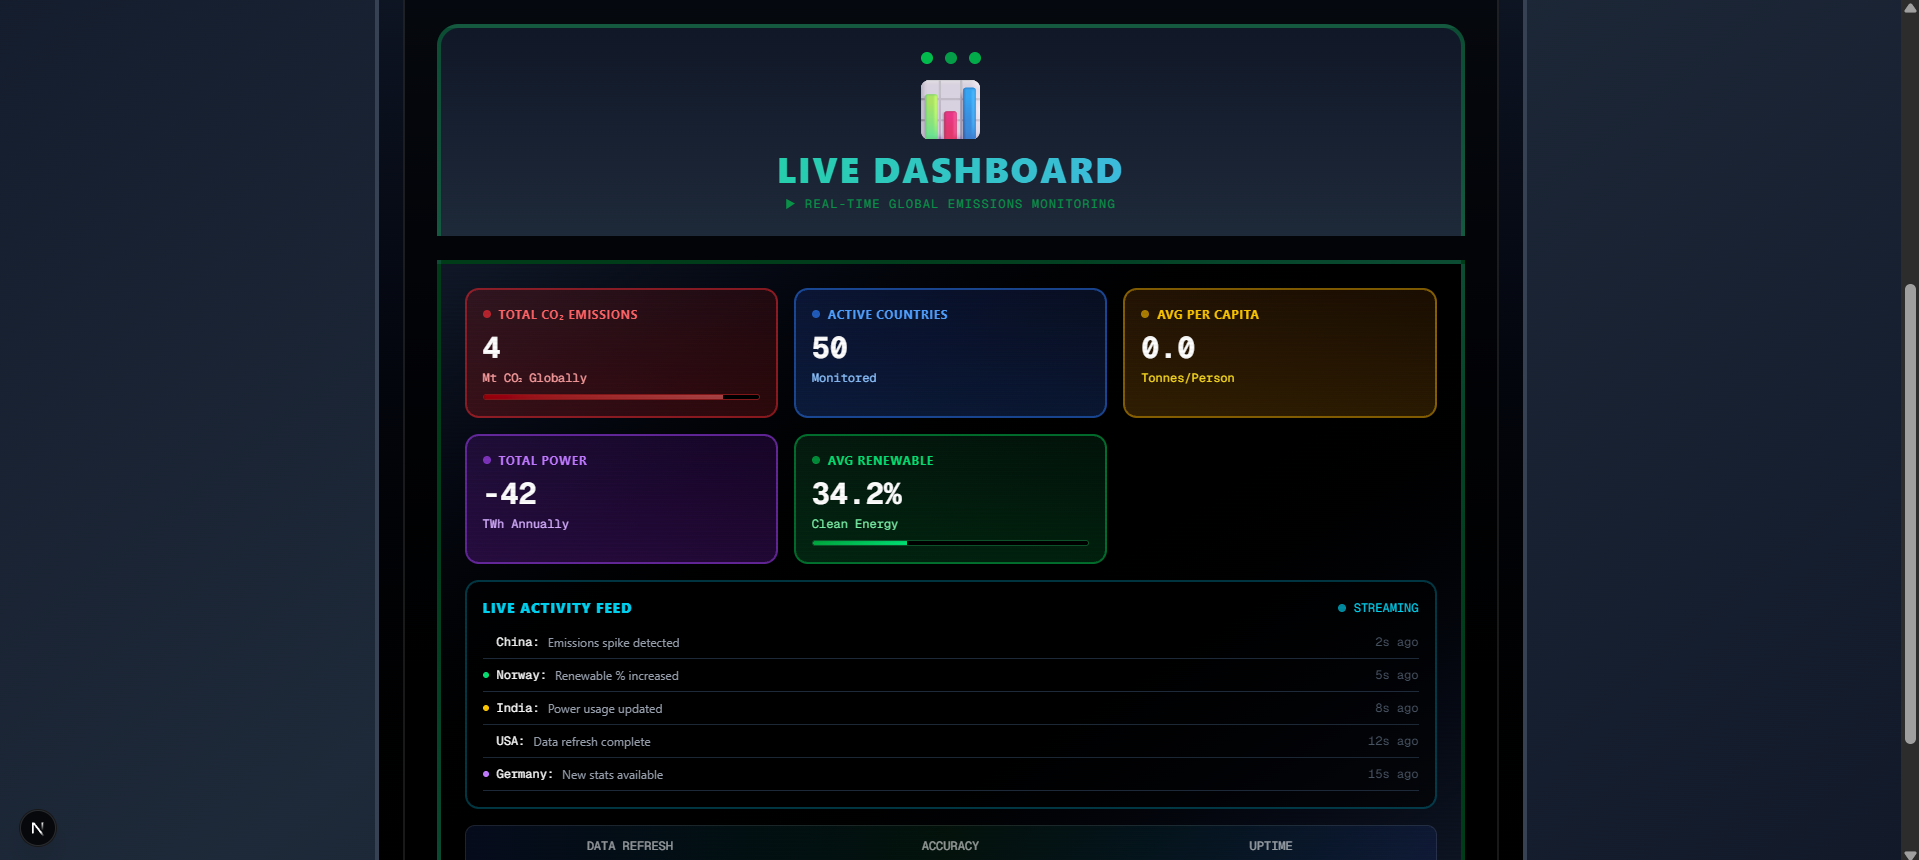
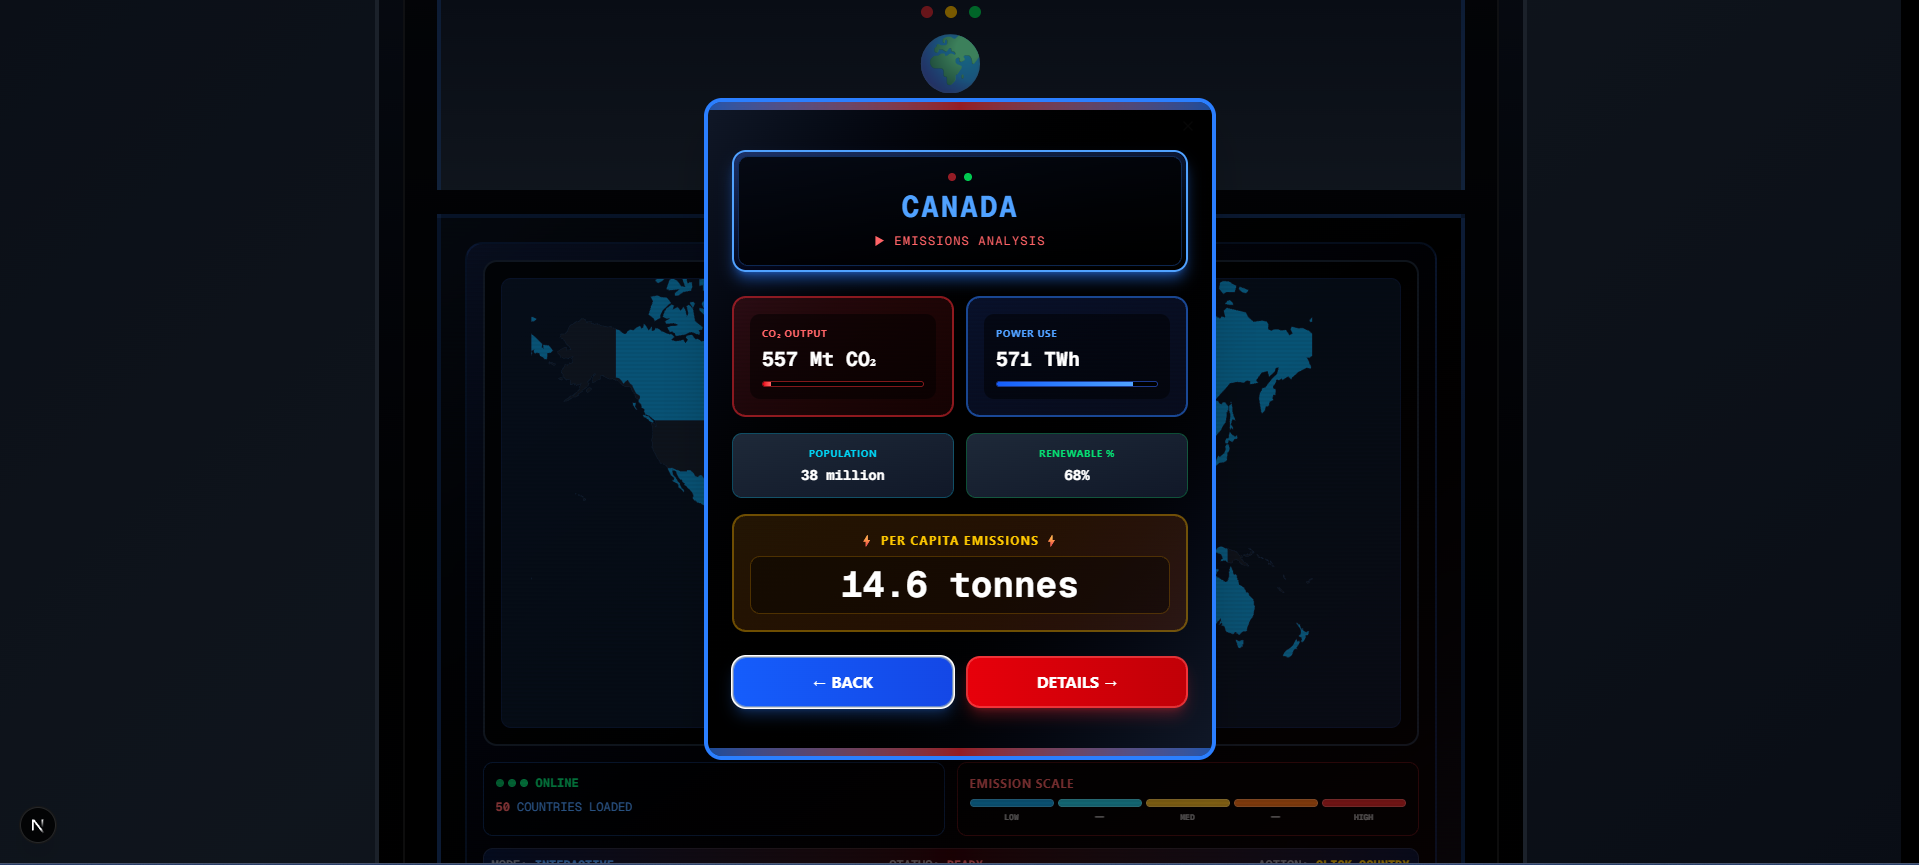
The project also includes a global emissions map with data from 190+ countries, a live emissions dashboard, and a fully interactive vending machine UI.
How I built it
I used Next.js and React for the frontend, Tailwind CSS for styling, React Simple Maps for geographic visualization, and Radix UI/shadcn for accessible dialogs.
The browser extensions were built using Chrome Manifest V3, service workers, content scripts, and Chrome APIs for storage, tabs, and navigation.
On the design side, I created a CRT-inspired aesthetic with scanlines, glow effects, and distinct color identities for each extension while keeping a cohesive visual system. Global emissions data was normalized and mapped to dynamic color scales with animated live statistics.
Challenges
The biggest challenge was time. I started just 13 hours before the deadline, turning what should have been a full hackathon into a high-pressure sprint.
Other major challenges included normalizing country names for the world map, fixing dialog overflow and mobile scrolling issues, adapting to Manifest V3’s stricter architecture, maintaining design consistency across three extensions, and simulating realistic live data without external APIs.
Accomplishments
I built three fully working browser extensions in 13 hours, integrated an interactive emissions map covering 190+ countries, and designed a unique retro-futuristic UI that reinforces the sustainability message. I also implemented animated live dashboards, ensured accessibility and responsiveness, and delivered a complete project ecosystem including branding, documentation, and presentation-ready visuals—all solo.
What I learned
This project strengthened my skills in React Simple Maps, Manifest V3 extension architecture, Chrome extension APIs, advanced Tailwind styling, and accessible dialog management. On the design side, I learned how skeuomorphic interfaces and thoughtful animation timing can make complex concepts more approachable.
Most importantly, I learned that digital carbon footprints are real, measurable, and often overlooked—and that increasing user awareness is a powerful first step toward meaningful change.
What’s next
- Carbonated Tea: a Chrome extension that monitors RAM usage and notifies users when resource consumption gets excessive.
Built With
- css3
- html5
- javascript
- json
- jsx
- manifest
- next.js
- python
- tailwindcss
- vercel

Log in or sign up for Devpost to join the conversation.