Inspiration
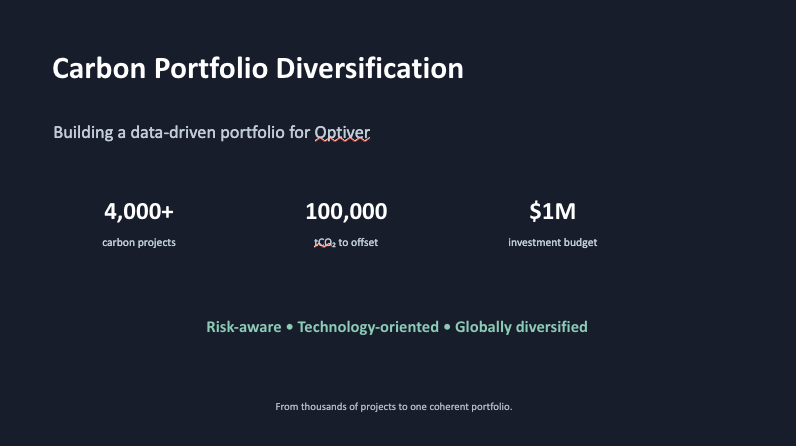
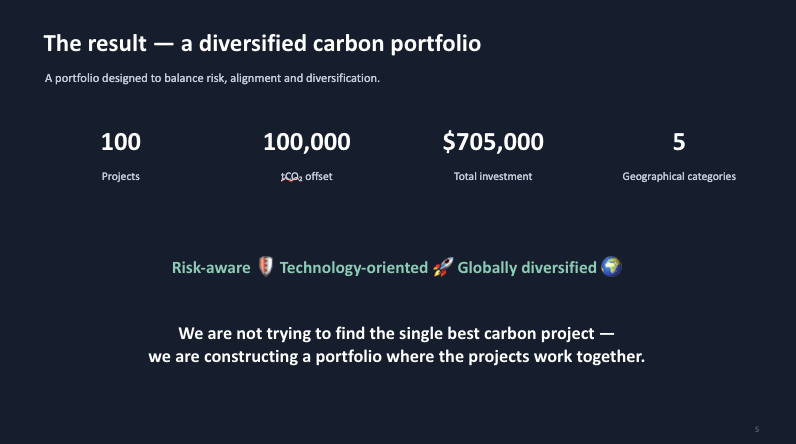
We wanted to create a data-driven, mathematically supported carbon portfolio rather than selecting projects based on a single metric such as price or available credits. Our goal was to quantify the characteristics that make a carbon project more attractive to Optiver, particularly risk, technological alignment, and geographical diversification, and use these measures to construct a portfolio capable of offsetting 100,000 tonnes of CO₂.
What it does
Our model takes a dataset of 4,000+ carbon projects and assigns each project a quantitative score based on its characteristics.
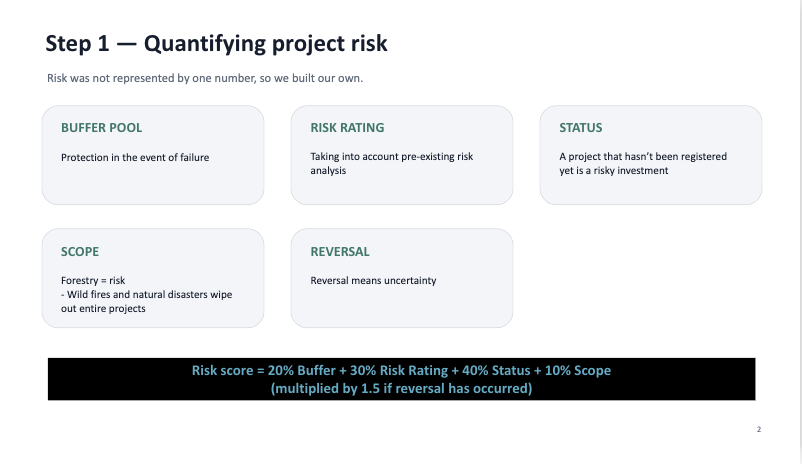
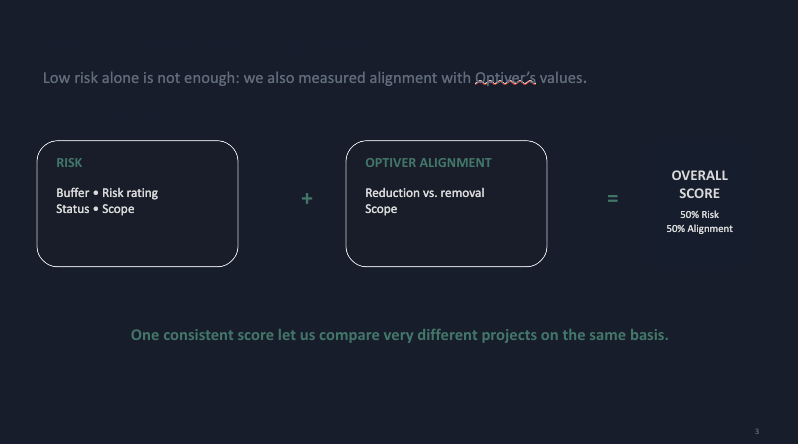
We first developed a risk score, using factors including buffer pool, risk rating, project status, scope, and reversal history. We then developed an Optiver alignment score, considering reduction/removal and scope.
These scores were combined into an overall “goodness” score, allowing us to rank projects according to our criteria.
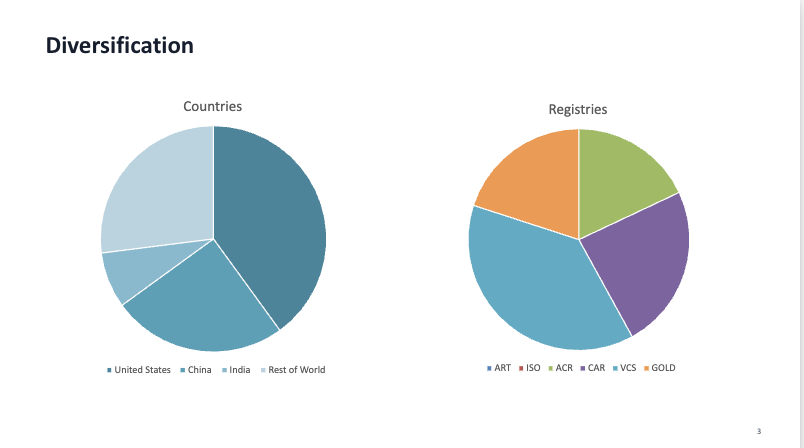
Finally, we used the rankings alongside global carbon emissions by geography to construct a diversified portfolio of approximately 100 projects, targeting 100,000 tonnes of CO₂ while staying within a $1 million investment budget.
How we built it
- Cleaned and analysed the dataset of 4,000+ carbon projects using Python's CSV library.
- Categorised and ranked risk factors from lower to higher risk.
- Created a weighted risk calculation:
- 20% Buffer Pool
- 30% Risk Rating
- 40% Status
- 10% Scope
- Created an Optiver alignment score using reduction/removal and scope.
- Combined risk and alignment into our overall goodness score, weighted equally.
- Ranked projects according to their scores.
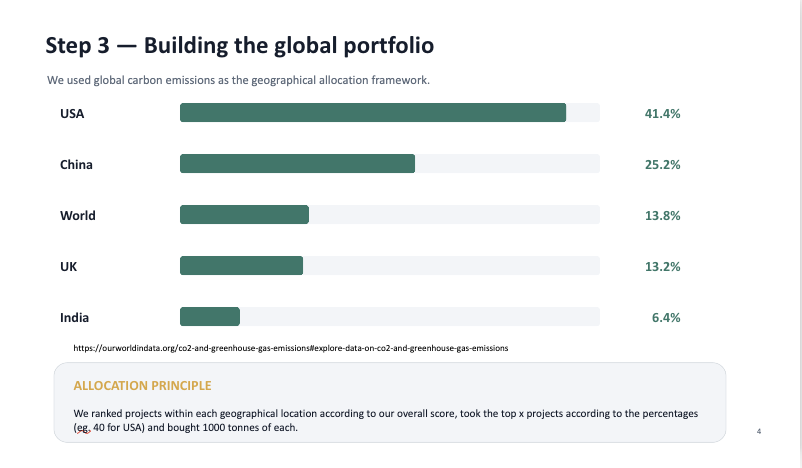
- Used global emissions data to determine our geographical allocation:
- USA: 41.4%
- China: 25.2%
- World: 13.8%
- UK: 13.2%
- India: 6.4%
- Selected projects within each region to create a diversified portfolio targeting 100,000 tCO₂.
Challenges we ran into
One of our biggest challenges was deciding what to prioritise and how to rank different variables. We addressed this by researching what each category represented and understanding how it affected both project risk and its value to Optiver.
We also had to balance multiple objectives simultaneously, rather than simply selecting the projects with the highest individual scores.
Accomplishments that we're proud of
We are proud that we transformed a dataset of 4,000+ projects into a structured portfolio-selection framework, rather than relying on a single variable.
We also created a methodology that is transparent and explainable: every project's score can be traced back to its underlying characteristics and the weights we assigned.
Most importantly, we were able to reach our 100,000 tCO₂ target while spending only around 70% of the available budget. This leaves approximately 30% of the budget as a reserve, providing flexibility if projects underperform or fail to deliver their expected credits.
What we learned
We learned that optimisation is rarely about maximising one variable. A portfolio can look excellent according to one metric while performing poorly when other constraints are considered.
We also learned how important weighting and assumptions are in data-driven decision making. Changing the relative importance of risk, alignment, or geography can substantially change the resulting portfolio.
Finally, we learned that mathematical scoring makes complex decisions more transparent and testable, without pretending that subjective decisions have disappeared.
What's next for Carbon Portfolio Diversification
Our next step would be to build a more advanced portfolio optimisation model incorporating price, credit delivery, uncertainty, and project correlations.
This would allow us to move beyond ranking individual projects and optimise the portfolio as a whole under real-world constraints.

Log in or sign up for Devpost to join the conversation.