We Built an AI-Powered Carbon Emissions Analyzer for 20 US Cities in a Hackathon
Tags: python react ai hackathon
Cities are passing ambitious climate laws. Building owners are getting fined. And almost nobody has a clear picture of where they actually stand.
That was the gap we wanted to close at EcoHack 2026. The result was CarbonLens — a full-stack platform that combines real emissions data, a RAG-powered AI analyst, and interactive city comparisons to help planners, sustainability officers, and researchers make sense of urban carbon compliance.
Here is how it came together, what broke along the way, and what we would do differently.
The Problem Worth Solving
Laws like NYC's Local Law 97, Boston's BERDO 2.0, and DC's Building Energy Performance Standards are already in effect. Non-compliant buildings face real financial penalties. Under LL97, for example, fines scale linearly with excess emissions:
$$\text{Fine} = (\text{Actual Emissions} - \text{Limit}) \times \$268 / \text{tCO}_2\text{e}$$
Despite the stakes, most people working in this space are navigating dense compliance documents manually, with no easy way to benchmark their city, compare performance, or get plain-language answers to specific questions.
We wanted to fix that with a single, approachable interface.
What CarbonLens Does
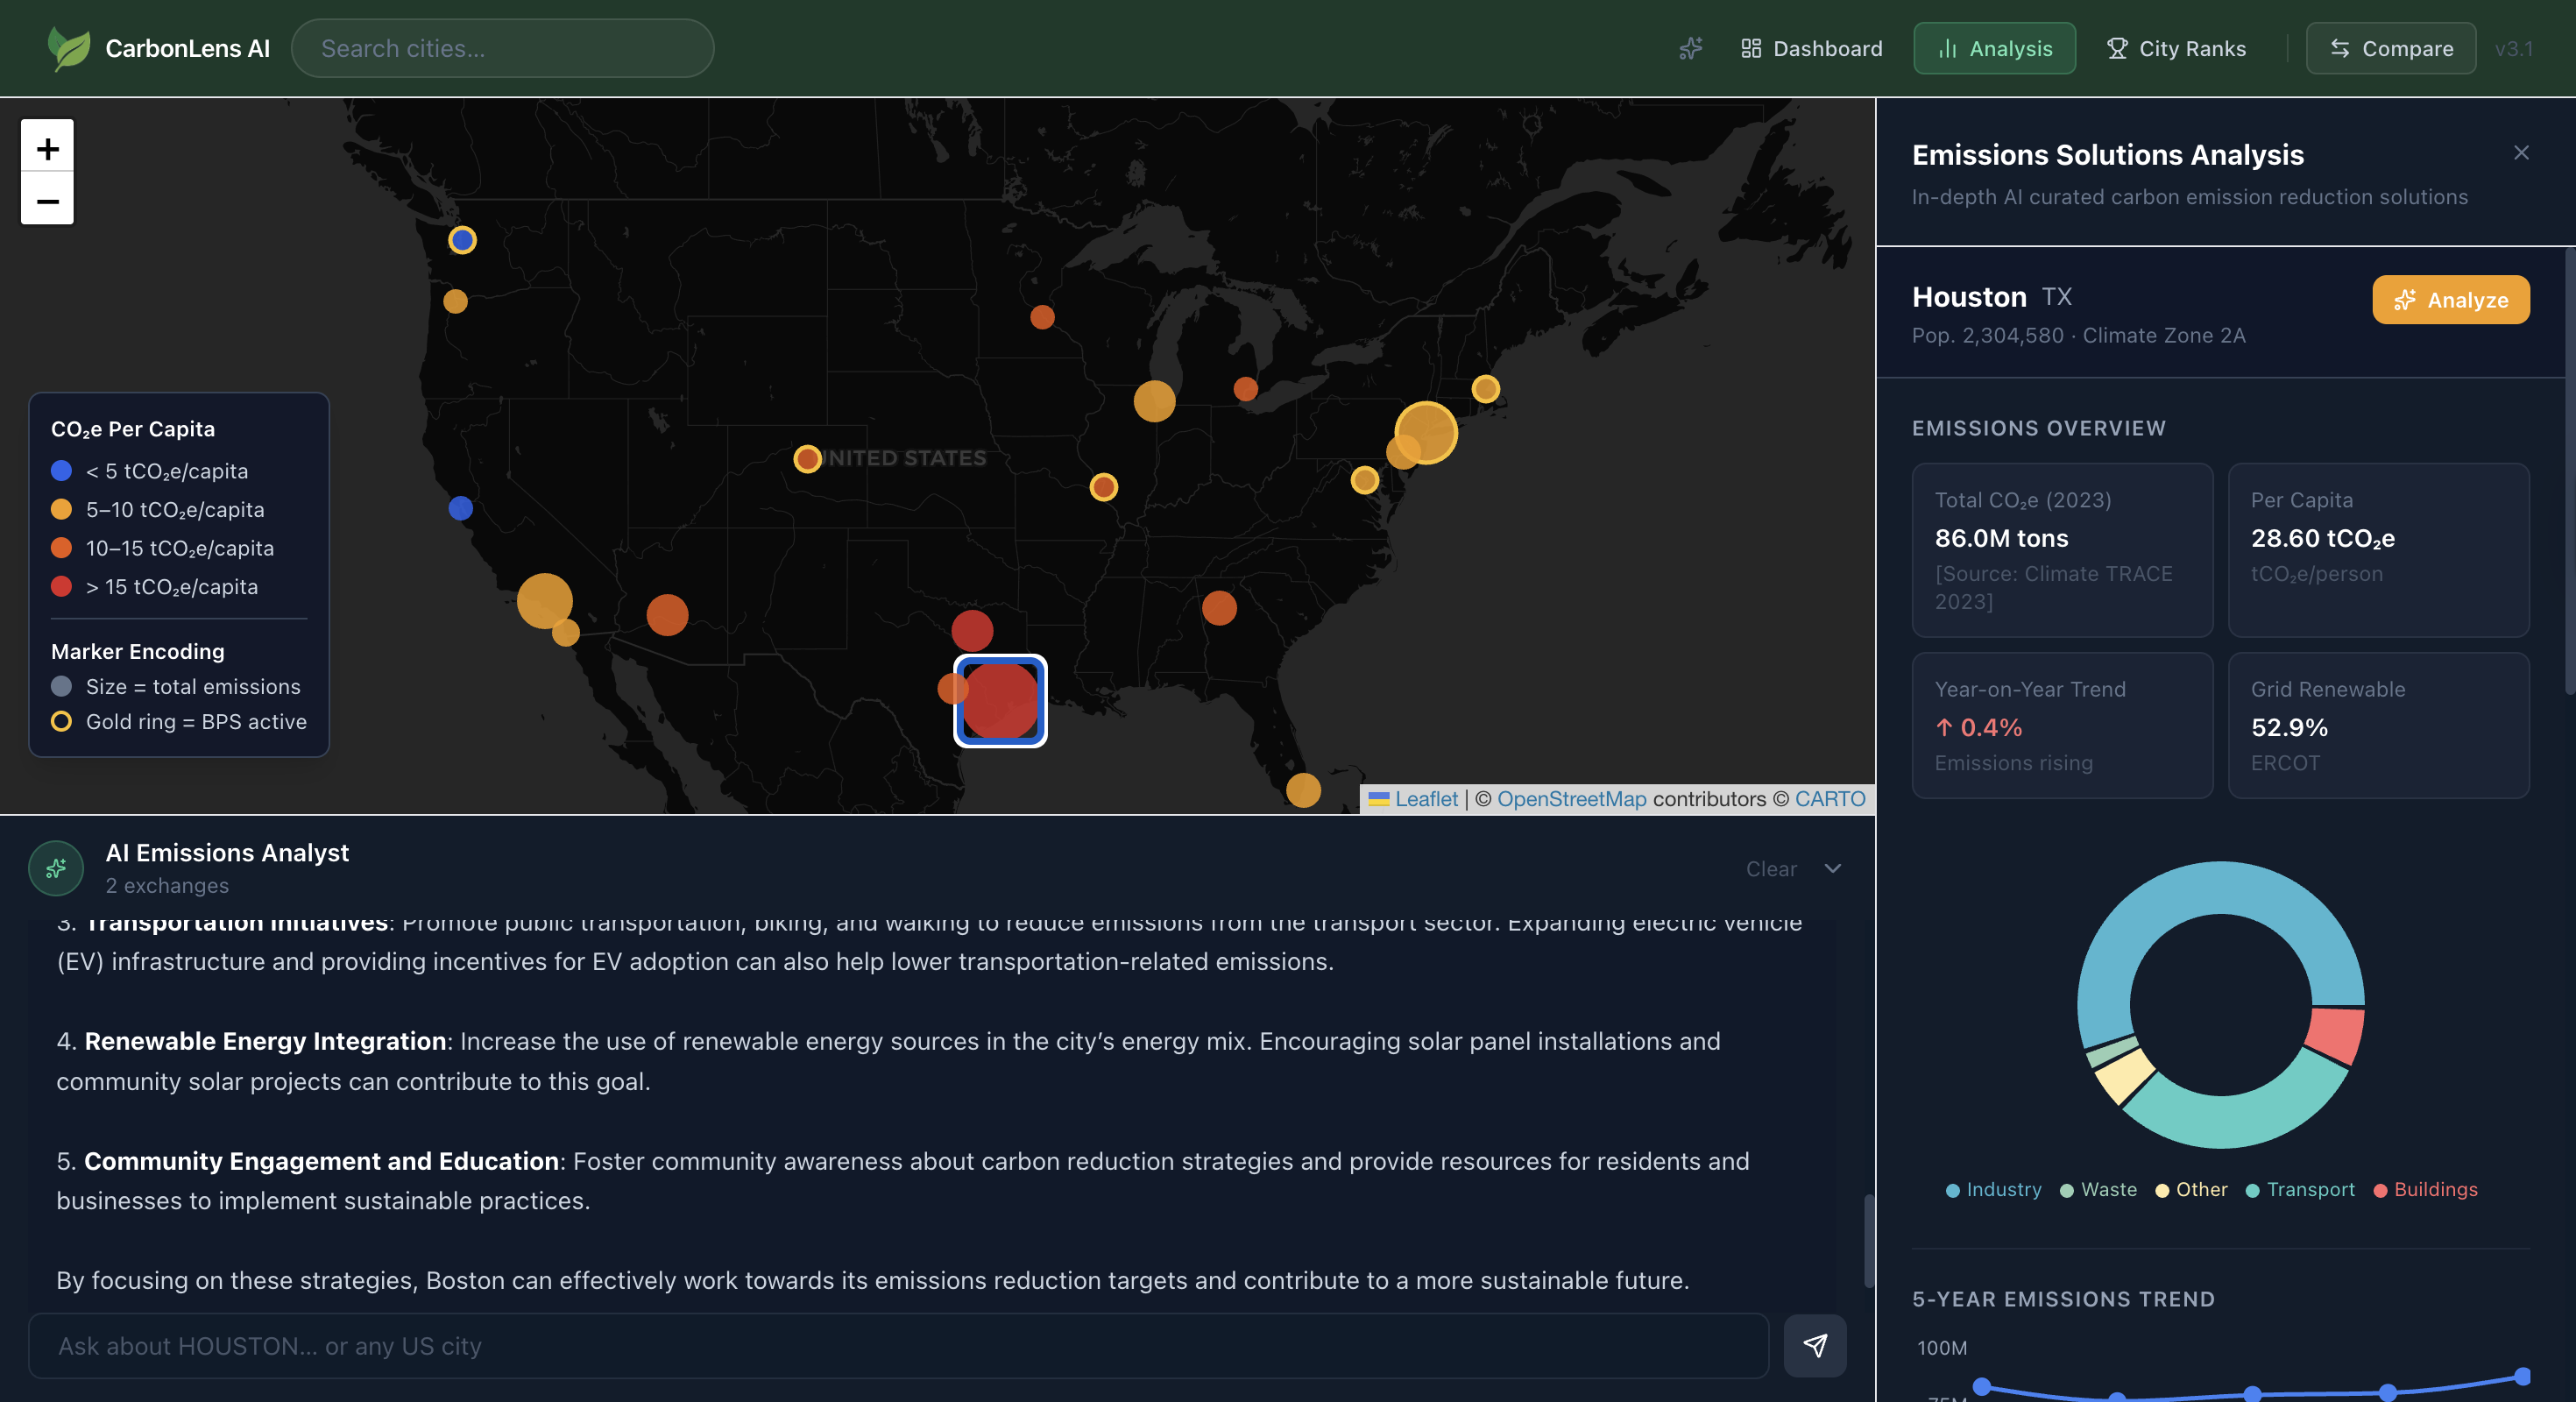
- Interactive emissions map across 20 major US cities with sector-level CO2e breakdowns (Buildings, Transport, Industry, Waste)
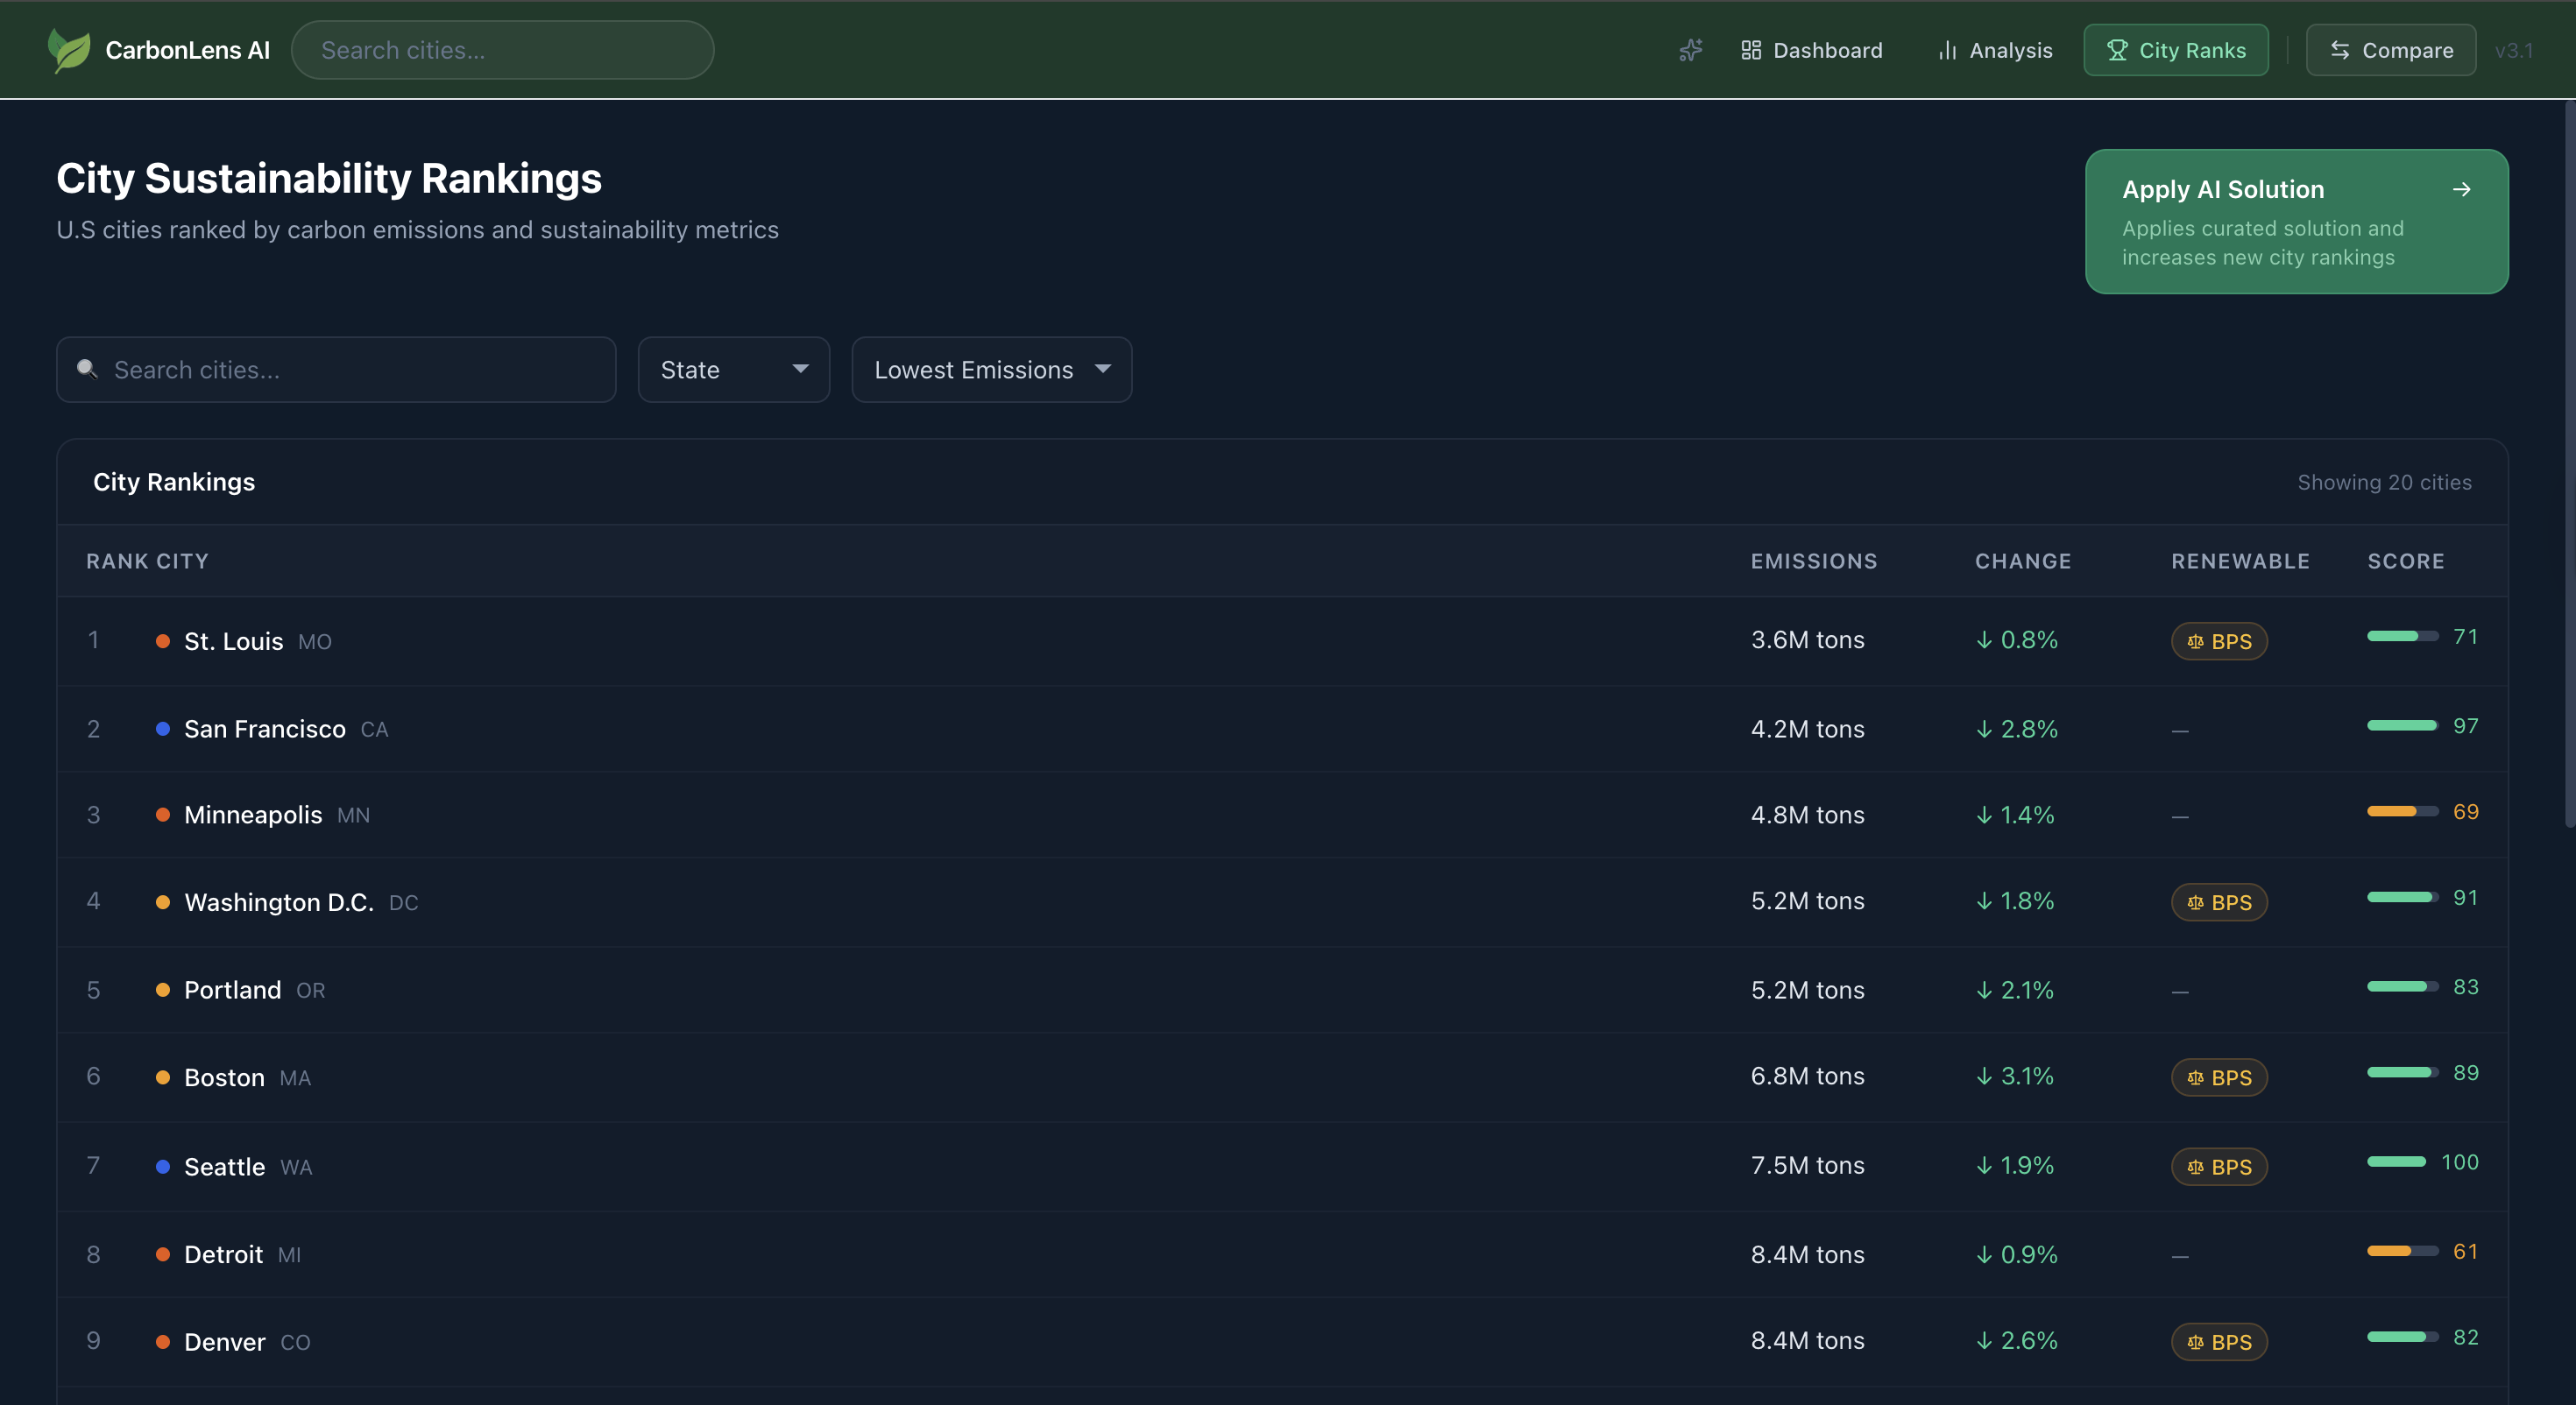
- Building Performance Standards tracker showing live compliance status against LL97, BERDO 2.0, DC BEPS, Denver Energize Denver, and more
- AI Emissions Analyst — a multi-turn chat grounded in 18 real compliance documents via RAG
- AI-generated decarbonization recommendations ranked by estimated impact
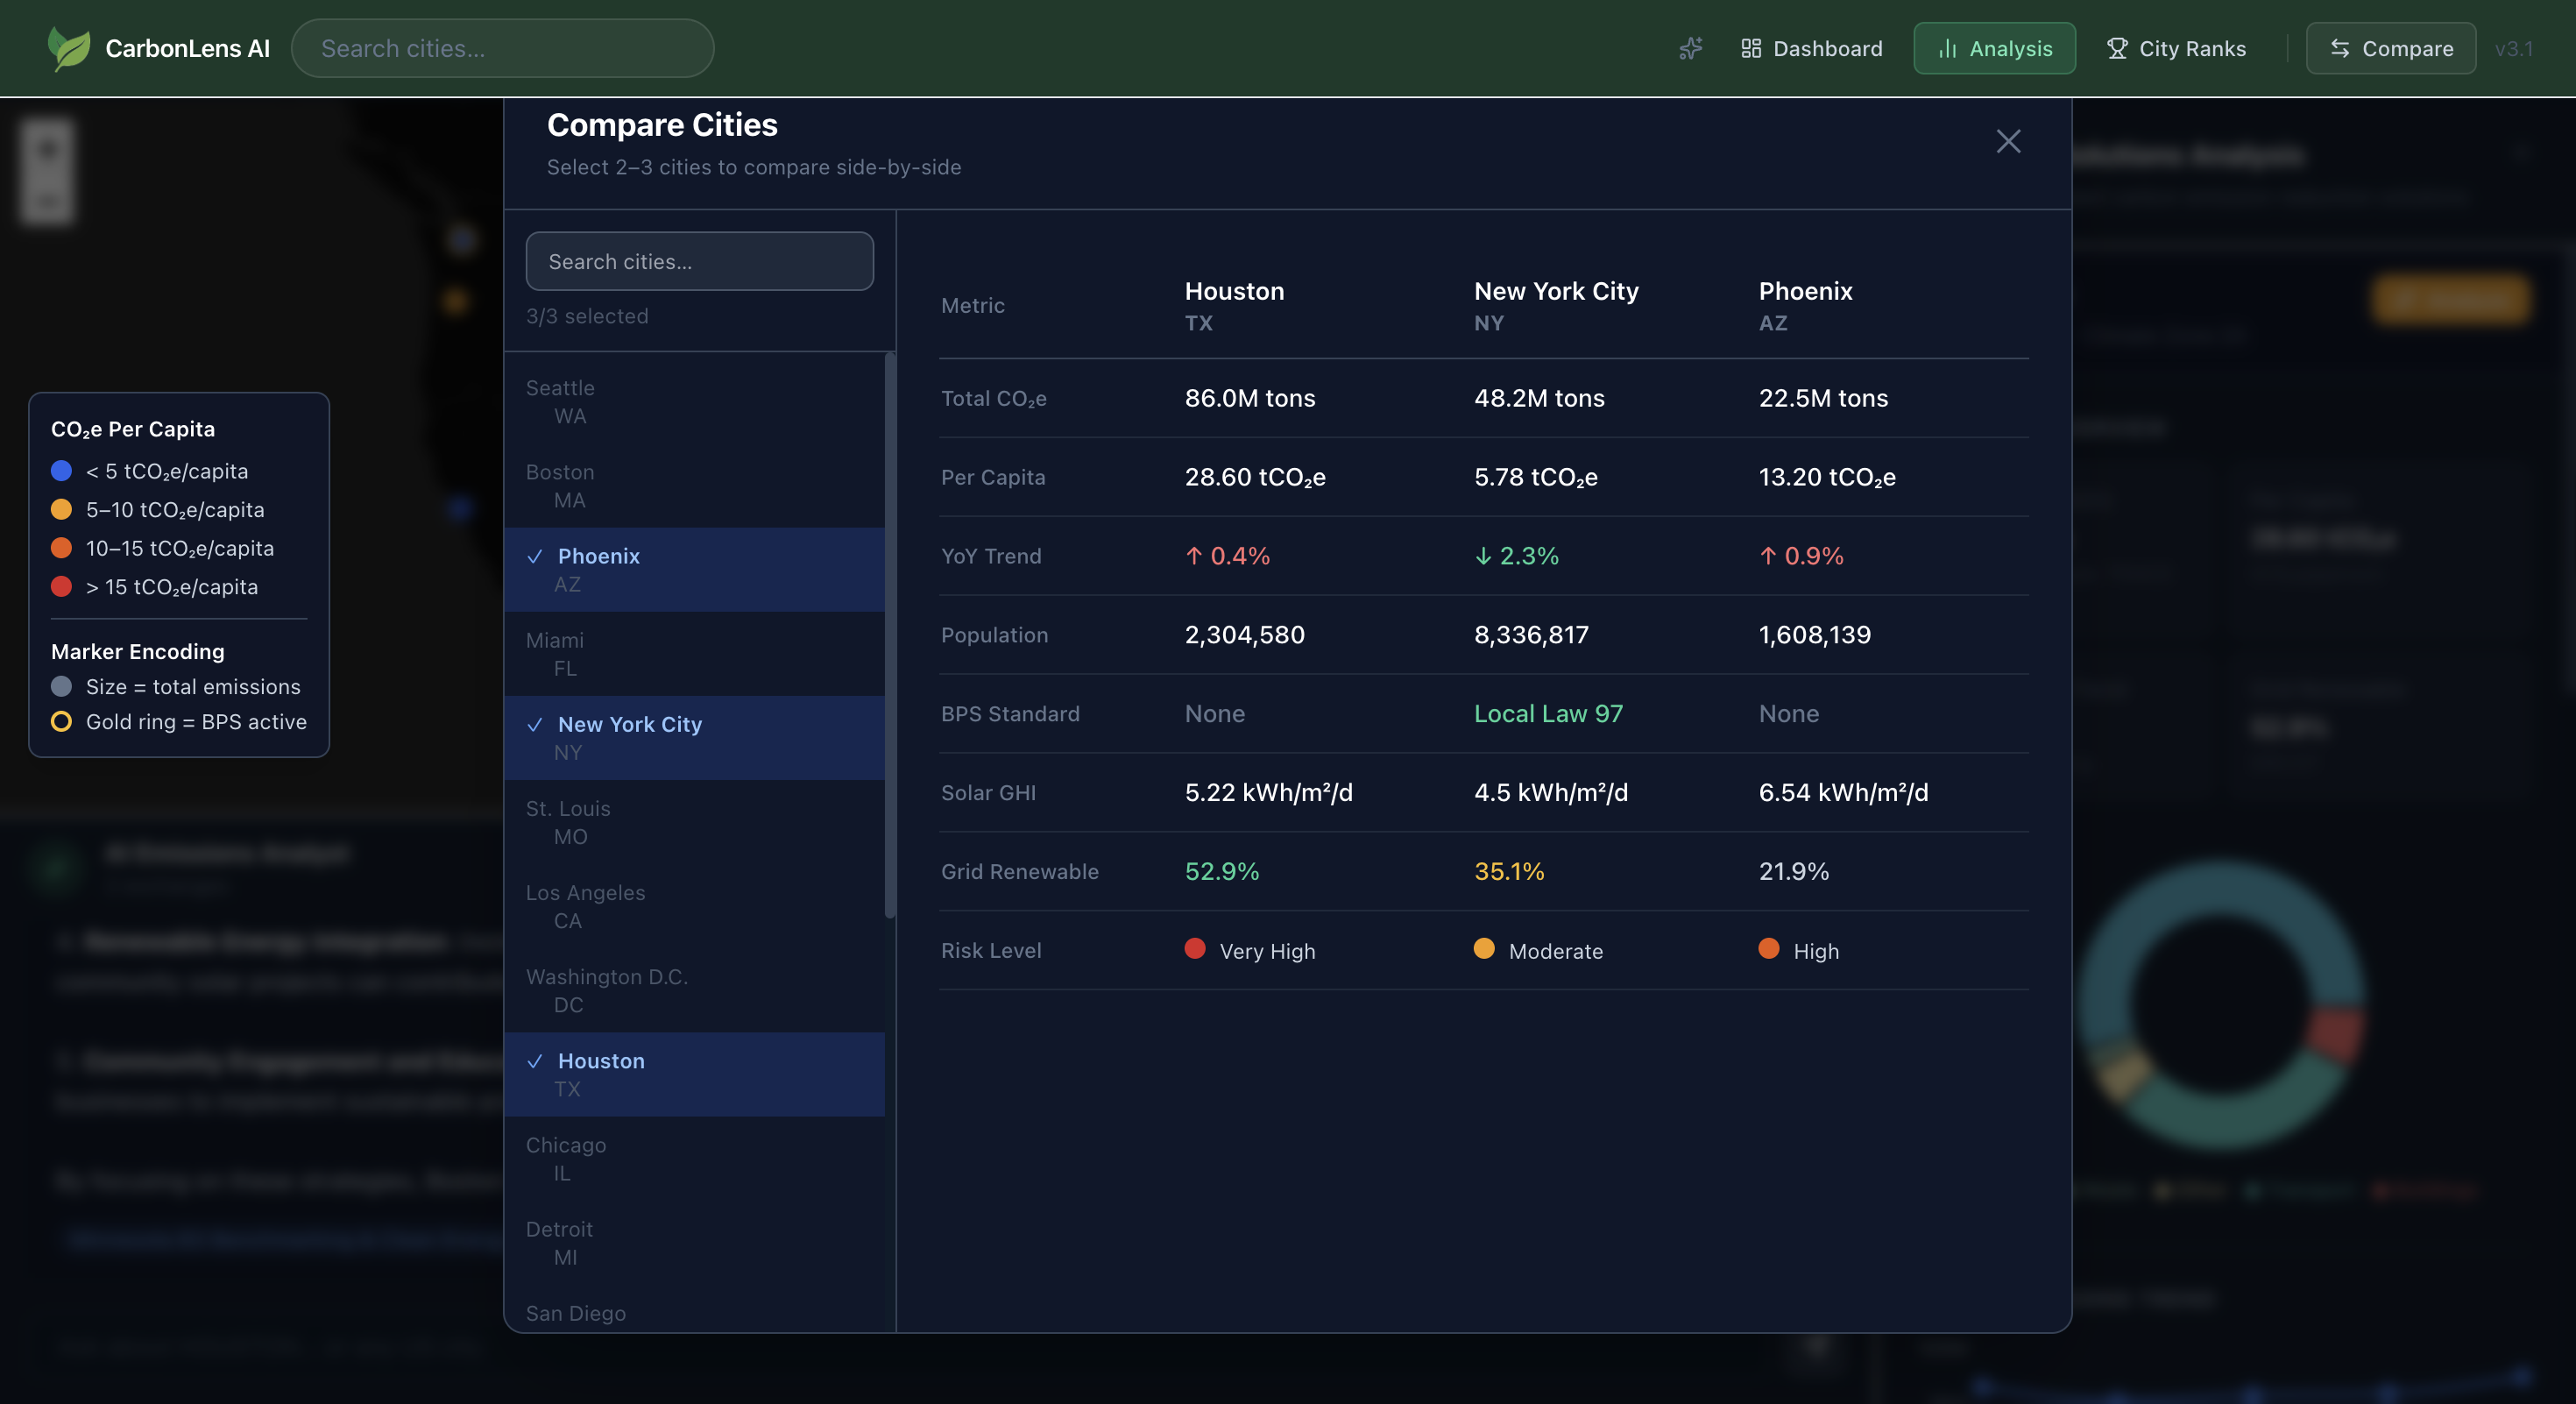
- Side-by-side city comparison for up to 5 cities
- What-if scenario sliders for projecting emissions reductions
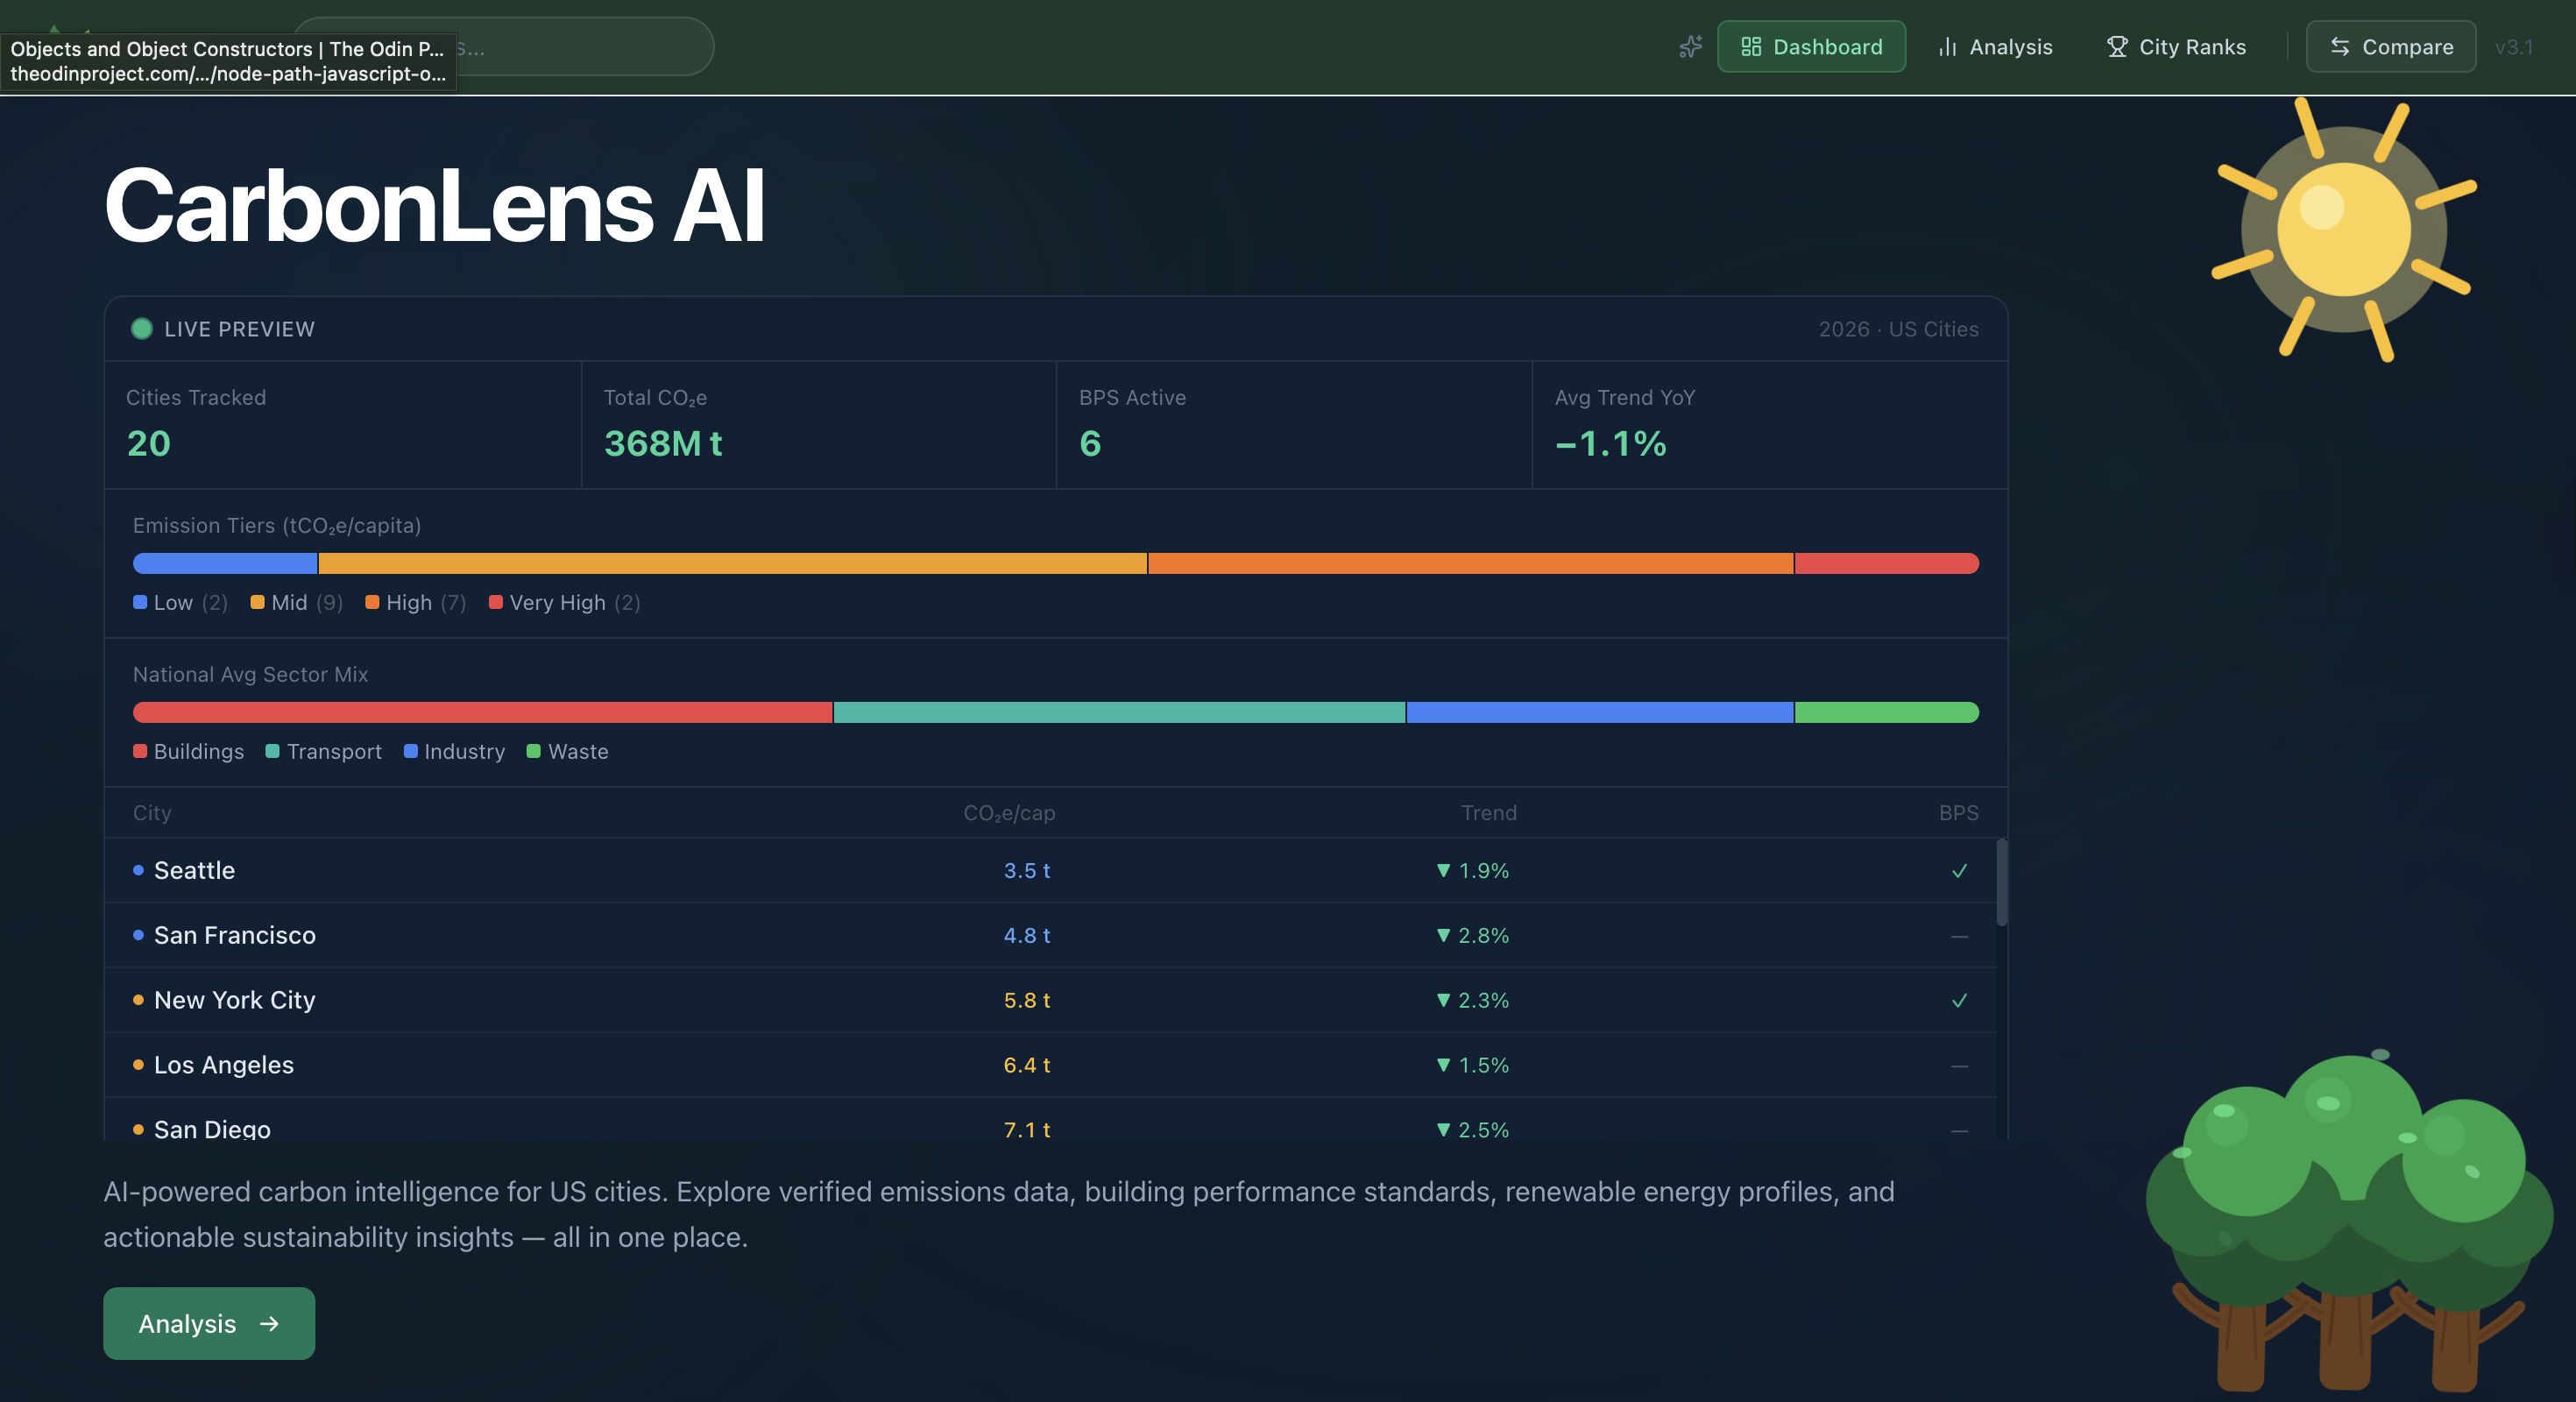
- 5-year historical trend charts (2019–2023)
- Full offline demo mode with mock data — no backend required
The Stack
| Layer | Technology |
|---|---|
| Frontend | React 18, Vite, Tailwind CSS, Recharts, React Leaflet, GSAP |
| Backend | FastAPI, Python 3.x, Uvicorn |
| Database | MongoDB Atlas (Motor async driver) |
| Vector Store | ChromaDB (local) |
| AI — Chat | OpenAI GPT-4o-mini |
| AI — Recommendations | Google Gemini 2.0 Flash Lite |
| Data | Climate TRACE API v7, NREL API, EIA API |
The Part That Actually Took the Most Time: Data Cleaning
Before any model or visualization was built, we had to deal with the data — and it was messier than expected.
We were pulling city-level emissions from three separate sources: Climate TRACE for sector breakdowns, NREL for renewable energy potential, and EIA for grid carbon intensity. In theory, those three sources together give a complete picture. In practice, coverage was inconsistent across all 20 cities.
Some cities had partial sector data. Others had records from different reporting years that did not align. Units were inconsistent. Some emission categories were simply missing with no explanation.
The total emissions model looks clean on paper:
$$E_{\text{total}} = E_{\text{buildings}} + E_{\text{transport}} + E_{\text{industry}} + E_{\text{waste}}$$
But when your source data has gaps in one or more of those terms for a given city, you have a problem. We spent a significant portion of the project cross-referencing sources, filtering out unreliable data points, normalizing units, and in cases where primary data was unavailable, using regional averages as conservative fallback estimates.
It was tedious work, but it was also the most important work. Everything downstream — the map, the comparisons, the AI recommendations — is only as trustworthy as the data feeding it.
Building the RAG Pipeline
The AI Emissions Analyst was the feature we were most excited about. The goal was a chat interface that could answer specific compliance questions — grounded in actual policy documents, not hallucinated generalities.
The pipeline works like this:
$$\text{Query} \xrightarrow{\text{embed}} \vec{q} \xrightarrow{\text{cosine similarity}} \text{top-}k \text{ chunks} \xrightarrow{\text{GPT-4o-mini}} \text{grounded answer}$$
We ingested 18 documents into ChromaDB — everything from LL97 and BERDO 2.0 to ASHRAE 90.1, the EPA GHG Reporting Rule, and the Inflation Reduction Act.
The first version of the retrieval was poor. We had chunked the PDFs at fixed token intervals, which meant paragraphs were getting split mid-sentence and context was being lost. Switching to semantic chunking — breaking at actual section and paragraph boundaries — made a noticeable difference in retrieval quality.
One other gotcha: ChromaDB persistence across FastAPI restarts. Early on, the vector store was being re-initialized on every server start, which wiped the index. The fix was straightforward once we understood the issue — initialize the collection inside the FastAPI lifespan hook, not at module import time, and configure CHROMA_PATH explicitly in the environment.
Two AI Models, One Service Layer
For recommendations, we used Google Gemini 2.0 Flash Lite rather than GPT-4o-mini. The reasoning was practical: recommendations are generative and creative by nature, while compliance Q&A benefits from tighter grounding. Two different tasks, two different models.
Managing both under a single service layer meant handling different API contracts, different failure modes, and different prompt structures in one place. It added complexity but kept the rest of the application clean. If either model needs to be swapped out later, the surface area for change is minimal.
Keeping the Frontend Fast
Rendering 20 cities with sector breakdowns, 5-year trends, and compliance statuses simultaneously caused real performance issues in early builds. The solution was a combination of lazy loading city panels on demand and memoized selectors to prevent cascading re-renders when a single city's data updated.
We also added a full offline demo mode early in the build process. Setting VITE_USE_MOCK_DATA=true in the frontend environment swaps all API calls for a local mock dataset, giving the full UI experience with no backend dependency. This turned out to be invaluable — not just for demos, but for frontend development without needing a running server.
What Did Not Ship
The original design included a live BPS penalty calculator — enter your building's square footage and energy use, get a projected fine under LL97 or BERDO 2.0. The math is not complicated:
$$\text{Fine} = (\text{Actual Emissions} - \text{Limit}) \times \$268 / \text{tCO}_2\text{e}$$
But wiring it up correctly for multiple compliance regimes with different baseline years, exemptions, and phase-in schedules takes time we did not have. It is the first thing on the roadmap for a post-hackathon release.
What We Would Do Differently
Start data cleaning earlier. We underestimated how much time normalization and gap-filling would take. In a future project with multiple public data sources, we would build the data pipeline and validate coverage before writing a single line of application code.
Plan for multi-source data gaps from the start. Rather than treating missing data as an edge case, we would design the schema to explicitly track data confidence and source provenance per city and sector, so the UI can surface uncertainty to the user instead of silently falling back to estimates.
Chunk documents before the hackathon. Ingesting and testing 18 compliance documents during a time-constrained build was a mistake. Pre-processing the RAG knowledge base is the kind of work that should happen in preparation, not during active development.
Try It
The repository is public and includes a full offline demo mode that requires no API keys or backend setup.
git clone https://github.com/Tringuyen2007/CarbonLens
cd CarbonLens/client
npm install
echo "VITE_USE_MOCK_DATA=true" > .env.local
npm run dev
Open http://localhost:5173 and the full UI is available immediately.
Full setup instructions for the live stack — including MongoDB, ChromaDB, and all three data APIs — are in the README.
Built for EcoHack 2026. MIT License.
Built With
- climatetraceapi
- css
- gemini
- gsap
- html
- javascript
- leaflet.js
- mongodb
- openai
- python
- react
- restapi
- tailwindcss

Log in or sign up for Devpost to join the conversation.