Inspiration
Living in a region where climate action is personal, I wanted to turn overwhelming carbon data into something tangible. Watching friends struggle to understand their environmental impact sparked the idea: create a tool that’s visual, approachable, and rooted in real, actionable steps—no jargon, just clear paths to reduce footprint.
What it does
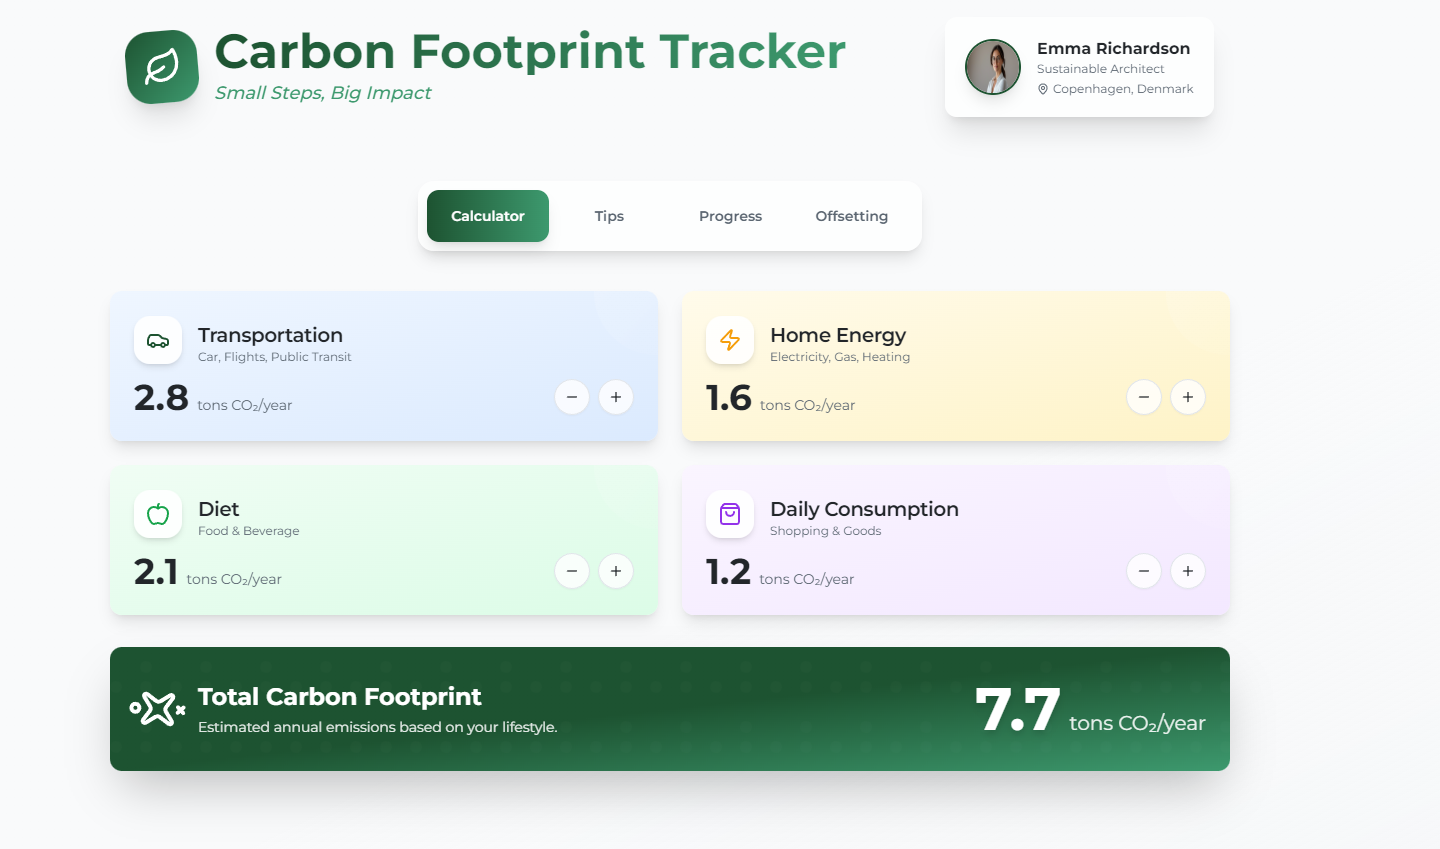
This carbon footprint tracker lets users measure emissions across daily life (transport, energy, diet, consumption), get tailored tips to cut impact, track progress toward sustainability goals, and explore offset projects to balance remaining emissions. Every feature is designed to make eco-action feel achievable, not daunting.
How we built it
I started with Figma to map the nature-aligned UI (forest greens, teals, warm accents) and responsive layout. Using HTML5/CSS3 (TailwindCSS) for structure, I integrated GSAP for smooth animations—from the hero’s floating leaf effect to staggered tip card entrances. React handled tab navigation, and SVG.js brought progress rings/badges to life. Testing across desktop/mobile ensured usability for all devices.
Challenges we ran into
The biggest hurdle was balancing animation polish with performance—too many effects caused lag on mobile. I optimized by canceling animations mid-tab switch and using hardware-accelerated transforms. Aligning gradient styles (progress rings, CTAs) across browsers also took trial-and-error to ensure consistency.
Accomplishments that we're proud of
Creating a UI that feels immersive yet lightweight—users focus on their eco-goals, not clunky design. The animated progress ring and counter (for total footprint) turned static data into an engaging story, and the responsive layout works flawlessly from 手机 to desktop. Most importantly, it makes climate action feel personal and achievable.
What we learned
I deepened my understanding of web animation performance and responsive design edge cases. More importantly, I learned that accessibility and simplicity matter most—eco-tools fail if they’re hard to use. I also refined how to translate complex sustainability data into relatable, visual storytelling.
What's next for This project
First, add personalized goal-setting (let users input their own targets). Then, integrate local offset projects (EU/North America-focused) to make impact hyper-local. Finally, add a simple logging feature so users can update their footprint over time—turning a static tool into a long-term eco-journey companion.

Log in or sign up for Devpost to join the conversation.