-
-
Logo
-
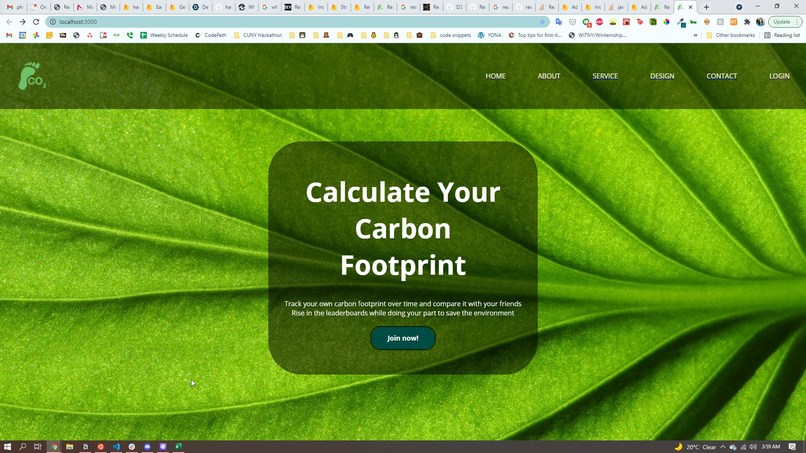
Homepage
-
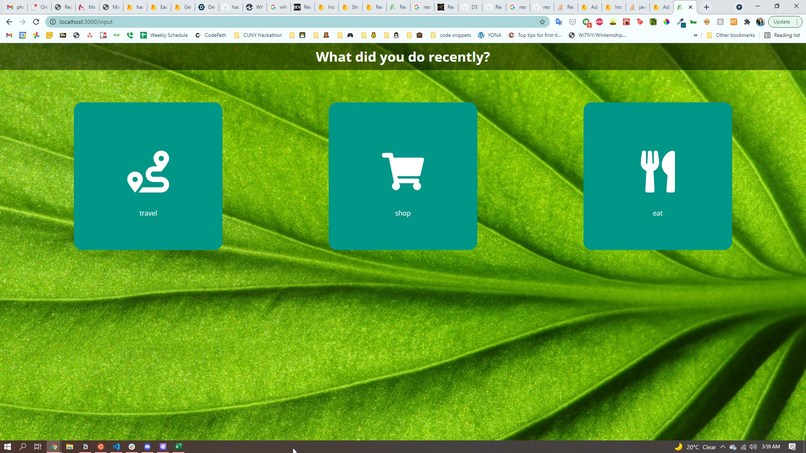
The 1st screen of the input user flow; users manually input their activity, but we emphasized a quick, easy and intuitive UX.
-
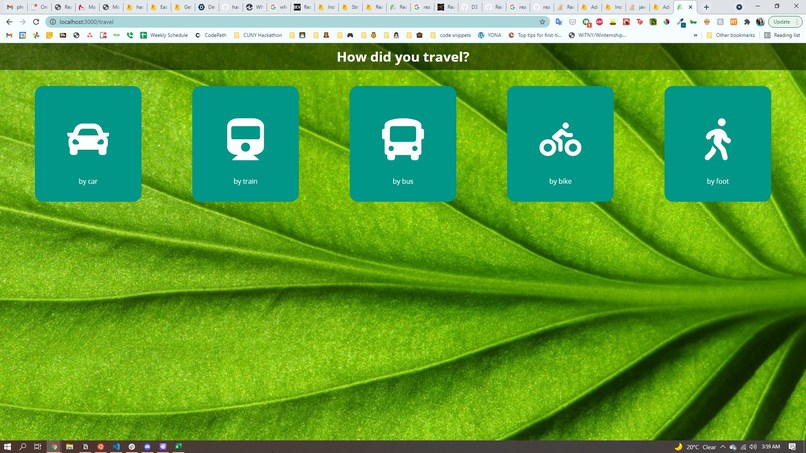
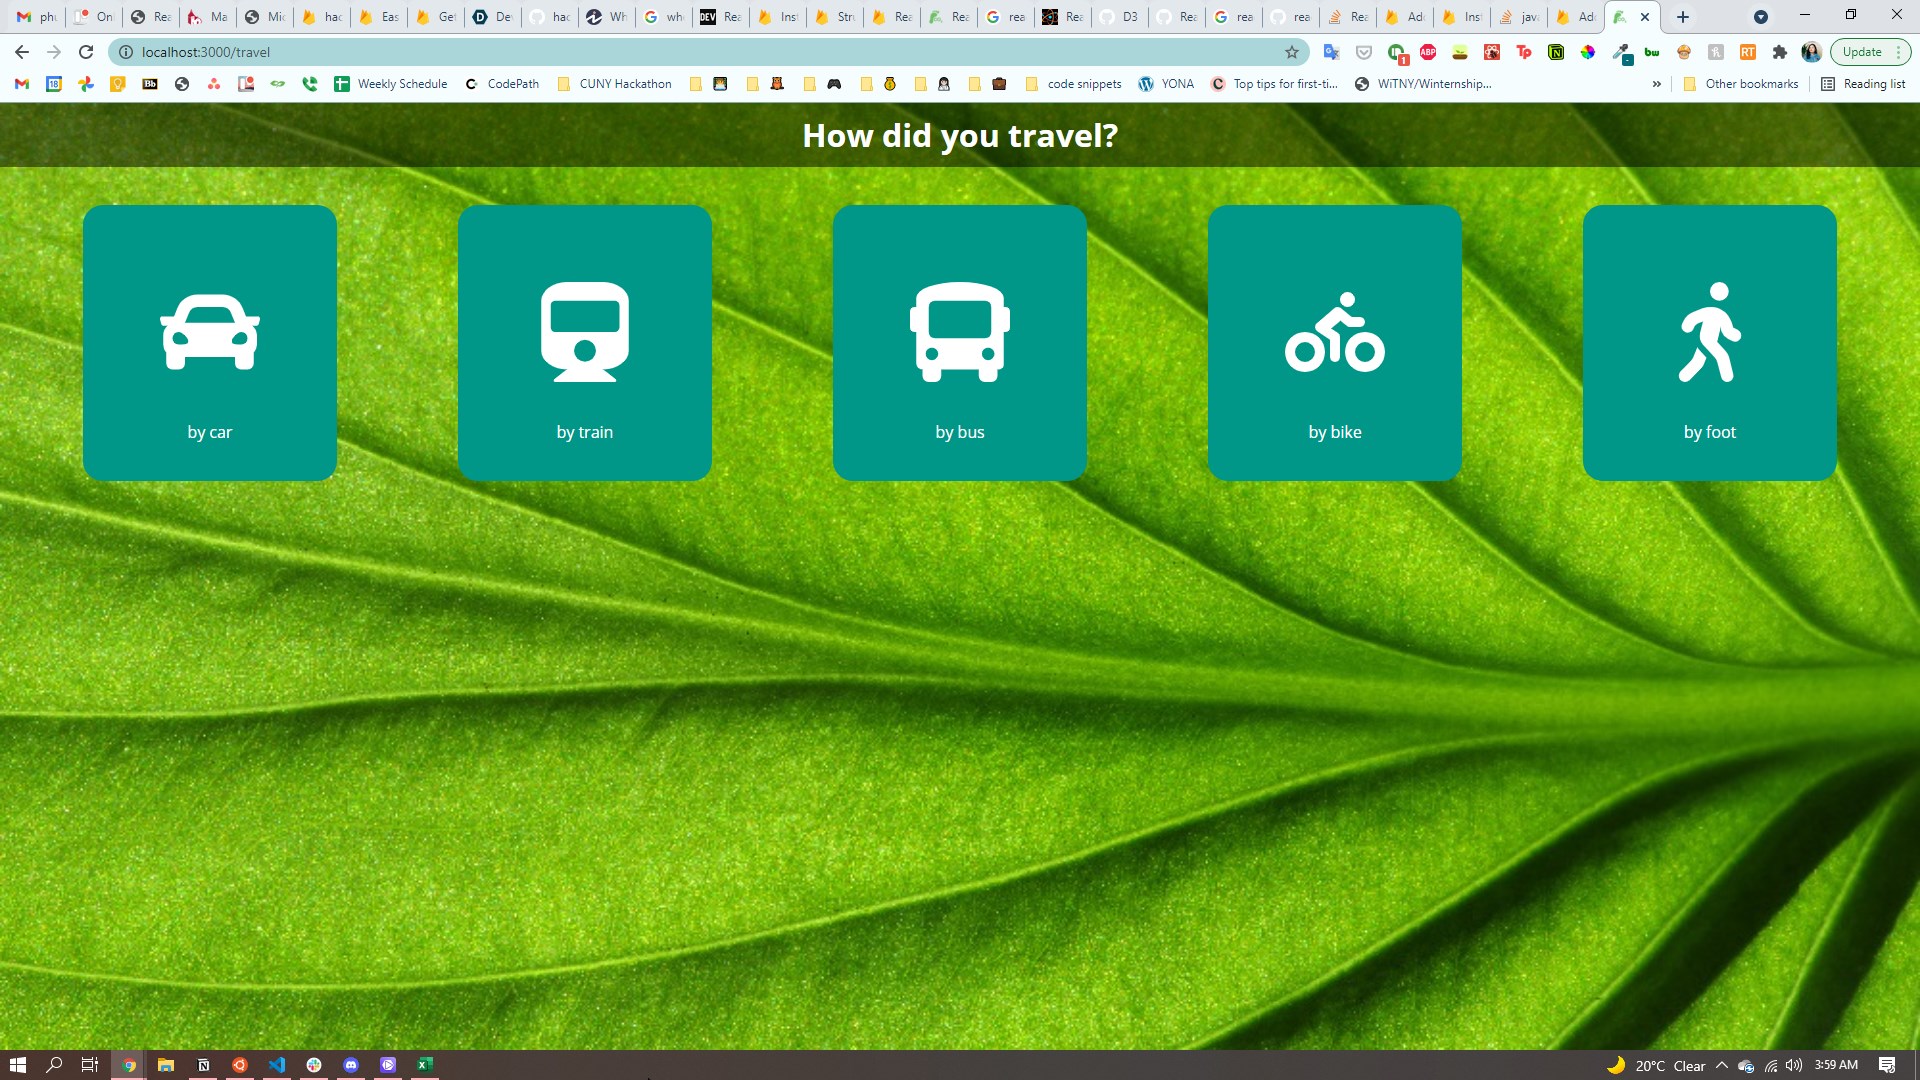
The 2nd screen of the input user flow if 'travel' was selected; we chose large straightforward buttons to encourage users to track regularly
-
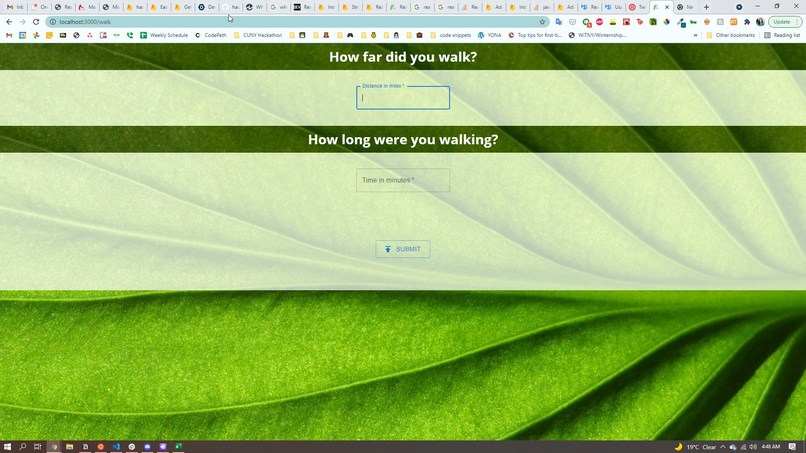
The 3rd screen of the input user flow if 'by foot' was selected; this is the only time that users type in a value, minimizing the effort.
-

Interactive line graph with slider to display user data


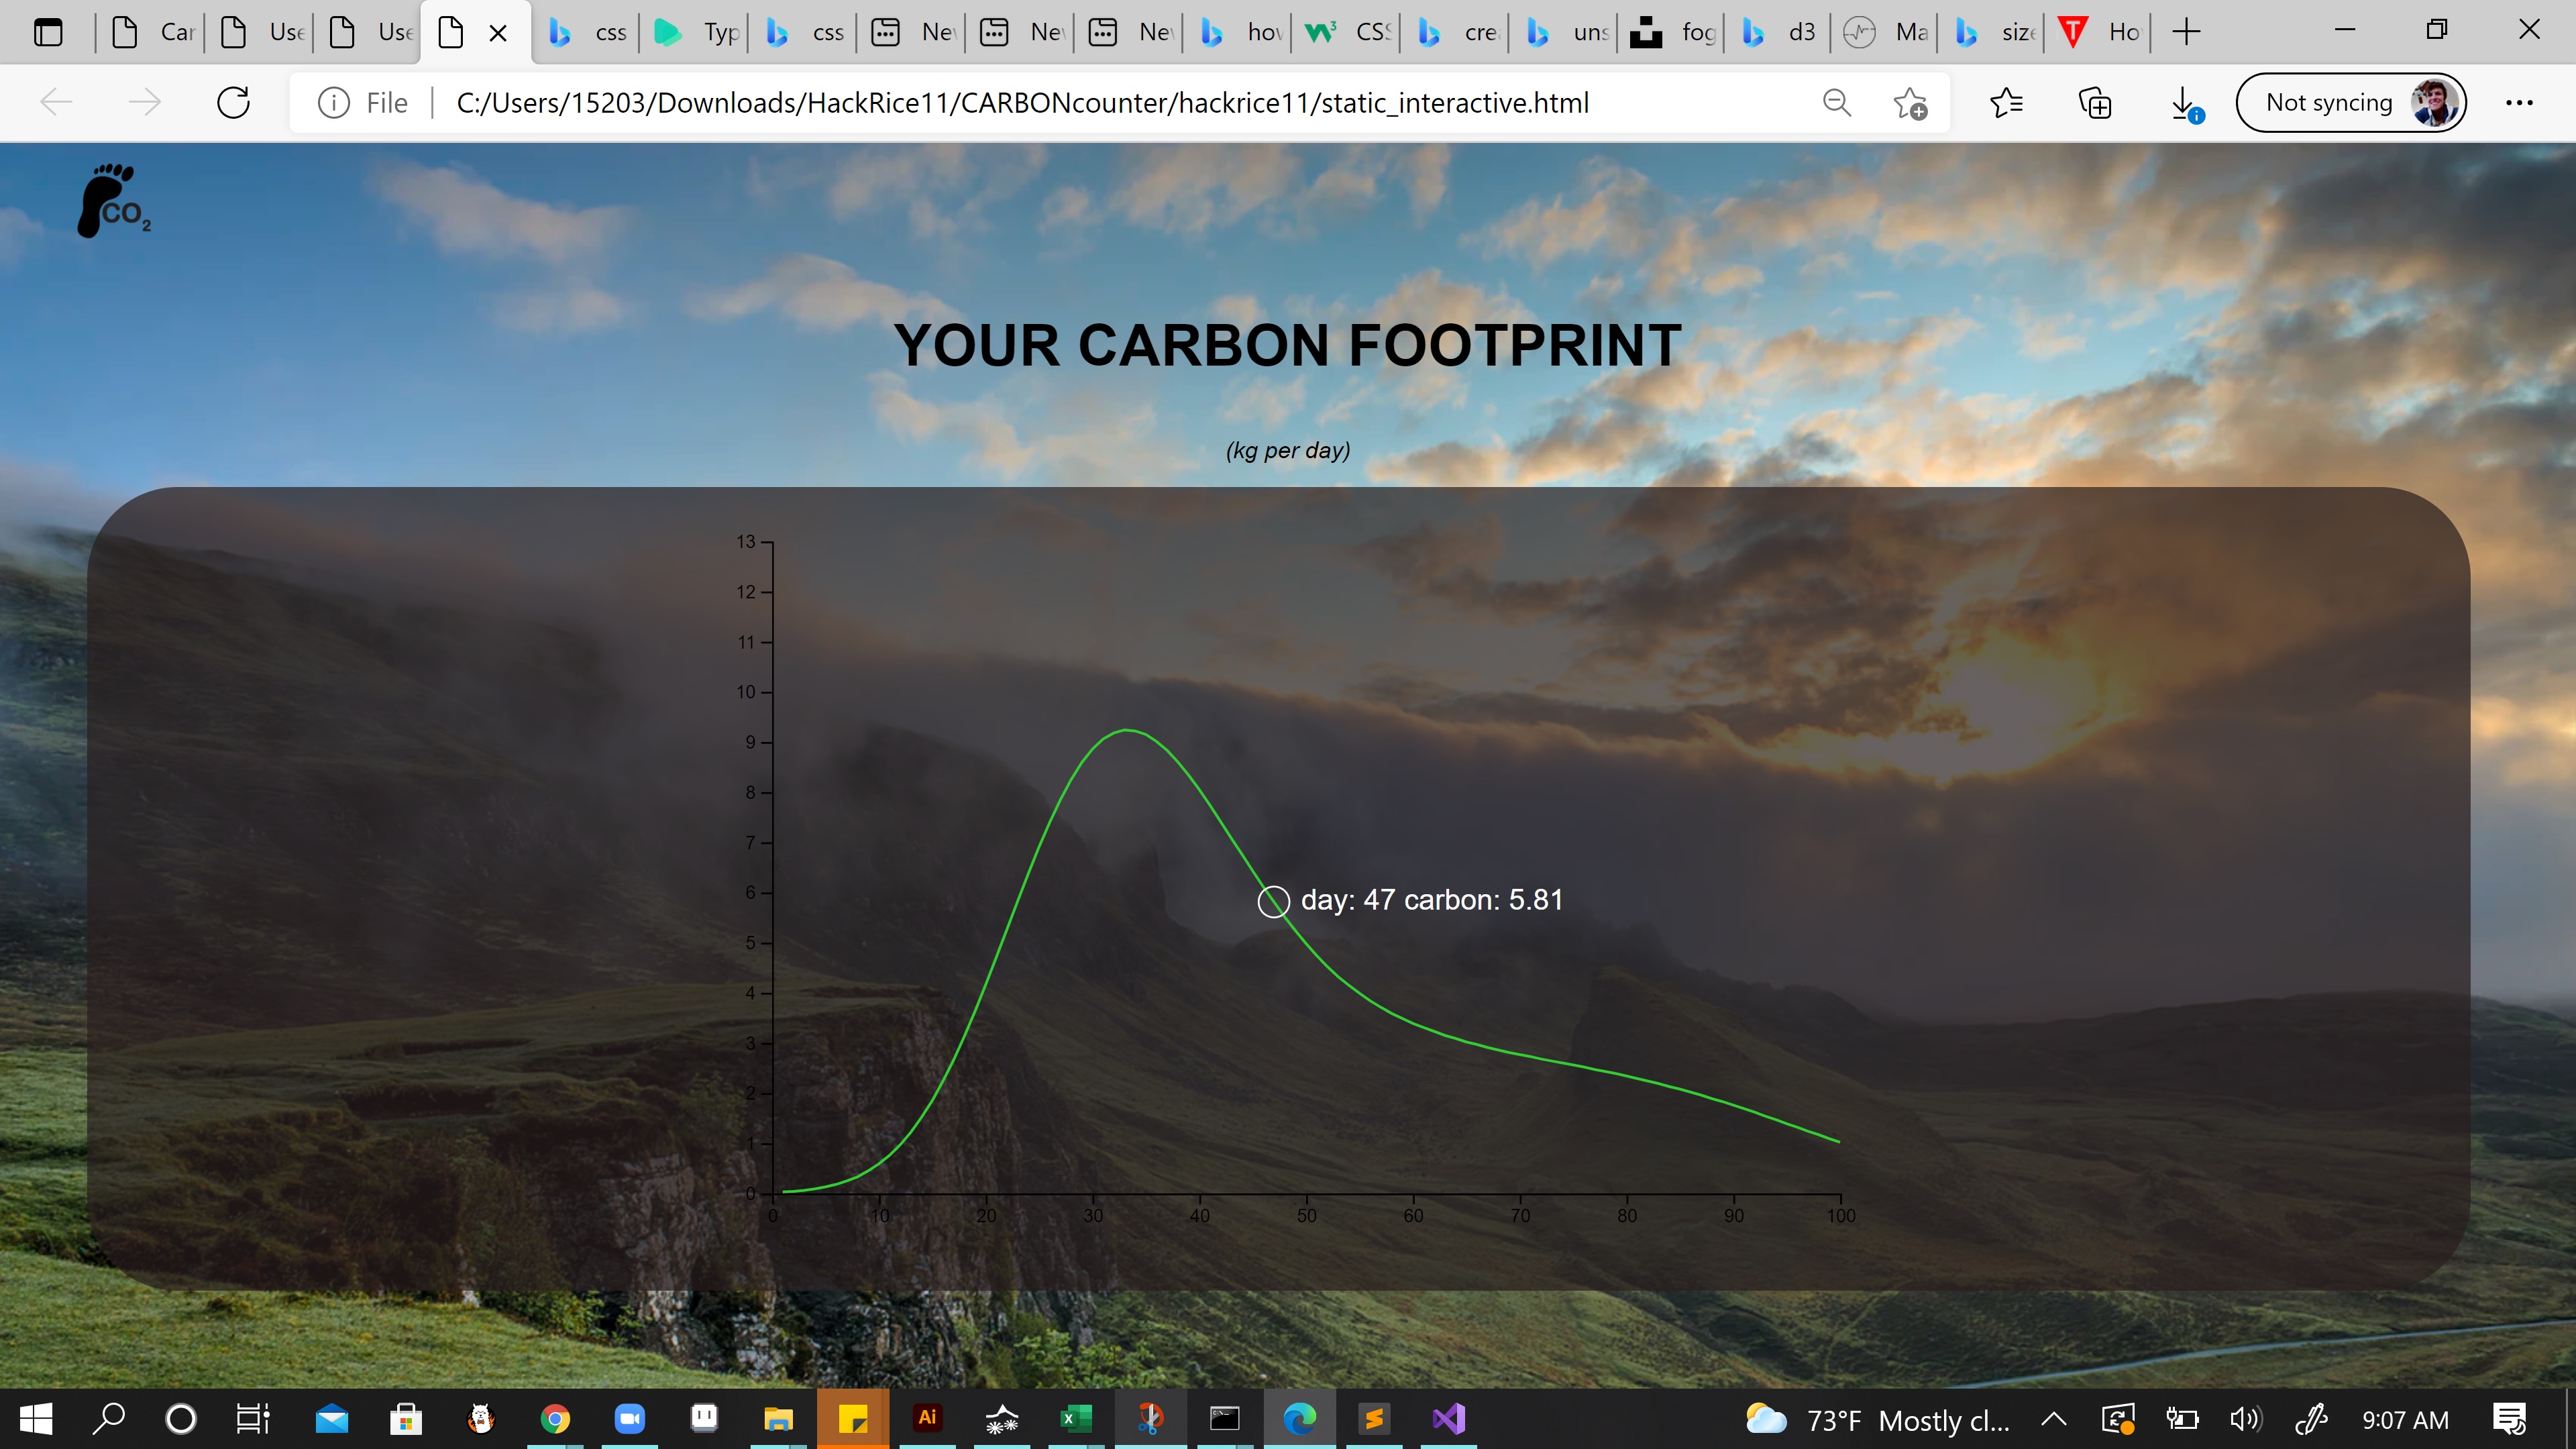
TLDR
You'd take a short quiz to determine your yearly carbon footprint. That gets used to determine the baseline of your ticker, whose graph you can use to track your daily, weekly, and monthly carbon emissions. You can then compare your ticker with those of your friends on a leaderboard. You will be texted if your footprint is significantly bad, and will receive suggestions on how to improve it.
Inspiration
We wanted to create a product that would encourage users to care about environmental sustainability and do their part to save the planet. We wanted to bring a unique spin to a typical carbon footprint calculator, so we ...
What it does
... decided to track that carbon footprint over time and allow users to view their friends' footprint as well. This leverages people's competitive spirit and the positive reinforcement that comes with seeing the improvement of that score. The carbon footprint ticker is reminiscent of stock tickers, which emphasizes the notion that addressing environmental issues is an important investment for the world that future generations will inherit.
How we built it
We used React.js and D3.js for the frontend and Firebase Realtime Database, Authentication, and Hosting. The user interface features quick, easy, and intuitive onboarding and manual data entry so as to optimize the user experience. We used large buttons with clear icons to minimize having to create the entry manually. The graphs are dynamic and animated. The database receives the input of the user (what they did that contributes/diminishes their carbon footprint) along with when the entry was made. Users can log in with an email and password or with their Google account.
Challenges we ran into
We did not have a lot of time to work on the project, so we did not in turn finish as much as we wanted to. We overestimated the work that went into the creation of the project. Some teammates used React for their pages, but others still chose to use HTML/CSS so those pages had to be refactored into React; we didn't finish this part. We also have some issues with React Router because it would go to the new link and the content exists, but we have to refresh the page for the changes to occur.
Accomplishments that we're proud of
The team did not know React nor Firebase at the start of this project. We barely even knew Javascript! But we wanted to try something new, learn, and grow. So we pushed past our comfort zone and used technologies that were new to us.
What we learned
Javascript, D3, React, Firebase, and teamwork!
What's next for Carbon Footprint Ticker
One of our original goals was to compete for the automation track and the Twilio challenge. We wanted the user to receive texts as alerts or suggestions on minimizing their carbon footprint. For example, a user could be alerted if their footprint rises too much in a given day or week; or they could be messaged with a Google Maps route link for walking or biking their commute instead of driving a car.


Log in or sign up for Devpost to join the conversation.