-
-
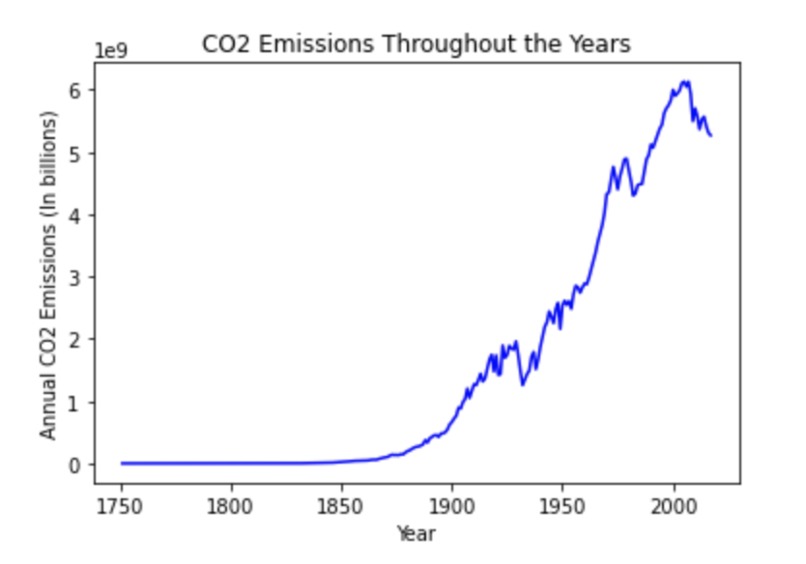
US Carbon Dioxide Emissions: 1751-2017
-
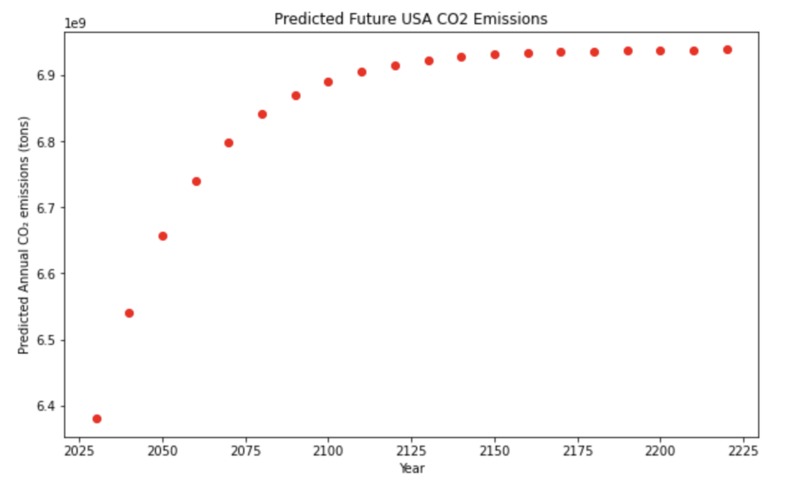
Model Predictions For Future US Carbon Dioxide Emissions
-
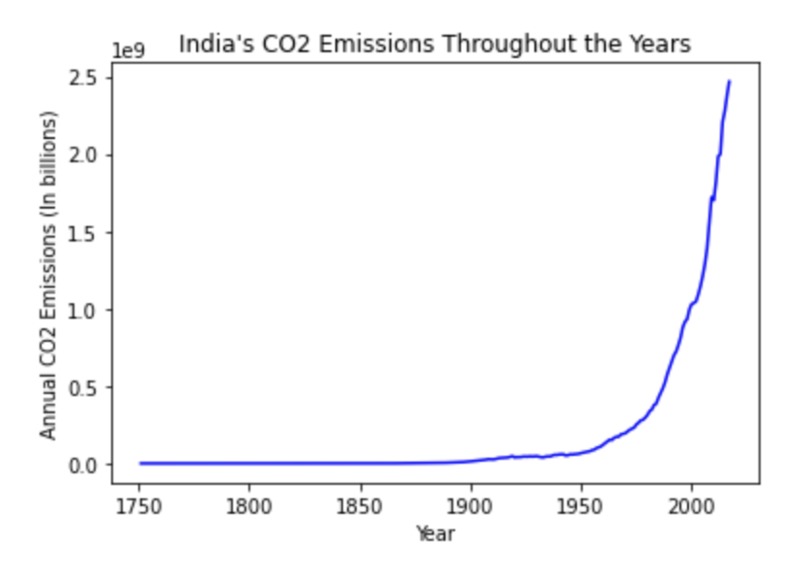
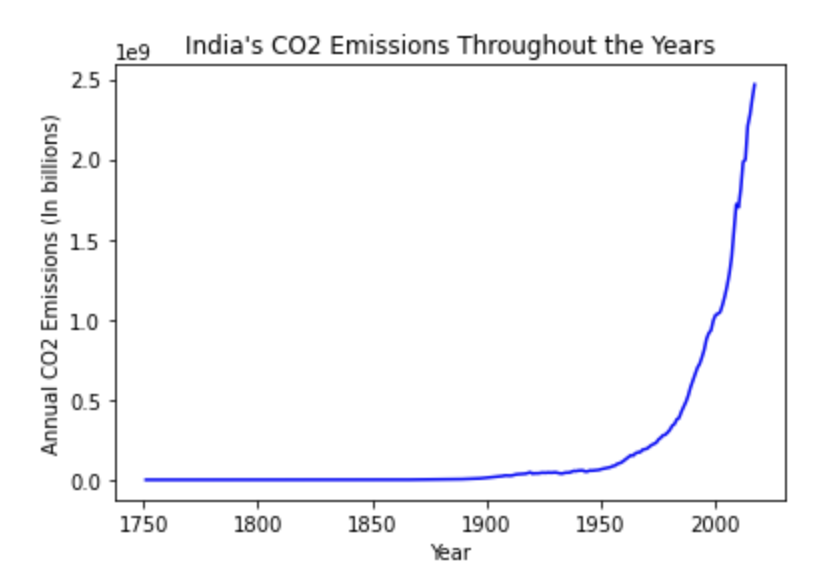
India Carbon Dioxide Emissions: 1751-2017
-
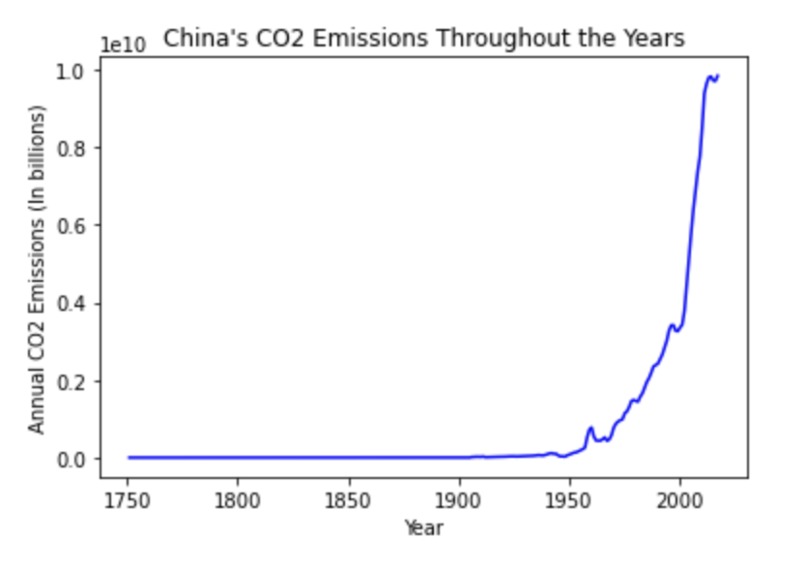
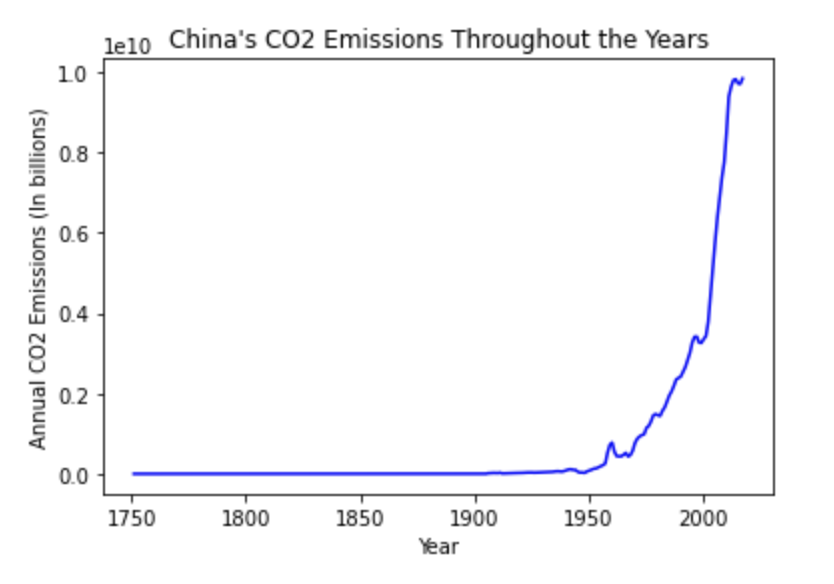
China Carbon Dioxide Emissions: 1751-2017


Inspiration:
Carbon dioxide levels have impacted us greatly, from higher temperatures to worse air quality. It has been a big problem ever since industrialization began, and noticing how humanity is the cause for it, I wanted to find a way to spread the word to others so that they can help make a difference. After finding the necessary Kaggle data, I was able to visualize with a scatterplot how carbon dioxide emissions have increased rapidly since the 1800s. I was shocked to discover that there are over 6 billion tons of carbon dioxide emitted yearly, and most of that is because of our carbon footprints. Just choosing to take public transportation, carpooling, and reusing/recycling materials instead of throwing them away can make a huge difference if every one of us does it. I hope that with this website, I can reveal real data and use my programming knowledge to make a model that provides future predictions that may cause people to want to take action to start addressing the problem. These little steps can all go a long way to protecting human health and the planet.
What it does:
My HTML website has three pages: a homepage, data page, and a conclusion page. The Homepage introduces the problem of excessive carbon dioxide emissions and the burning of fossil fuels. It talks about the current and future problems high carbon dioxide emissions can cause, taking information from credible sources online (listed on the conclusion page). Then at the bottom, users can enter a year between 1751 and 2017 to understand the approximate number of carbon dioxide emissions, in tons, during that year. This data is pulled from the co2_emission.csv found on Kaggle. On the data page, data on carbon dioxide emissions in the US, China, and India are shown for viewers to understand how these rates have risen rapidly and that it is up to us to help slow down these rates. On the same page are tips for users to try out to help address the problem in their own small way. Finally, the conclusion page shows a graph with predictions for future US carbon dioxide emissions so viewers can understand where levels are going if the trends continue. With the call to action, website references, and graphs, the website aims to educate and persuade viewers to take action and inform others of the changes they can make to protect the planet.
How I built it:
First, I used python to investigate the data in csv format, using libraries like python and scikit learn. I tried visualizing the data through scatter plots and regression plots, and I finally managed to use model fitting to fit the data. I had to test a variety of different models, from linear regression to random forest regression and I finally ended up using a logistic growth curve model. It was the best model so far, pretty close to the actual data and good at discovering trends to make predictions for future data points. For the HTML pages, I used basic HTML to format the pages with colors and text, but I used a little javascript to allow users to type in a year and the website would retrieve the corresponding carbon dioxide emissions in tons. This made the website a little more interactive. For the images, I copied my scatterplots from my python code and used HTML to format the images on specific pages.
Challenges I ran into:
At first, the data seemed confusing when graphing and my models ended up being really off from the actual values. That is when I realized that most of the data before the year 1800 was set to 0.0 tons of carbon dioxide emissions, which really messed up the models. The models had fit to data that had many 0s for output values, meaning it copied that trend and made very inaccurate predictions. To fix this, I only fit my models with data starting from the 1800s, which made the models more accurate as they followed the trend of rapidly increasing carbon dioxide emissions throughout the years. Additionally, once I fit and predicted on my data using the Random Forest Regressor Model, predicting on future data points that weren't in the original dataset did not work. It took me many attempts, and at first, I did not understand what was wrong because this was my best model so far (the mean absolute error was the least after using this model). Then I figured out that Random Forest Regressor Models cannot predict on user-generated or data that wasn't originally in the dataset, so I had to switch to a different model. That is when I came across the logistic growth curve model, which was not as good, but made better predictions than most other models I tested.
Accomplishments that I'm proud of:
I am proud that I was able to combine my python and basic machine learning skills with HTML. I do not have much experience using HTML and this was the first time that I had used machine learning outside of python tutorials that I had found online. It was a practical use, and I am happy that I finally found a model that could make future predictions that may persuade others to take action on the problem of climate change and high carbon dioxide levels in the atmosphere. I spent a lot of time experimenting with different models and I am happy that I was able to learn about each of them separately and understand when specific models are more helpful than others.
What I learned:
I learned that experimenting with a new project and implementing it by myself can be difficult, but not impossible if I am resilient and work towards my goal diligently. This is my first hackathon by myself, and I was surprised to find out how hard it is to come up with an idea that I can execute with my coding knowledge. The journey was a bit bumpy at first, but once I found the data I needed, I was able to put the pieces together. Since I wanted to present my findings and I had a little HTML knowledge, I knew that I wanted to create an HTML website. Using different python libraries, I found I way to use the skills I learned from the courses and tutorials I had completed online. After the project, I felt more confident with my machine learning skills and I was eager to learn more to possibly build a better model that can make more accurate predictions.
What's next for Carbon Dioxide in the Atmosphere - Protecting the Planet:
Next, I want to learn more about machine learning and even dive into deep learning. Using my understanding of neural networks, I hope that I can train an even better model that is much more accurate. Then, I can make better predictions of carbon dioxide emissions in the future, and I can even expand my knowledge to methane emissions or other greenhouse gases that are harming the planet. Additionally, I want to learn more Javascript so that I can make the website less static and more interactive. This way, my message can reach a bigger audience. Finally, I want to add a feedback form so that users can communicate what they liked about the website, what features they would add, and ask any clarifying questions that I can help answer. This can make the website more meaningful, as it will connect with viewers who are willing to learn more.
Built With
- co2-emission.csv
- html
- https://creativecommons.org/licenses/by/4.0/
- javascript
- python
Log in or sign up for Devpost to join the conversation.