-
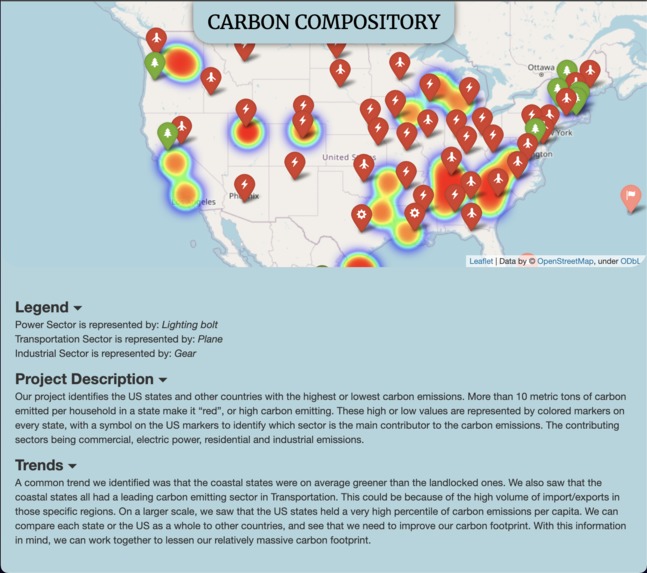
Main View (with info)
-
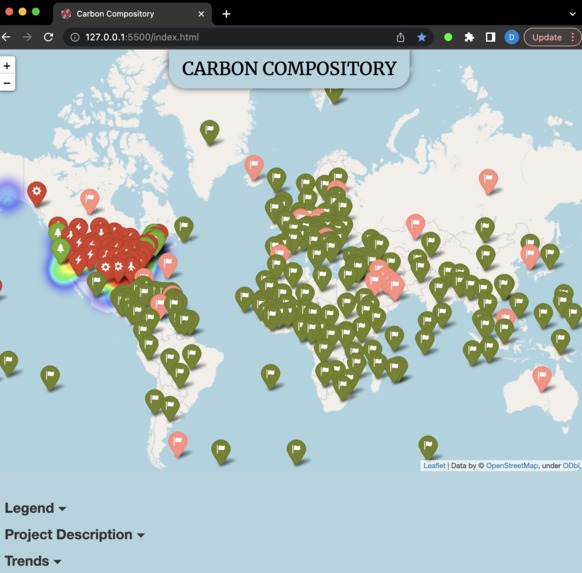
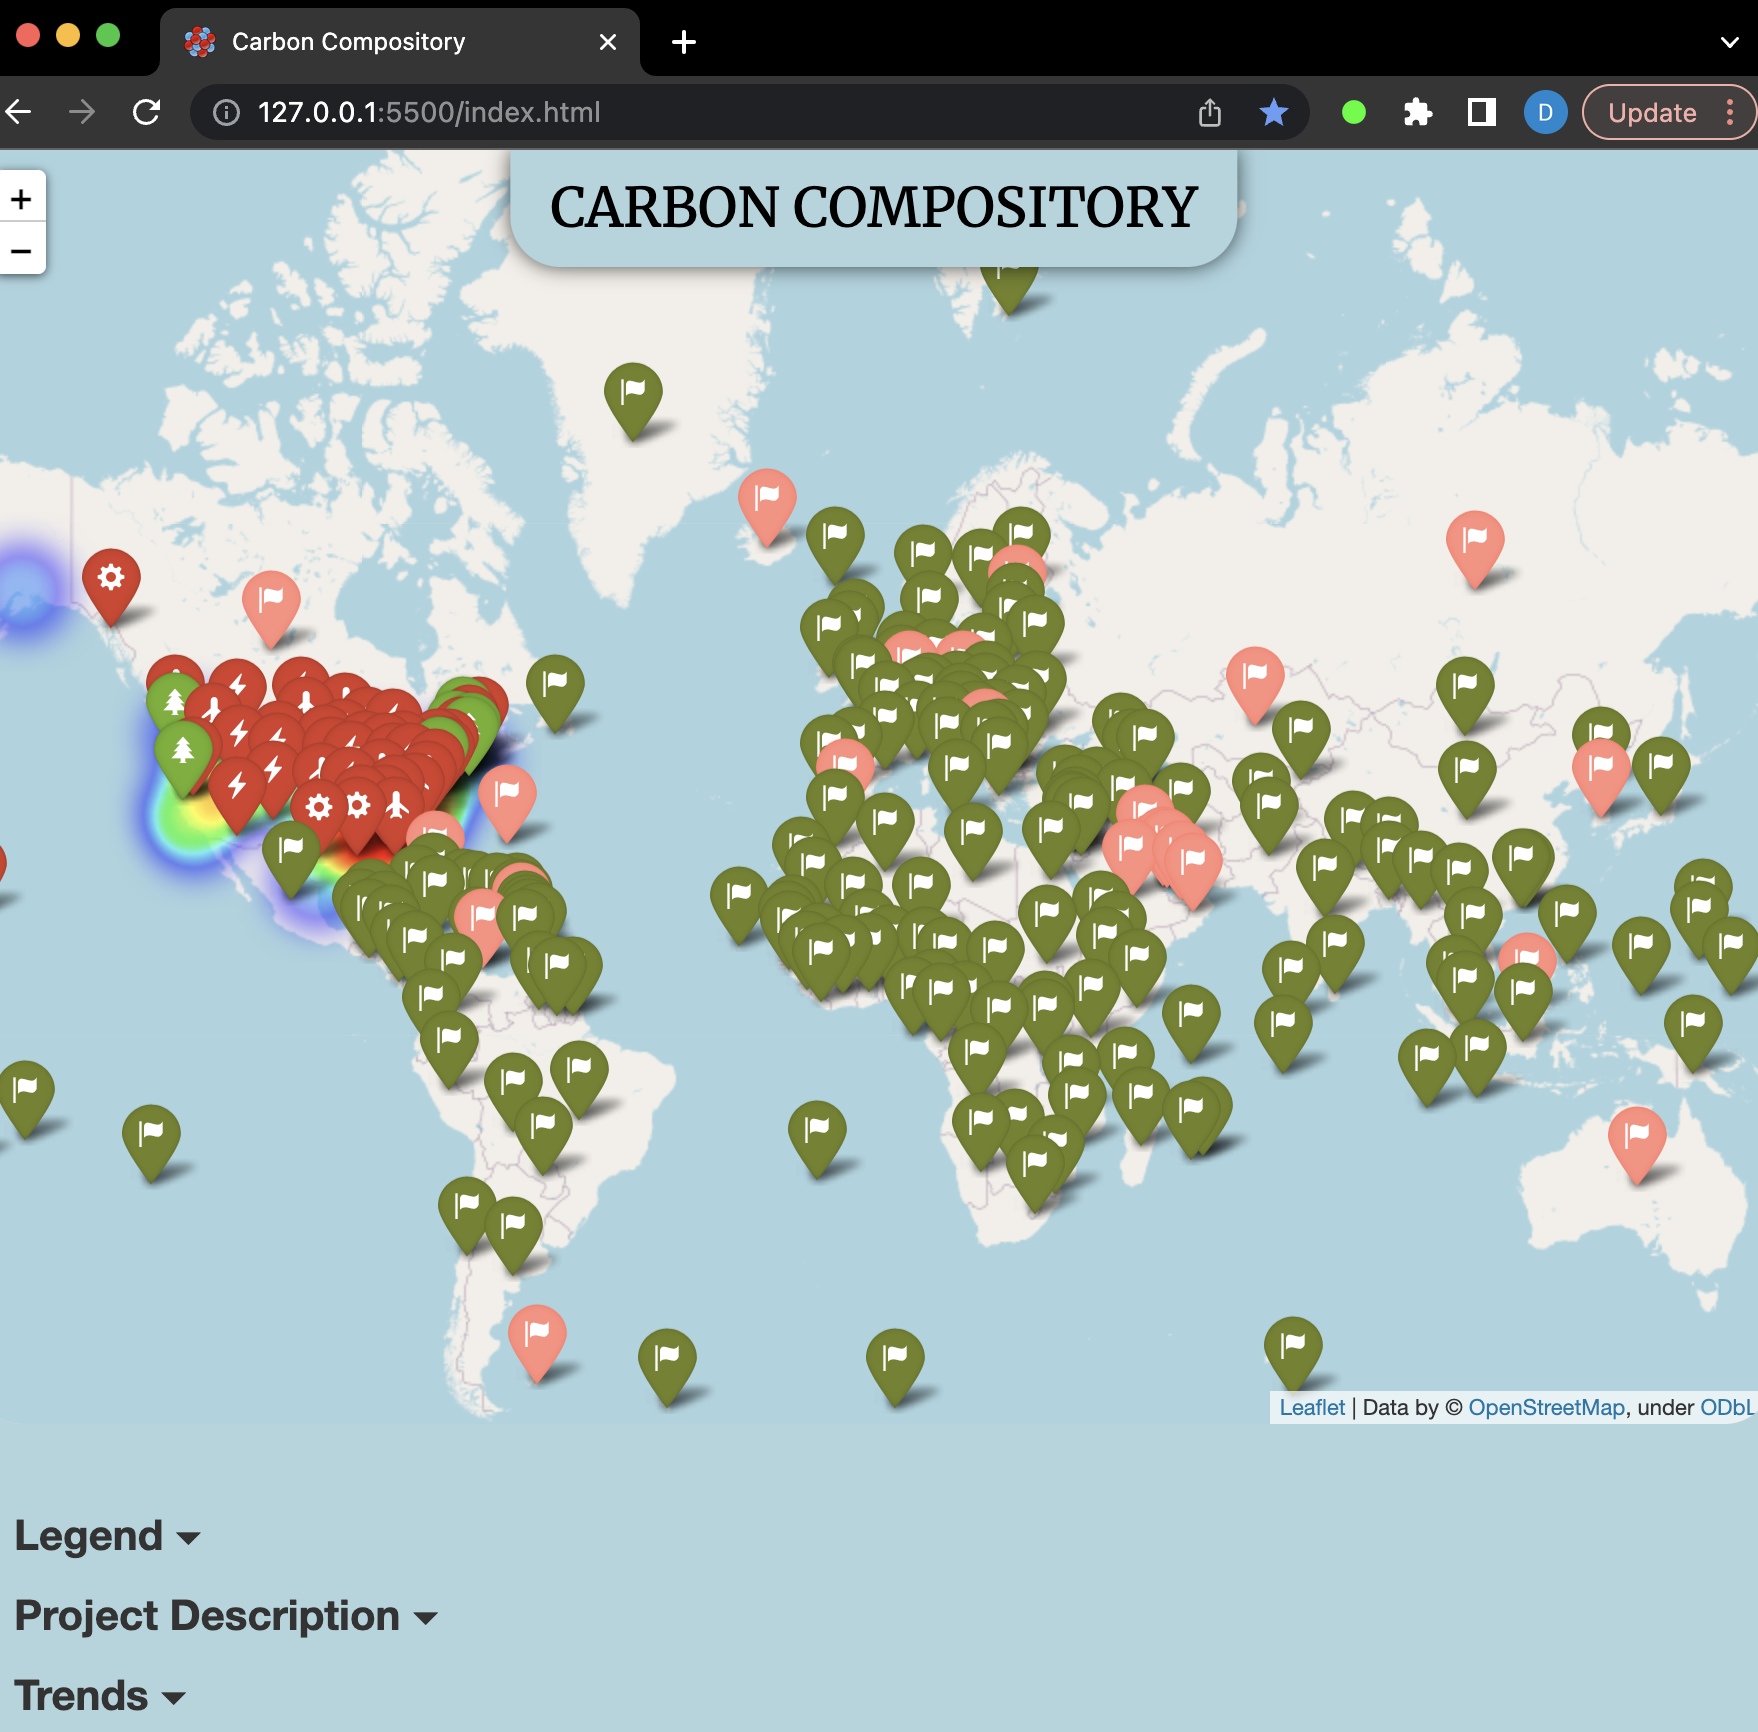
Collapsed World View
-
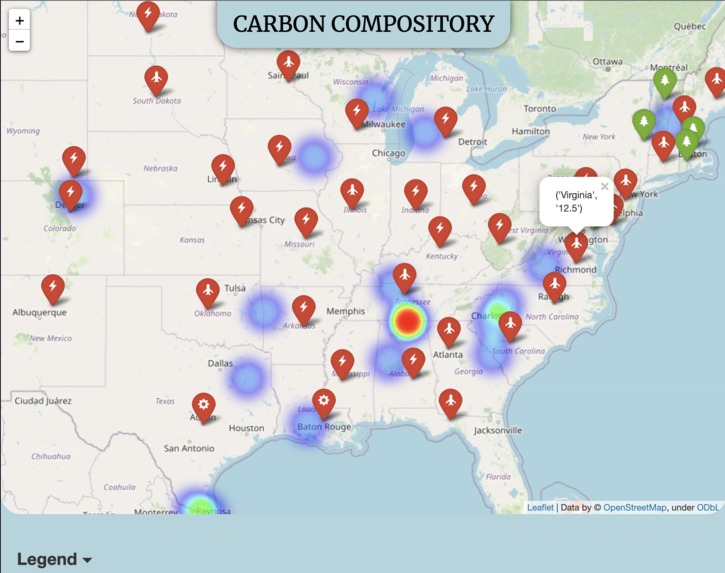
Single State Opened
-

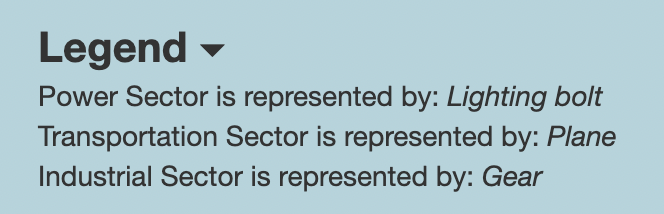
Legend


Inspiration
We began by thinking about problems that we wanted to solve. We wanted to choose projects that were meaningful but at the same time took into account our limited skills.
What it does
This program creates an interactive map informing of the carbon emission per capita for every US state, and every country in the world measured in metric tons.
How we built it
We used python and the folium library to generate a blank map. Then, we used .csv files and other online data and compiled it into simple markers placed on the map. In addition, we learned introductory HTML to embed our map into a website and provide descriptions for the user.
Challenges we ran into
As beginner coders with less than a year combined of experience, we encountered several problems. Multiple times, there were discrepancies in the data that we were working with. We ended up having to do additional extensive research to work around these discrepancies.
Accomplishments that we're proud of
This was our first ever hackathon, and we walked in with minimal prior knowledge. We were surrounded by peers, friends, and other students who all seemed to be experienced. However, we used this as motivation and tried to make a meaningful project taking our skills into mind. We pushed through. At first, we had just done states, and figured we were done. However, we chose to push harder and learn more, adding a heat map of the top 25 most carbon-emitting cities in the US. Later, we added markers for every other country in the World.
What we learned
We learned a lot about online databases and incorporating them into code. We also learned how to incorporate python code into HTML, and how to put maps into websites.
What's next for Carbon Compository:
The next steps are uploading the site onto the web for people to use.

Log in or sign up for Devpost to join the conversation.