-
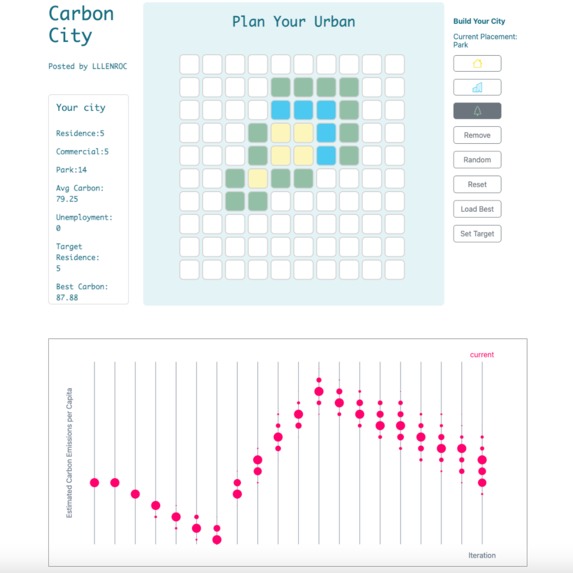
A delicate layout
-
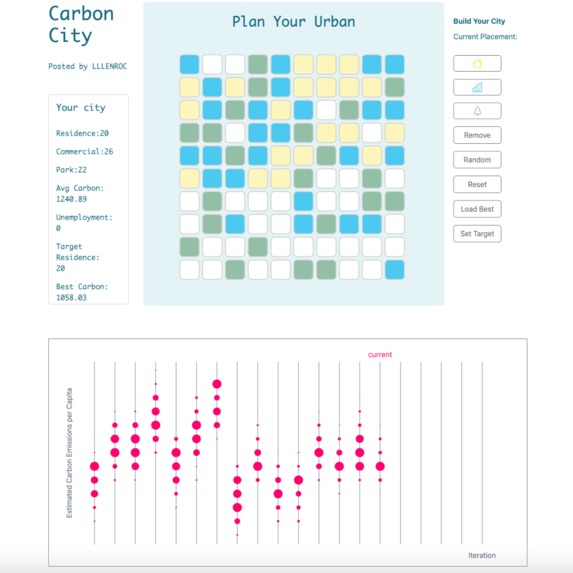
A random layout
-
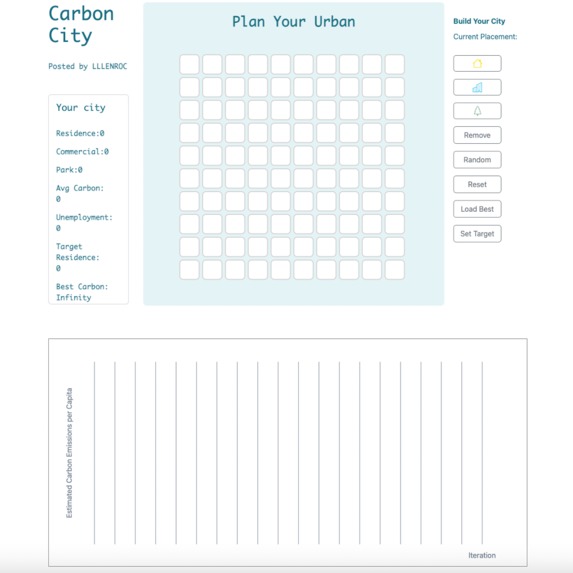
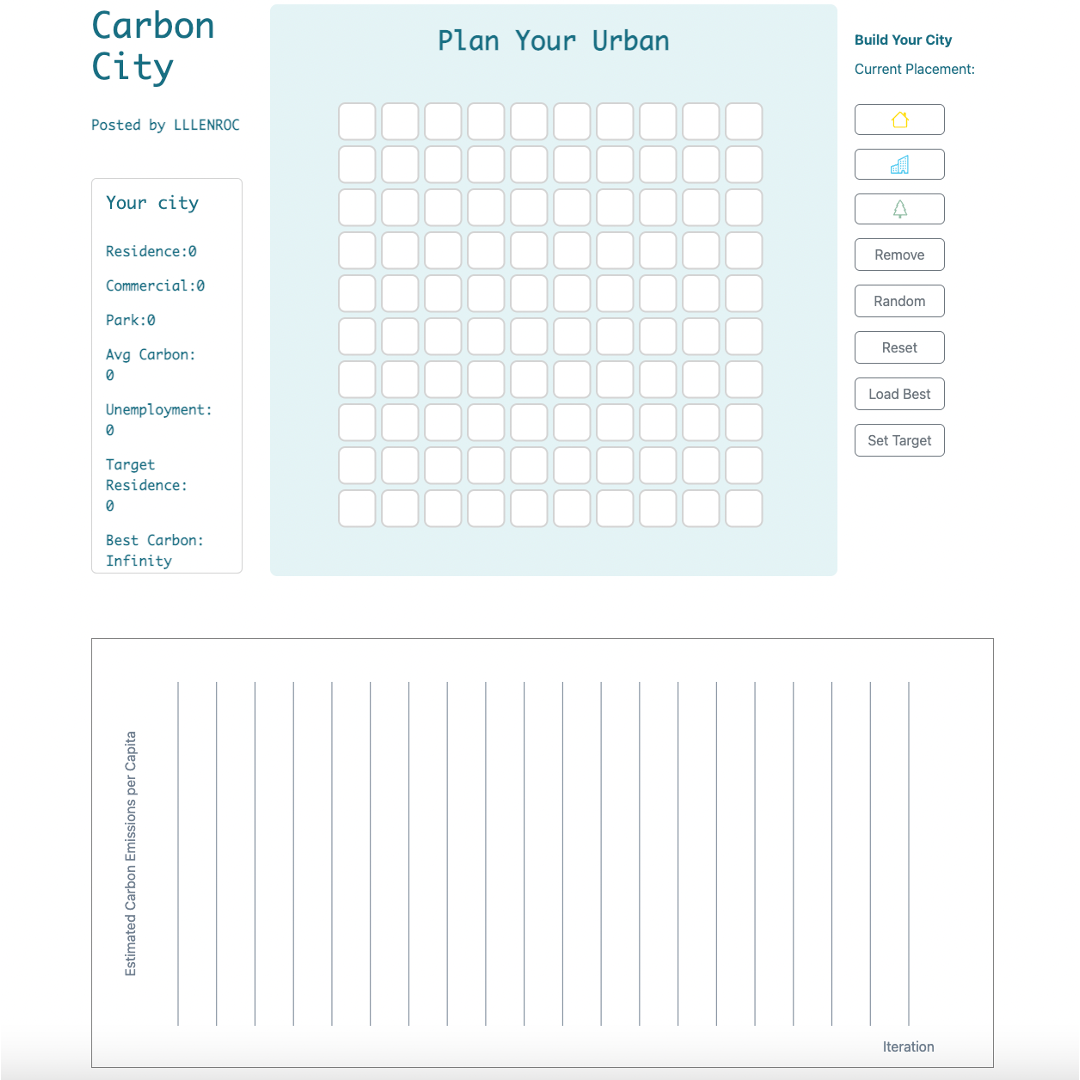
The initial panel

Inspiration
Although the city comprises only 2% of the total surface area of Earth, 80 % of the world’s greenhouse gases (GHG) is emitted from urban regions. The GHG mainly comes from the transportation and energy used in industry and residential area. Therefore, we think it will be interesting and useful to find the urban layout with the minimum total GHG emissions.
What it does
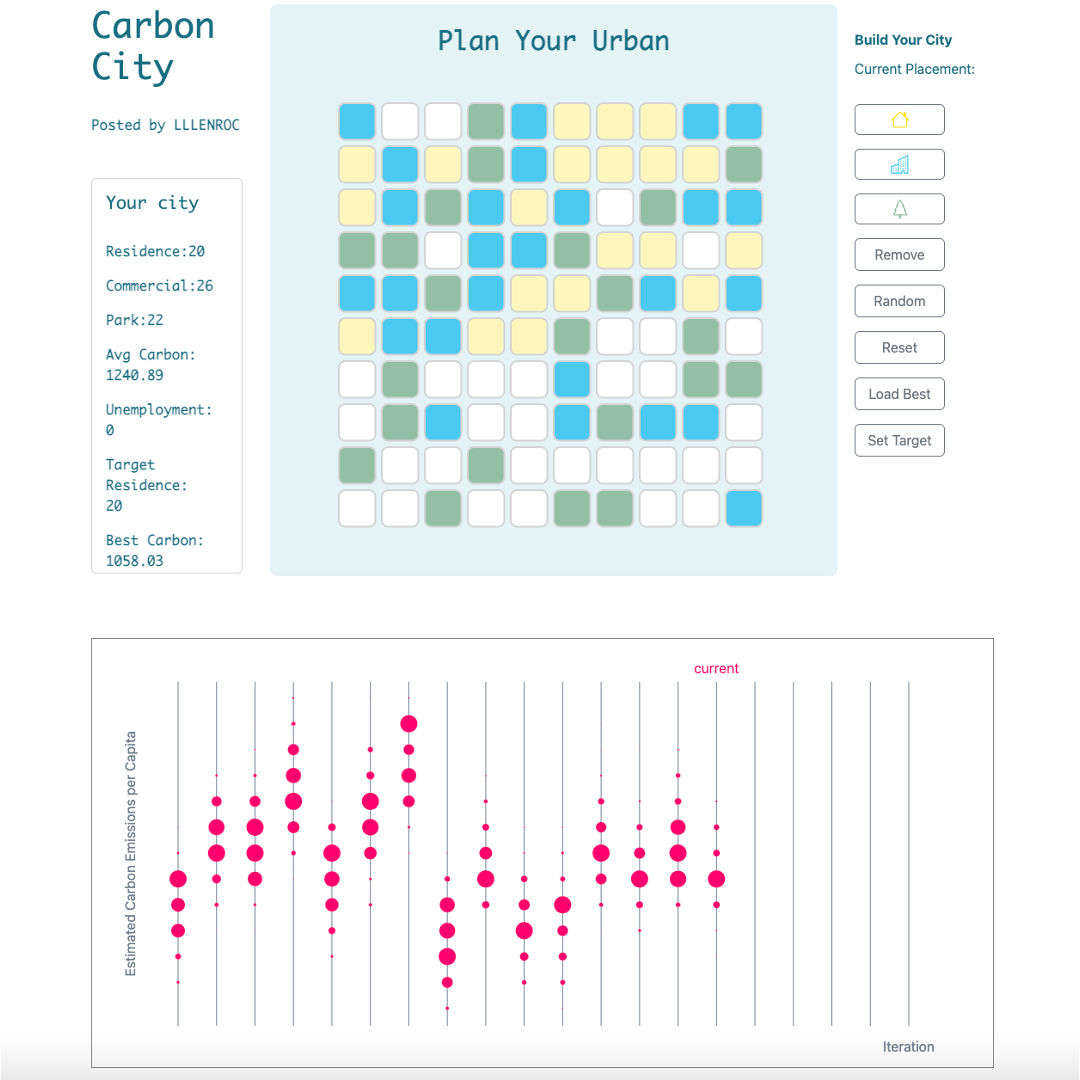
We summarize the city blocks into three types, residential block, commercial block and park block. Each block has a base carbon emissions ( for parks, it is negative). The planner gets to place these blocks into a manhattan style road grid. We simulate a daily routine of each person randomly and calculates its overall daily carbon emissions caused by transportations. The total carbon emission will be the carbon emission of this layout. It gives them a handy tool to inspect the effect of urban layout in terms of carbon emissions.
How we built it
This is a pure front-end tool. We framed it using HTML and embodied it using JavaScript. The manipulation of graphic elements is achieved through d3.js. The carbon emissions of each unit event are estimated through data we found online.
Challenges we ran into
How to estimate the carbon emissions? How to simulate a person's daily routine? How to set an objective for players?
Accomplishments that we're proud of
It works somehow, and we can find some urban patterns with minimal carbon emissions through this tool.
What we learned
We learnt how to collaborate on a project in such a short time. We also improved our problem-solving ability by breaking a real-world environmental problem into several small tasks and allocating the tasks to every team member: finding reliable datasets, implementing the algorithms and designing the UI.
What's next for Carbon City Planner
It can be enhanced with more complicated road grids, more varieties of block types, more accurate carbon emission estimations and more accurate daily simulations.


Log in or sign up for Devpost to join the conversation.