Inspiration
What it does
How we built it
Challenges we ran into
Accomplishments that we're proud of
What we learned
What's next for Carbon Bouncer
Inspiration
Teams measure test coverage and latency on every merge. Almost nobody measures energy. A change that doubles the CPU cost of a page goes out the same way as one that halves it. We wanted the pipeline to notice.
What it does
Carbon Bouncer adds a carbon gate to a GitLab pipeline. It serves a fixed number of requests against a demo shop, GreenShop, and computes the Software Carbon Intensity of the change. If the change is more than 50% worse than the baseline, the job fails and the merge request can't pass. If it passes, the pipeline writes release notes with the number, plans a Cloud Run deploy to the region with the lowest grid intensity, and posts a carbon receipt on the issue.
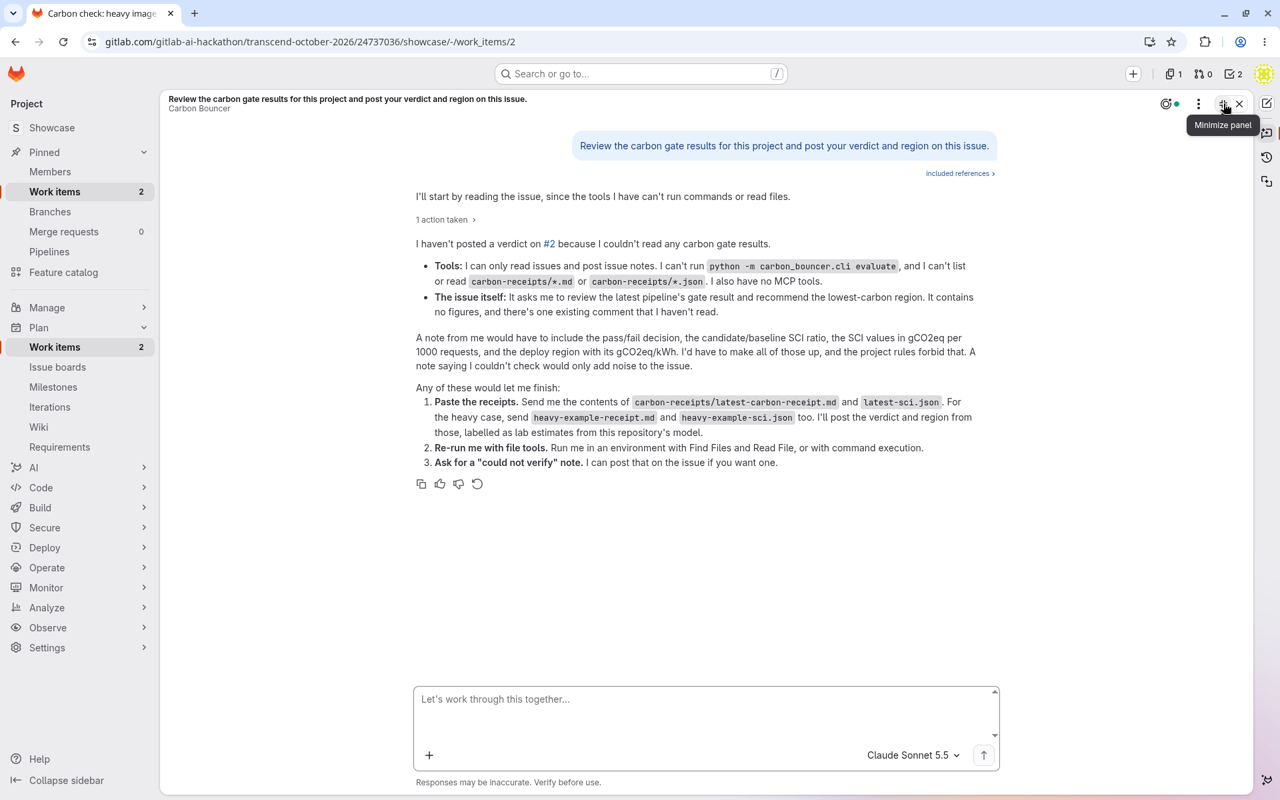
GitLab Duo does the work around the gate. A custom flow takes an issue, plans it, and opens a merge request. A custom agent, the Bouncer, reads the gate result, explains a rejection, and suggests a fix.
How we built it
Python and FastAPI for GreenShop. psutil to measure CPU time. A small calculator that follows the Green Software Foundation SCI spec, with coefficients from Cloud Carbon Footprint and grid factors copied from its published Google table. GitLab CI with jobs across plan, test, secure, carbon, package, release, configure, monitor, and govern. A Duo flow in .gitlab/duo/flows/, an agent prompt, and a stdio MCP server that exposes the calculator as tools. 28 tests.
Challenges
Measurement noise. Two runs of the same code don't give the same CPU time, so a naive gate fails at random. We fixed the request count, compared in a single region, and added a minimum CPU difference before a result counts.
Choosing honest grid data. Some published factors that include carbon-free energy are close to zero. The SCI spec excludes market-based measures, so we use the location-based column and say so.
Accomplishments
The gate fails a heavy change and passes the fixed one, on real measurements, every time we run it. Every number in a receipt can be traced to a formula and a cited source.
What we learned
Most of the work in carbon measurement is being clear about what you don't know. The formula is simple. The inputs need sources.
What's next
Measure real Cloud Run usage after deploy instead of estimating on the runner. Use hourly grid data. Publish the MCP server over HTTP so the catalog agent can call it directly.
Sustainability (SCI)
SCI = ((E * I) + M) / R, per GSF SCI v1.1.0 (ISO/IEC 21031:2024). E comes from CPU time and memory, using Cloud Carbon Footprint coefficients (0.71 to 4.26 W per vCPU, 0.000392 kWh per GB-hour, PUE 1.1). I comes from the location-based Google factors, retrieved 2026-10-23. M is the embodied share of a 1000 kg server over four years. R is one request. On our run, heavy: 0.0427 gCO2eq per 1000 requests; optimized: 0.0044 (CI pipeline 2990639872, 12 requests). These are estimates, not data-centre measurements.
Built With
- cloud-run
- fastapi
- gitlab
- gitlab-duo
- mcp
- psutil
- python

Log in or sign up for Devpost to join the conversation.