-
-
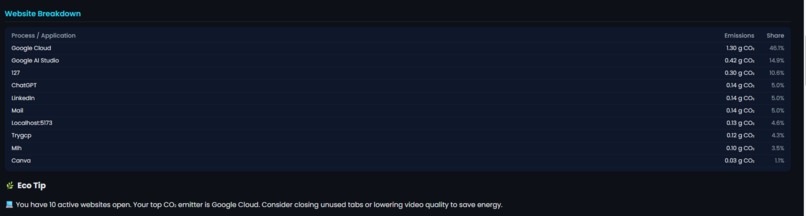
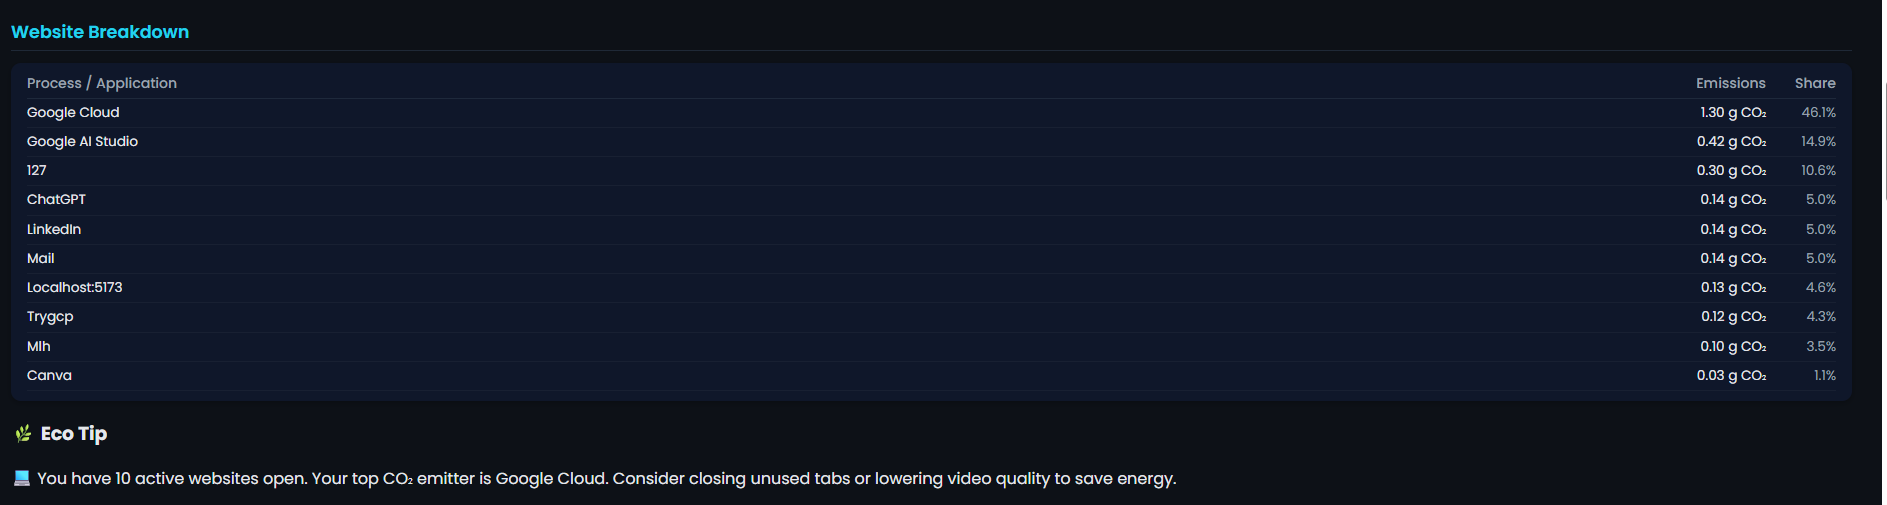
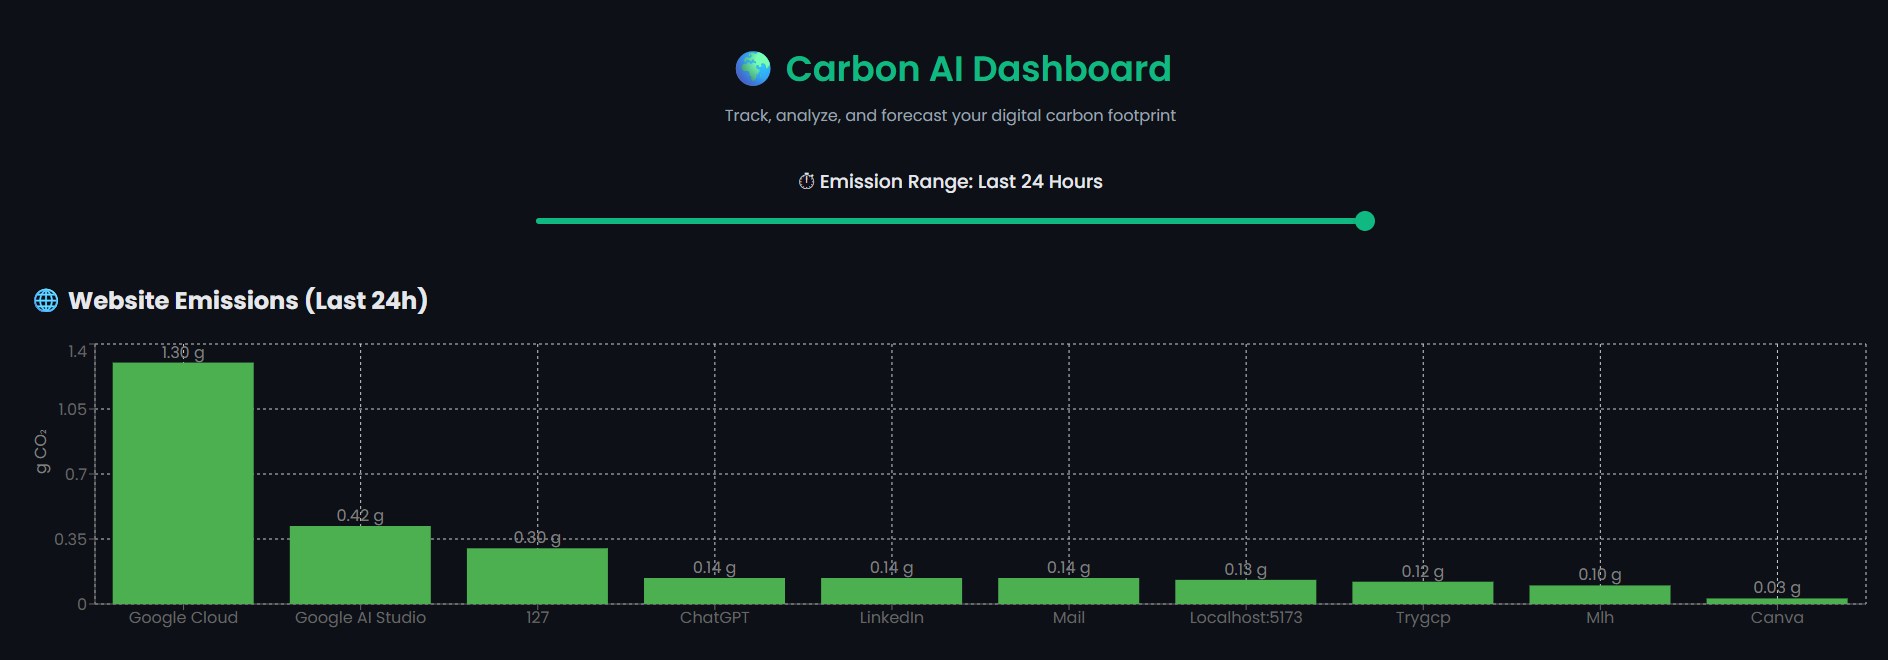
Websites breakdown of Carbon emission in % with AI tips
-
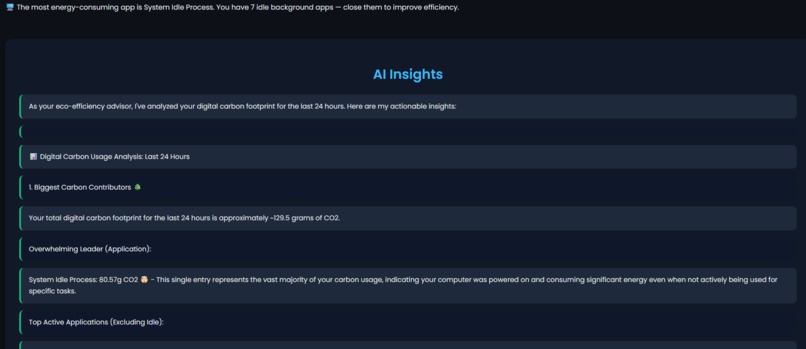
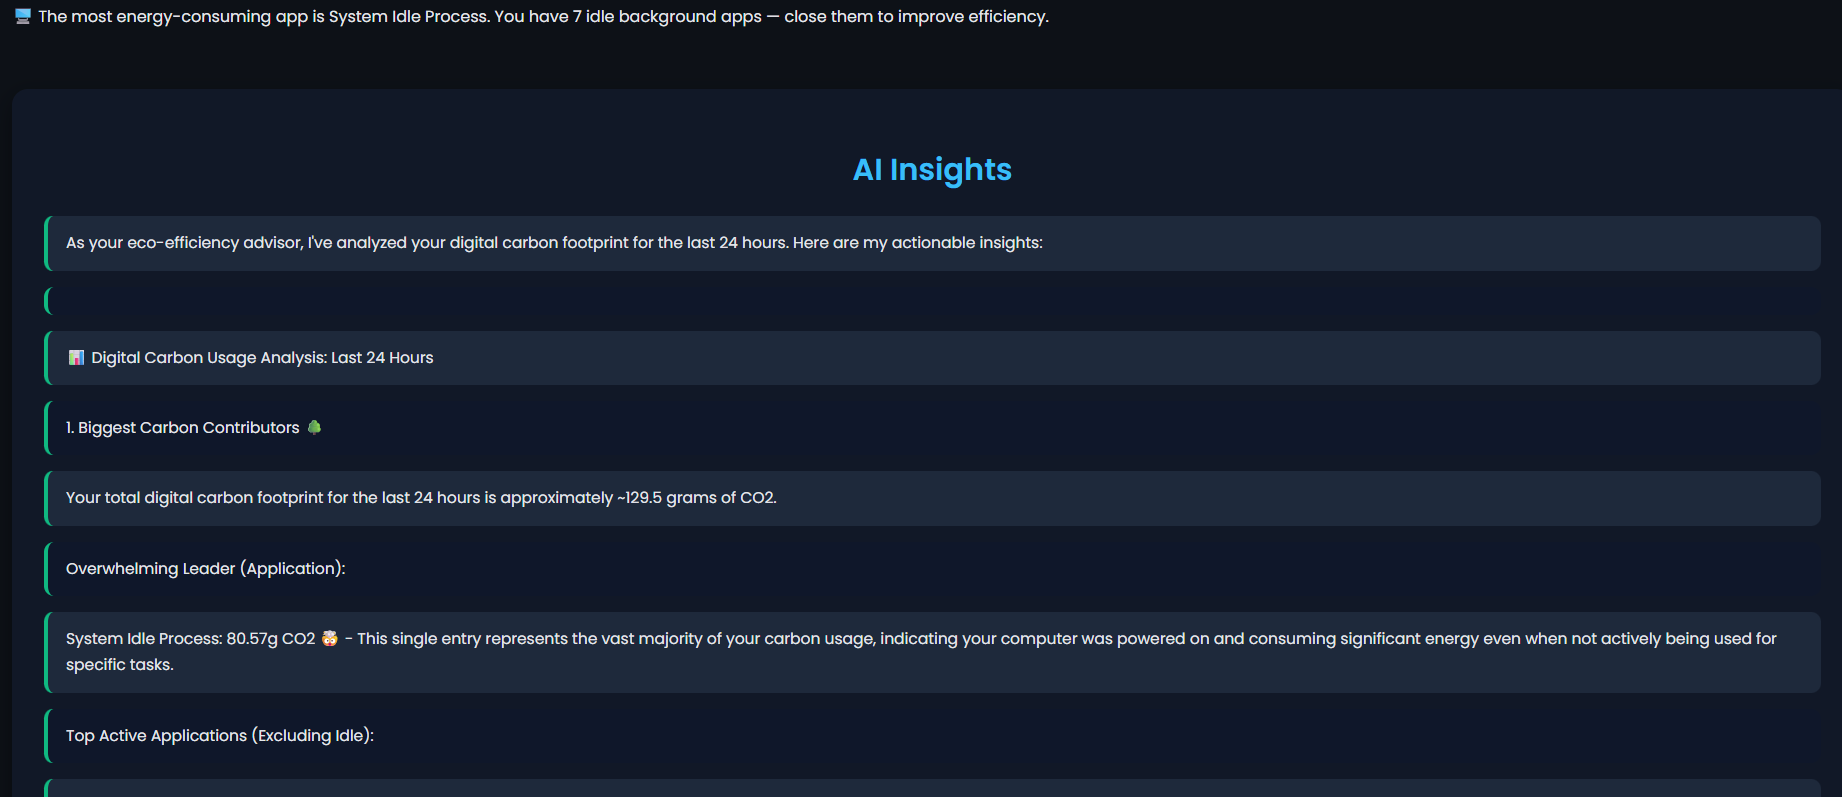
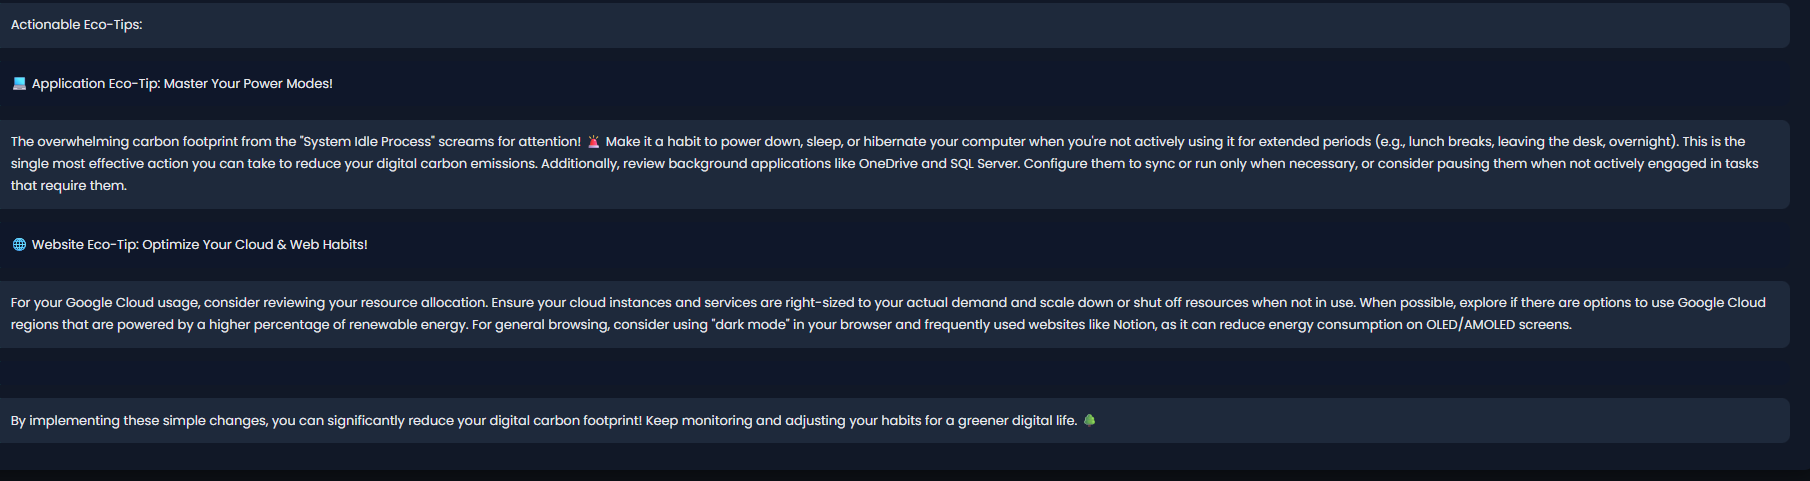
AI insights
-
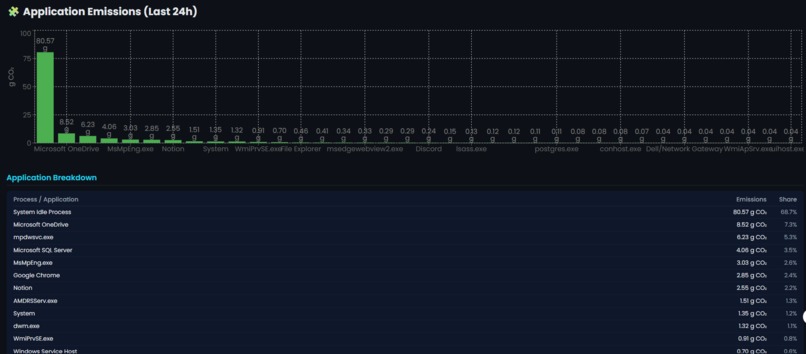
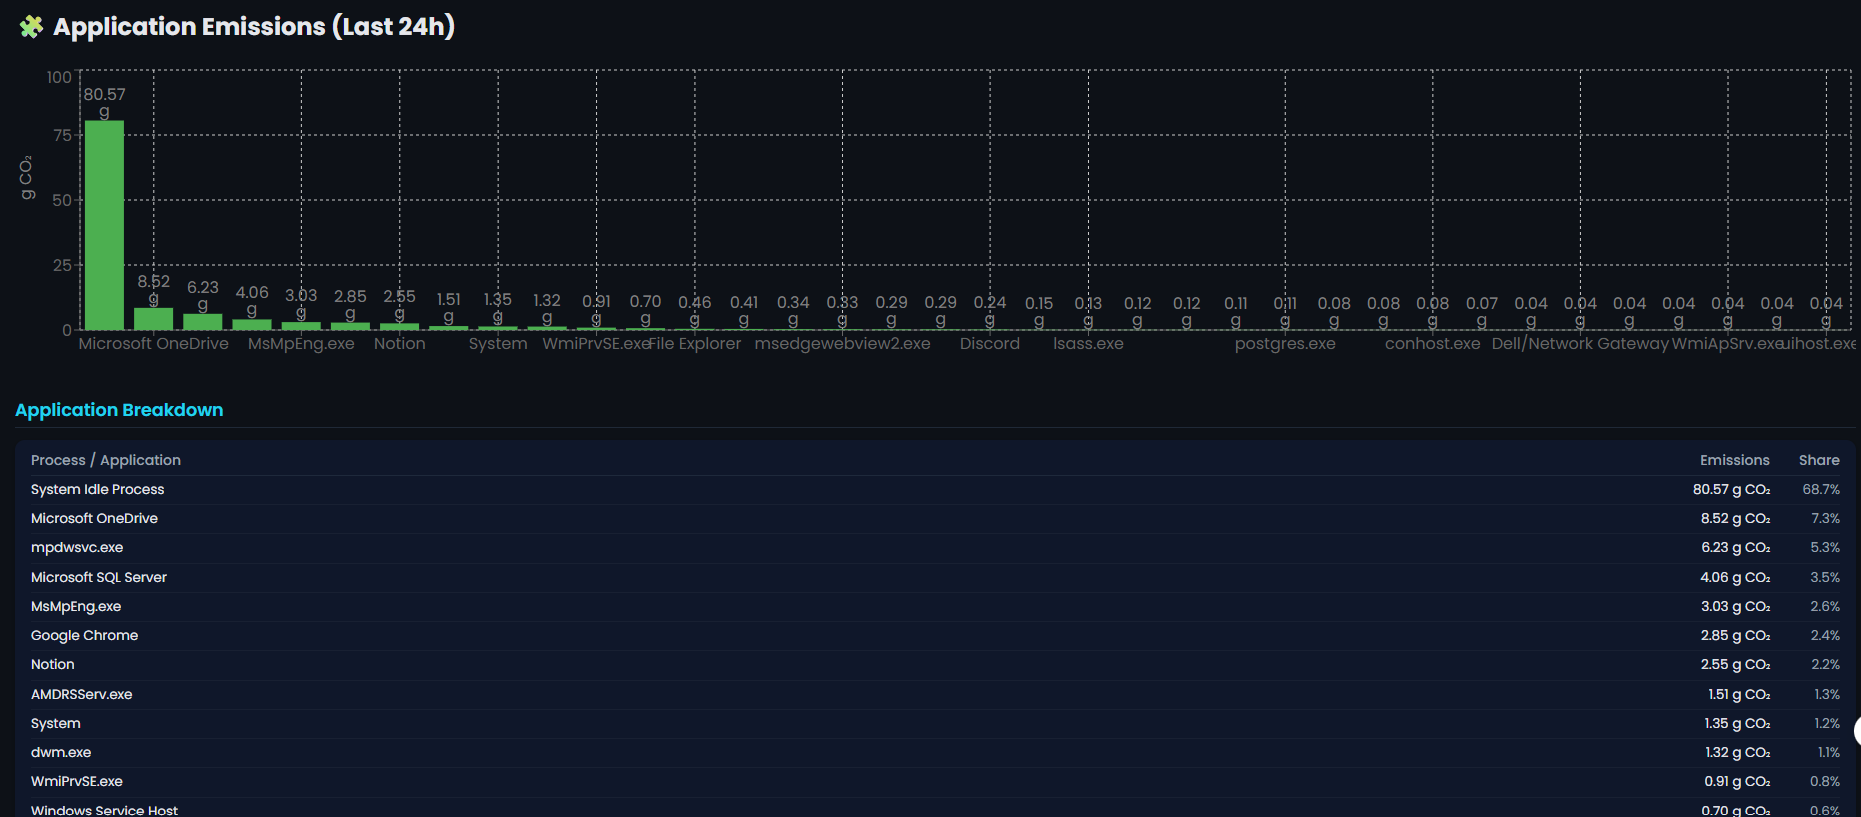
Application breakdown
-
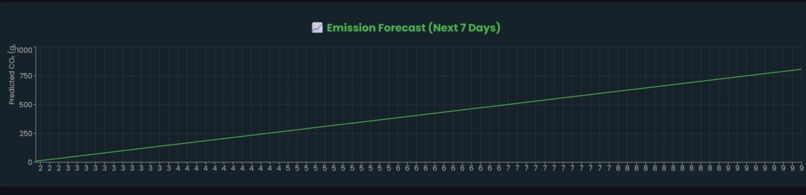
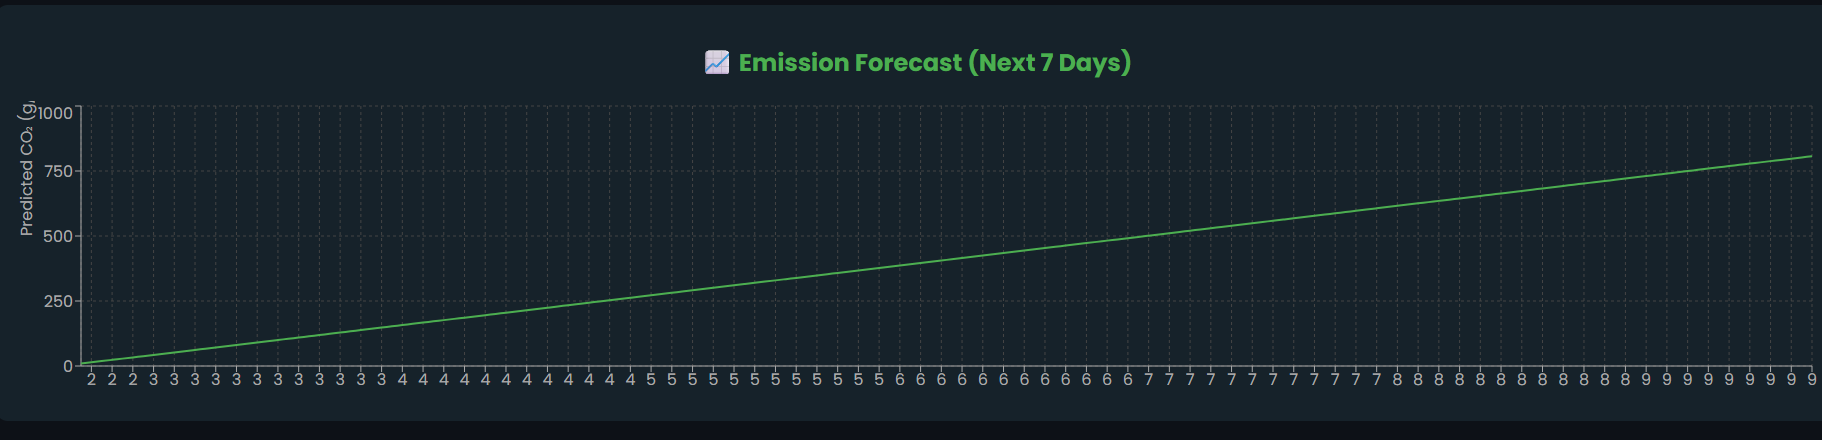
Future prediction for 7 days
-
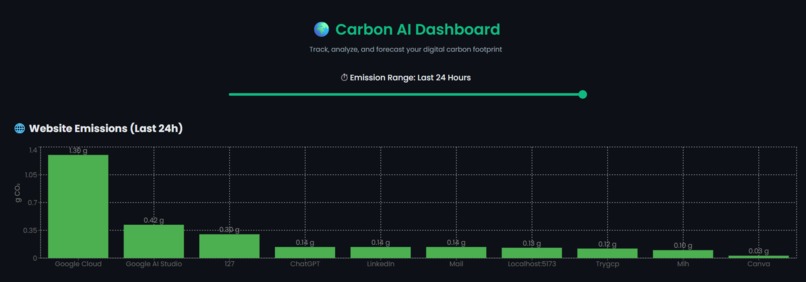
Websites breakdown of Carbon emission with slider of 24hrs
-
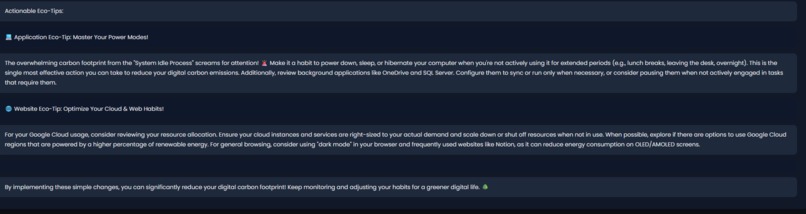
Personalized AI Tips
Inspiration: Considering that the Information and Communication Technology (ICT) sector contributes nearly 1.7% to global greenhouse gas emissions, and that the average individual spends over 3,200 hours online annually, it dawned on us how extremely one-sided our view of digital carbon footprints really is. While industries focus on large-scale emissions, everyday device and software use silently add up. We wanted to use AI to bring visibility to this hidden impact-starting with one laptop, one day at a time. If we are able to measure even the smallest of digital emissions, it may serve to inspire companies and individuals toward a greener, smarter future.
What we learned: This project taught us how AI could translate raw system data into meaningful environmental insights. Practical experience was gained in quantifying real-time energy usage and the resulting emissions using such tools as psutil. Understanding the connection between digital behaviour and the carbon impact changed how we thought of the role technology plays regarding sustainability. Most importantly, we learned that even small innovations can spark large-scale environmental change when scaled thoughtfully.
We built Carbon AI as a real-time sustainability assistant that connects local system data with AI-driven insights. The backend, built using Flask and Python, collects live data on running applications, browser activity, and CPU usage to calculate estimated CO₂ emissions. The frontend, built with React and Chart.js visualizes emissions through interactive graphs, time sliders, and forecasts. We integrated Google Gemini 2.5 Flash to generate personalized eco-tips based on user behavior, and implemented a weekly prediction model to estimate future emissions trends. The system was designed for both local monitoring and cloud demo mode, ensuring privacy while maintaining an engaging visual interface.
Example 1 – Browser & Tab Optimization
“You currently have 18 browser tabs open, including 5 related to video streaming and 3 idle work tabs that haven’t been active in over an hour. Your top emitter is YouTube, which has been running continuously for 2.5 hours. Closing inactive tabs or pausing video playback could reduce your browser-related emissions by up to 35%.”
Insight Type: Website activity optimization AI Source: Gemini analysis of browser URLs + session time
Example 2 – Application Energy Usage
“Your system shows high background activity from Notion and Discord, both running idle for more than 3 hours. These apps contribute nearly 0.6 g of CO₂ per hour despite minimal usage. Consider disabling auto-sync or closing them when not in use to lower total daily emissions.”
Insight Type: Application efficiency suggestion AI Source: Gemini interpretation of psutil system metrics
Some of the biggest challenges were around data accessibility and performance. Since cloud servers can’t access user processes, we built a dual-mode setup—real-time tracking for local users and simulated data for hosted demos. Balancing AI responsiveness with real-time system monitoring required debouncing and threading to avoid lag. Mapping CPU and memory data to accurate CO₂ values also involved calibration against known power coefficients. Finally, rendering large datasets without UI delays pushed us to optimize chart updates and use progressive rendering for smooth, real-time visualizations.

Log in or sign up for Devpost to join the conversation.