-
-
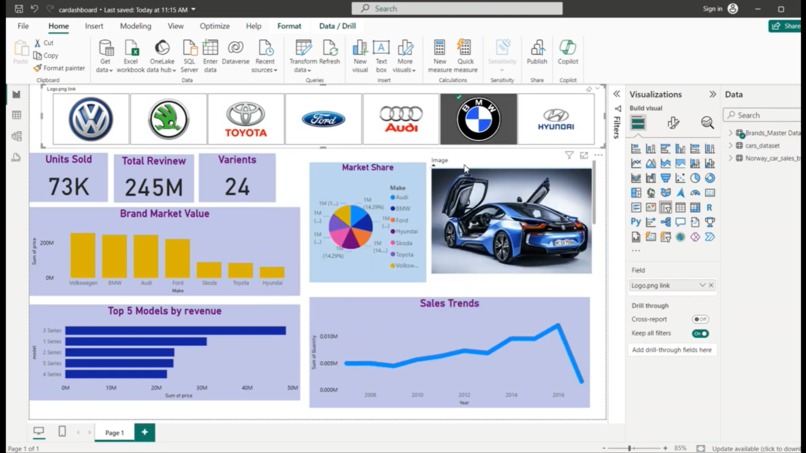
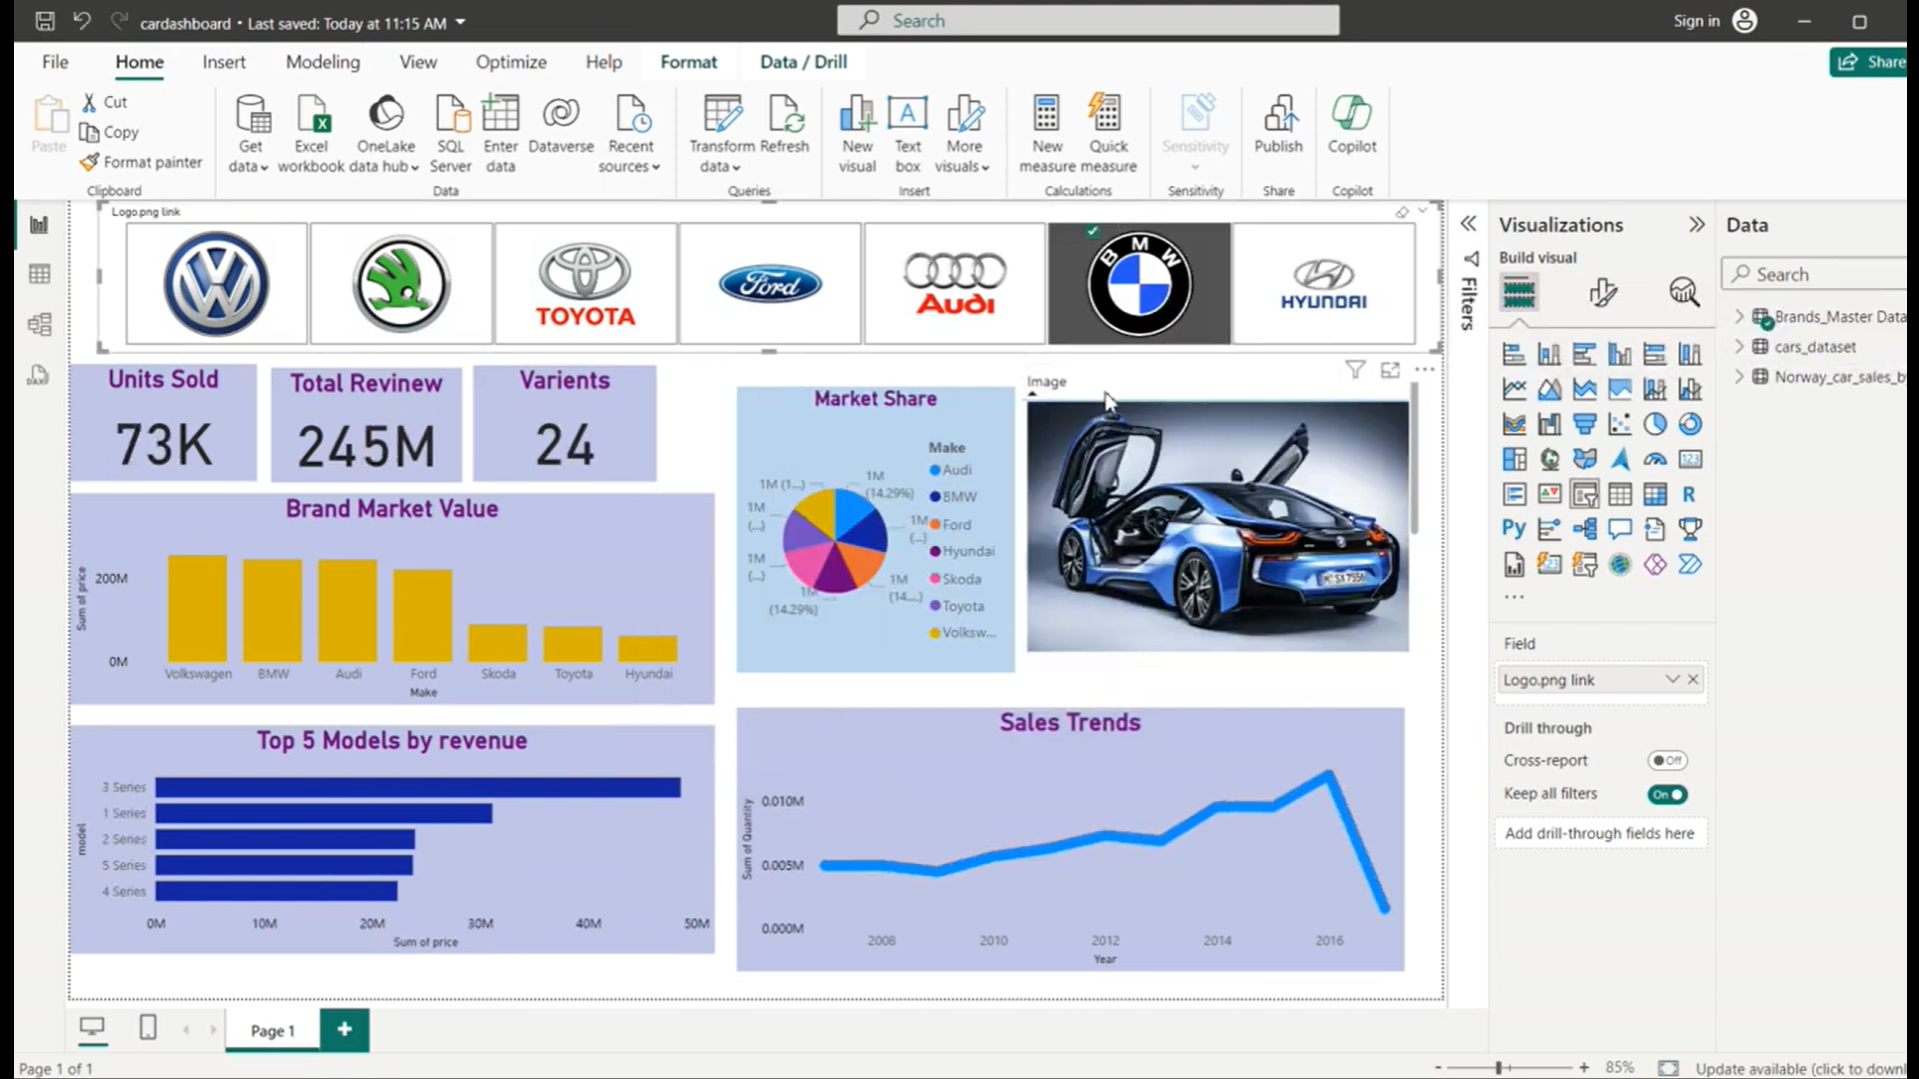
Car Sales Dashboard using Power BI
Inspiration
The inspiration for the Car Sales Dashboard project stems from the need for businesses to make informed decisions in a highly competitive automotive market. With vast amounts of sales data being generated, it becomes essential to transform raw data into meaningful insights.
What it does
The Car Sales Dashboard built with Power BI provides a comprehensive, interactive platform to analyze car sales data. It tracks sales performance, visualizes key metrics, identifies top-selling models, and reveals trends and patterns. With interactive filters and real-time insights, it empowers businesses to make data-driven decisions, optimize sales strategies, and improve overall business efficiency in the automotive industry.
How we built it
The Car Sales Dashboard was built using Power BI through a structured process that began with gathering sales data from various sources, followed by cleaning and standardizing the dataset to ensure accuracy. Next, we defined relationships between data tables and created calculated metrics for key performance indicators (KPIs). Various visualizations, including charts and graphs, were developed to display insights effectively. Interactive filters were added to allow users to customize their views, while the dashboard layout was organized for a user-friendly experience. Finally, we conducted testing and refinements to ensure functionality and enhance user experience, resulting in an interactive and insightful tool for analyzing car sales data.
Challenges we ran into
During the development of the Car Sales Dashboard, we faced several challenges that required innovative solutions. One significant challenge was data inconsistency, as the sales data was sourced from multiple systems, leading to discrepancies in formats and missing values. Addressing this required extensive data cleaning and transformation to ensure accuracy. Additionally, creating meaningful visualizations from complex datasets proved challenging, as it was essential to present the information clearly without overwhelming users. We also encountered difficulties in defining relationships between data tables, which required careful modeling to ensure accurate calculations for key performance indicators (KPIs).
Accomplishments that we're proud of
One of the accomplishments we are most proud of in the development of the Car Sales Dashboard is our ability to transform complex sales data into a user-friendly, interactive tool that delivers actionable insights. Through meticulous data cleaning and modeling, we successfully created a dashboard that not only accurately reflects sales performance but also empowers users to make informed decisions. The incorporation of dynamic visualizations and interactive filters allows stakeholders to explore data in a meaningful way, enhancing their understanding of market trends and customer preferences.
What we learned
Throughout the development of the Car Sales Dashboard, we gained valuable insights and skills that enhanced our understanding of data analytics and visualization. We learned the importance of thorough data cleaning and transformation, which is crucial for ensuring accuracy and reliability in any analysis. The process of creating relationships between data tables taught us how to effectively model data to derive meaningful insights. Additionally, we improved our skills in designing intuitive visualizations that communicate complex information clearly and effectively.
What's next for Car Sales Dashboard
The next steps for the Car Sales Dashboard focus on enhancing its functionality and value through several key initiatives. We plan to integrate real-time data for up-to-date sales insights, implement advanced analytics using machine learning algorithms to forecast future trends, and expand data sources to include customer demographics and competitor analysis. Additionally, we aim to offer user training to maximize the dashboard's features and continuously gather feedback for refinements. Developing a mobile-friendly version will increase accessibility, while incorporating collaboration tools will promote a data-driven culture within the organization. By pursuing these initiatives, we can evolve the dashboard into a more powerful tool for data analysis and decision-making in the automotive sector.


Log in or sign up for Devpost to join the conversation.