-
-

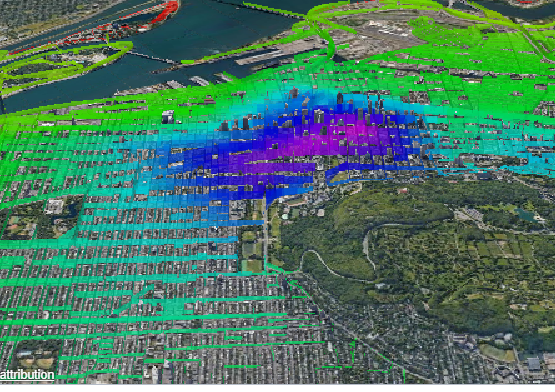
Montreal bird's eye
-

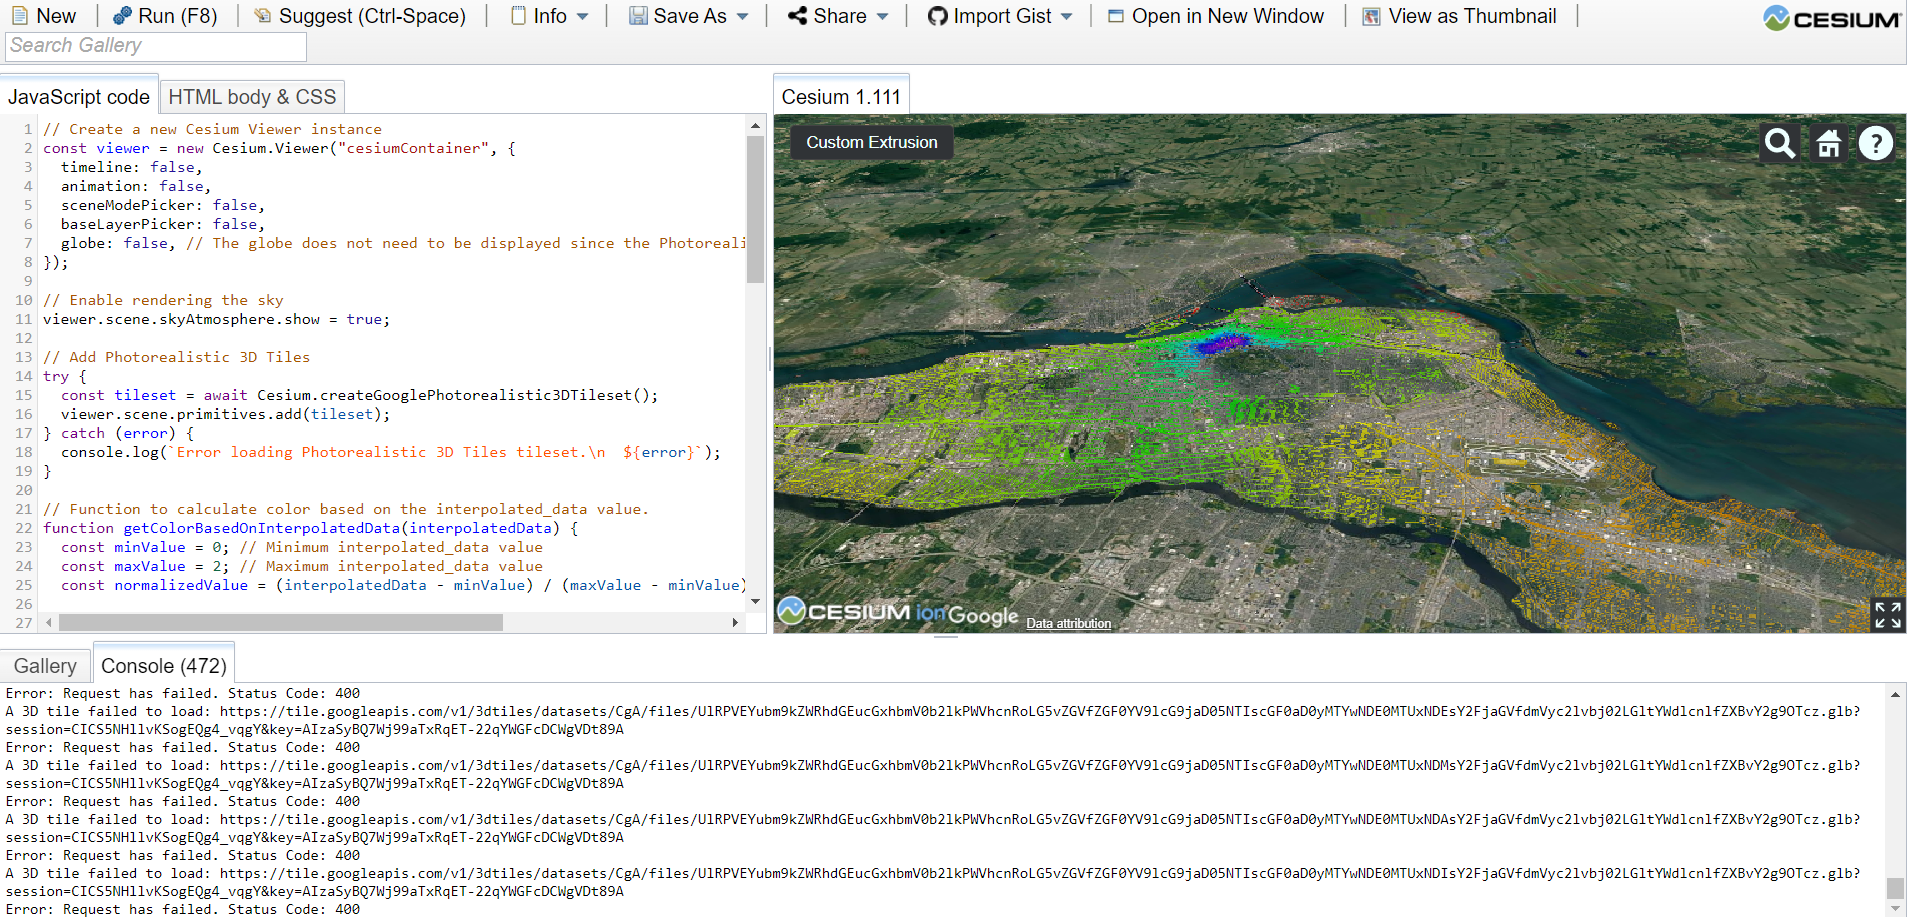
Cesium sandcastle viewer
Inspiration
Growing up in Winnipeg, a car-centric Canadian city nestled in the prairies, my brother Justin and I were captivated by Montreal's vibrant downtown. It’s bustling urban landscape filled with pedestrians and lively streets, was a stark contrast to Winnipeg's quieter car dominated scenes. Our parents reminisced about Winnipeg's once lively downtown, now overshadowed by the convenience of suburban malls and cars. Montreals energy drew us both; I pursued university there, while Justin immersed himself in the arts scene. We quickly discovered that Montreal's downtown was best navigated on foot, bike, or public transit. Despite the still chilly winters, the ease of accessing essentials by walking was a breathe of fresh air for both of us. However, we still noticed a disproportionate focus on car infrastructure, despite a significant portion of downtown residents relying on walking and biking. Our project aims to highlight areas where driving is less efficient and advocate for prioritising pedestrian and bicycle infrastructure in these areas.
What it does
This project presents a 3D visualization of Montreal's cityscape, emphasizing areas where bicycling is more efficient than driving.
How we built it
Leveraging Python and Google Maps API, we compiled a database identifying Montreal locations where biking is quicker than driving to the city center. We integrated this data with Montreal's road network using a GeoJSON from the city's Open Data website. The final visualization, crafted with JavaScript in Cesium Sandcastle, features roads color-coded and extruded based on our data analysis. The elevation and colour of the extrusions highlights where bikes enjoy an advantage in both ease and speed of transport.
Challenges we ran into
Sourcing sufficient data to accurately compare travel times for biking and driving without incurring excessive API costs. Our original ideas on how to compare biking and driving times involved a level of complexity which would have cost us in API usage. A simple solution was come to of calculating only the travel times to the centre of the city instead of many points across the city. This used under $5 in google maps API and still gave us a reasonable approximation of the relative speeds of biking and driving across the city.
The original data we created was randomly distributed across the city and gave us inconsistent results when heat maps were produced. The areas with higher density of data points were falsely elevated in the heat map. Luckily we came to the solution of using an even grid of data points spread across the city.
We were new to nearly every tool we used. Both of us beginners in Python, and both of us with no experience using APIs, JavaScript, Cesium, and working with geographic data. This made everything take a bit longer for us but it was a great learning experience.
Accomplishments that we're proud of
- Successfully executing the project with our limited coding expertise.
- Creating a visualisation that provides value to Montreal’s inhabitants while serving as a precedent for similar cities
- Completing the project on a tight deadline, having only decided to participate a week before the deadline.
What we learned
- The utility of APIs in project development.
- Coding and visualising data from a 2D environment in 3D
- Unity, Cesium and Googles products
- Collaborating remotely across continents is rewarding, bridging our locations through Google Meet.
What's next for Cars vs. Bikes in Centre-Ville
- Expanding outreach by sharing our project on Reddit and other social platforms.
- Implementing a version in unity that fully makes use of XR tech
- Turning our visualisation into a consumer facing product that can be experienced on all platforms by all walks of people. This may involve a web app where people can generate where the pedestrian friendly part of their city should be.
- Enhancing our model to account for local travel within neighborhoods, potentially comparing travel times to local amenities like grocery stores or community centers to better assess biking feasibility.
Built With
- 3d-photorealistic-tiles
- cesium
- cesium-sandcastle
- chatgpt
- github
- javascript
- jupyter
- maps-api
- montreal-open-data
- python
- visual-studio


Log in or sign up for Devpost to join the conversation.