-
-
MODEL_VALIDATION_GRAPH
-
RECOMMENDATION_2
-
RECOMMENDATION _1
-
MODE_VALIDATION
Inspiration
As a cricket fan, I noticed that captains often choose the next bowler by gut feel or by overall economy rate. Head-to-head records between a batter and a bowler are usually only a handful of balls, which is too little to trust, and no tool tells the captain how sure the numbers are. I wanted to build something that is useful and honest about its own uncertainty.
What it does
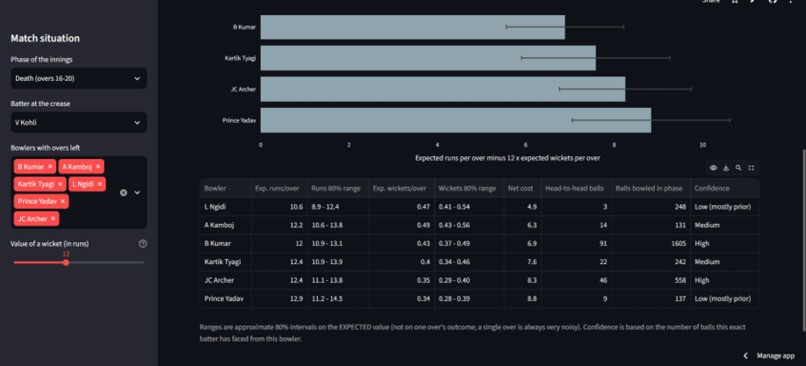
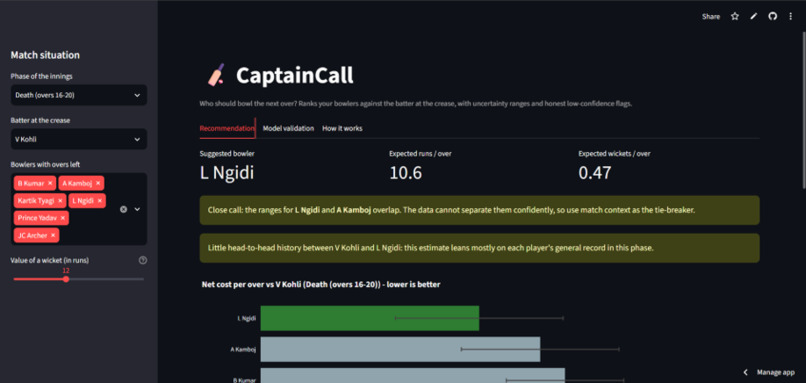
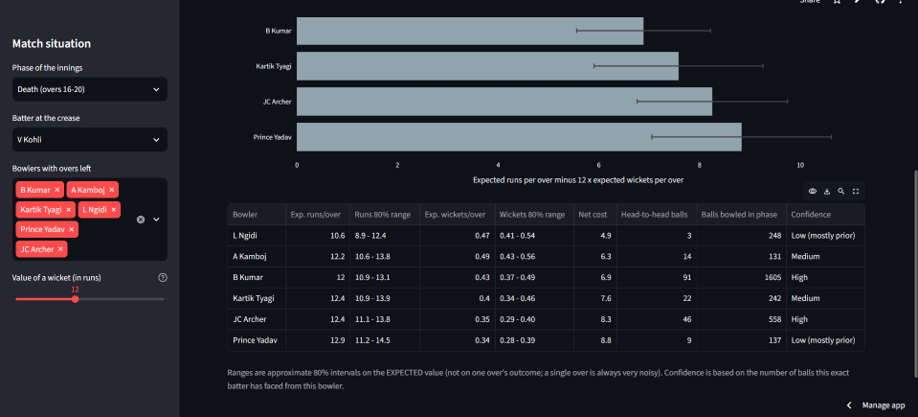
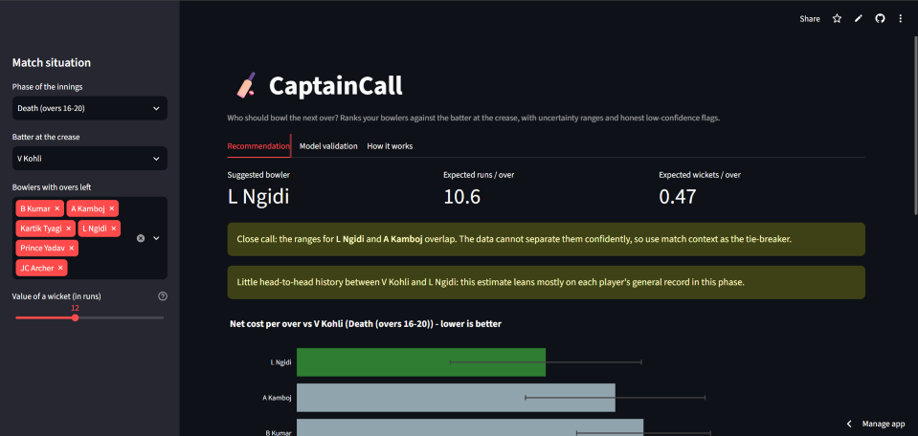
CaptainCall ranks the available bowlers against the batter at the crease in a chosen phase of an IPL innings (powerplay, middle, death). For each bowler it shows expected runs per over, expected wickets per over, and a net cost where the value of a wicket is adjustable. It also shows 80% uncertainty ranges, a "close call" warning when two options cannot be separated, and a low-confidence flag when there is little head-to-head history.
How we built it
- Data: IPL ball-by-ball records from Cricsheet, reduced to one row per delivery. Runs charged to the bowler are bat runs plus wides and no-balls, and run-outs and retirements are not counted as bowler wickets.
- Model: league averages are computed separately for each phase. Each batter's and bowler's phase rate is shrunk toward the league average depending on how many balls they have faced or bowled, and a head-to-head adjustment is added that is also shrunk heavily.
- Uncertainty: ranges come from the effective sample size behind each estimate (a Beta distribution for wickets).
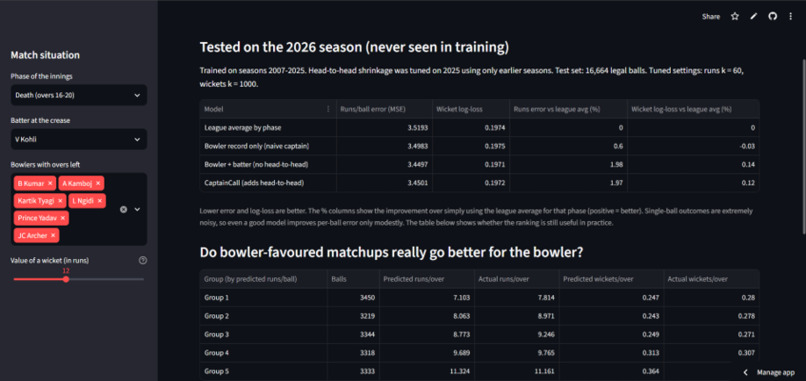
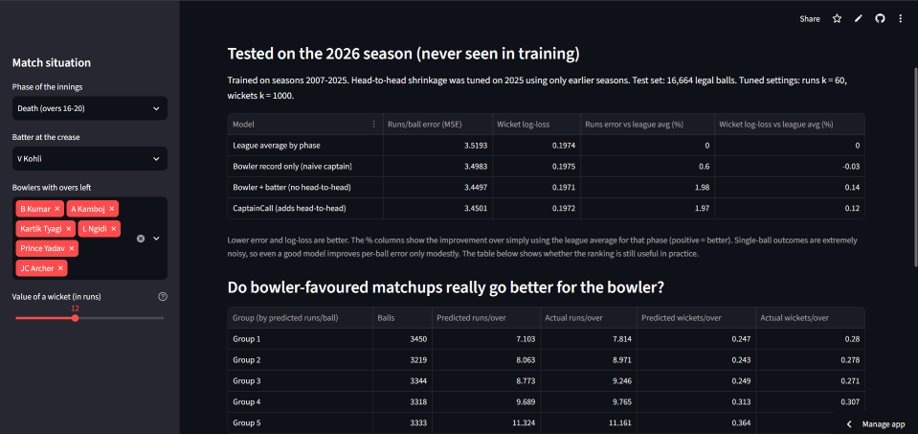
- Validation: time-ordered. Trained on 2007-2025, shrinkage tuned on 2025 using only earlier seasons, tested on 2026.
- Stack: Python, pandas, NumPy, SciPy, Streamlit and Plotly, deployed on Streamlit Community Cloud.
Challenges we ran into
- Batter-vs-bowler samples are tiny, so raw head-to-head numbers are misleading. Shrinkage was needed to avoid over-trusting a few lucky balls.
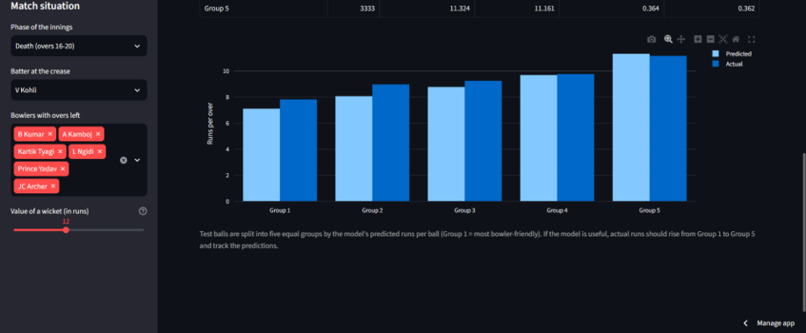
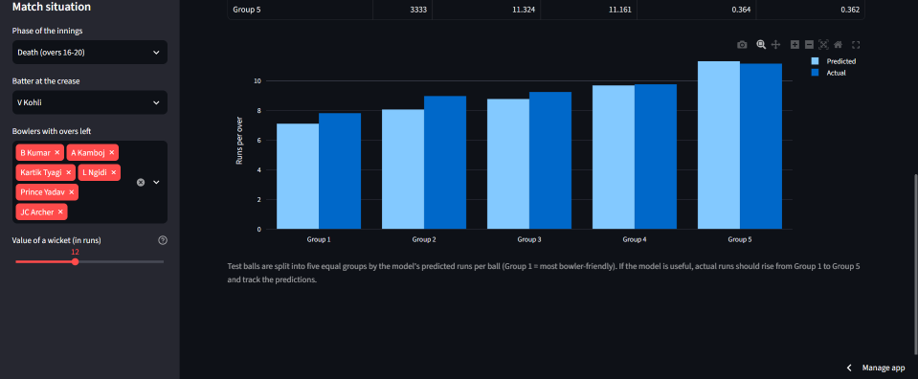
- Single-ball outcomes are very noisy, so per-ball error improves only modestly. I added a grouped validation view to show whether the ranking still separates good matchups from bad ones.
- Wickets are rare, so wicket prediction is much harder than runs prediction.
Accomplishments that we're proud of
On the 2026 season (16,664 balls never seen in training), the batter + bowler phase model cut per-ball runs error by about 2.0% versus the league average, compared with 0.6% for the naive "bowler record only" approach. When test balls are split into five groups by predicted runs, actual runs per over rise from 7.8 (most bowler-friendly) to 11.2 (most batter-friendly), so the ranking separates real differences of about 3.3 runs per over.
I am also proud that the app reports its limits instead of hiding them: wicket prediction improved only marginally, and the head-to-head adjustment added no measurable accuracy beyond batter and bowler effects, so the app flags low-confidence matchups.
What we learned
- Honest validation matters more than a flattering number. A null result for head-to-head is still a useful finding.
- Shrinkage is a simple, powerful way to handle small samples in sports data.
- Communicating uncertainty (ranges, close-call warnings) makes a model more useful to a decision maker.
What's next for CaptainCall
- Model match state (score, wickets in hand, target), which is currently ignored.
- Add pitch, venue, bowler type and fatigue.
- Correct the under-prediction of runs in bowler-friendly matchups seen in the 2026 test.
- Extend to other T20 leagues.
Data: Cricsheet (cricsheet.org).

Log in or sign up for Devpost to join the conversation.