-
Demo

Inspiration
We only use online banking such as Sterling, Monzo etc. We got the inspiration from the application insights. What we wanted to achieve is to provide users of CapitalOne with visualized information easily by scripting.
What it does
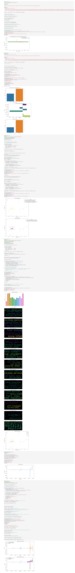
It takes the data from the API. l The visualization result shows all kinds of transactions including fraud transactions history through a map where the transactions are made and shows the clustered result of transactions by message. It also displays how much each merchant earned and the number of transactions made by each fraud account.
How we built it
We shared our ideas what to visualized and divided our groups into two. We then decided what which area we want to focus in such as transactions and frauds. Then we decided how to visualize it such as maps, graphs, and clusters. We used pandas, flask
Challenges we ran into
Setting up the postman Analyzing the data from the API (Initially there was a lot of data.)
Accomplishments that we're proud of
We are proud of making our own visualization deciding the standard to cluster datas that users would be curious
What we learned
API, NLP, Postman, GitHUB
What's next for CapitalOne_BEE
Try to automate fully process Implement large language model

Log in or sign up for Devpost to join the conversation.