-
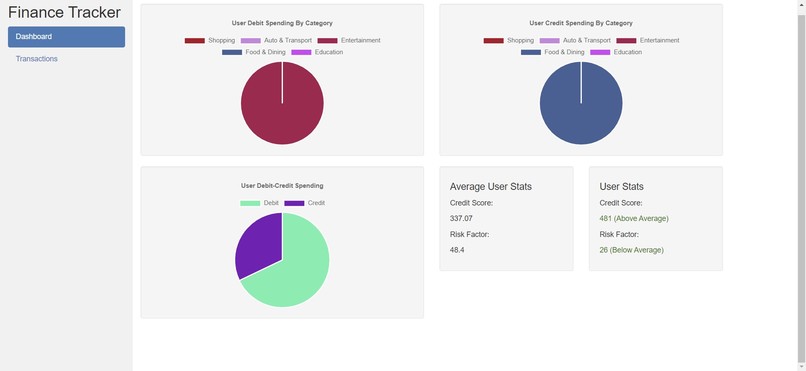
Dashboard Page (Shows all data and insights on user spending)
-
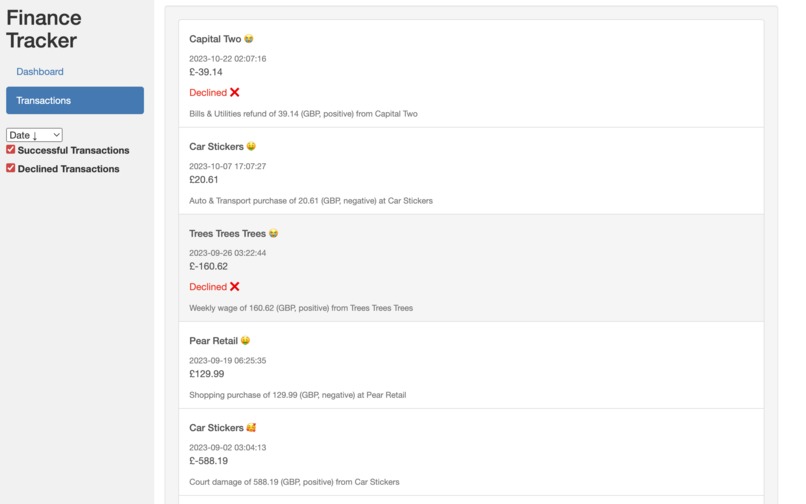
Transactions Page (Shows all transactions for the user)
-
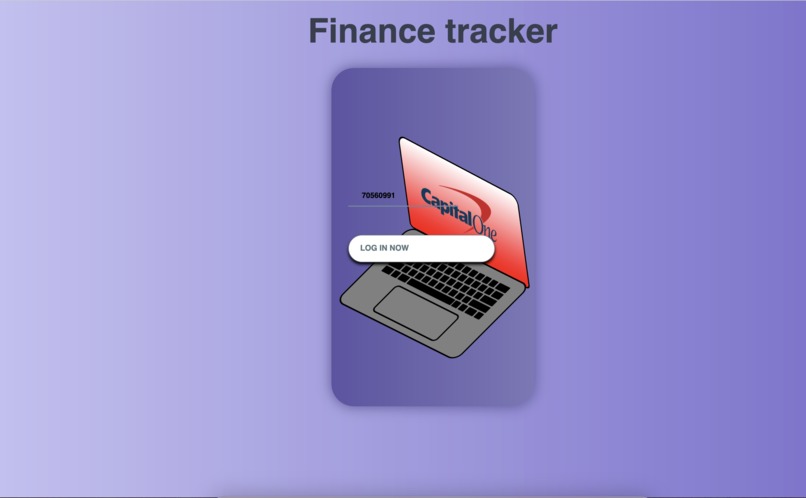
Login Page (Allows user to login with user id)


Inspiration
With the cost-of-living crisis, it's never been more important to work on your credit. We think that the best way to improve is by being able to visualise your spending habits so we decided to build a finance tracker that gives you access to this data so you can learn from and improve your credit.
What it does
It allows the user to log in using their unique user ID. They are then presented with the dashboard which updates in real-time and displays the following:
- A pie chart showing their debit spending by category.
- A pie chart showing their credit spending by category.
- A pie chart showing their debit-credit usage.
- Average user credit score.
- Average user risk score
- Specific user credit score (and compares to average)
- Specific user risk score (and compares to average) They can then also use the menu to go to see all of their transactions to analyse their spending further.
How we built it
We divided the work amongst ourselves, ensuring an even workload. We all did our parts on separate branches and then worked together to merge them into the main branch and solve any conflicts.
Challenges we ran into
Lots of minor bugs taking up lots of time to find and fix.
Accomplishments that we're proud of
Managed to change project 9 hours in and still create a fully functioning project on time to a high level for fidelity.
What we learned
Teamwork makes the dreamwork.
What's next for Capital One Finance Tracker
In the future, we would like to add more analytics to make the most of the data provided from the API.


Log in or sign up for Devpost to join the conversation.