-
-

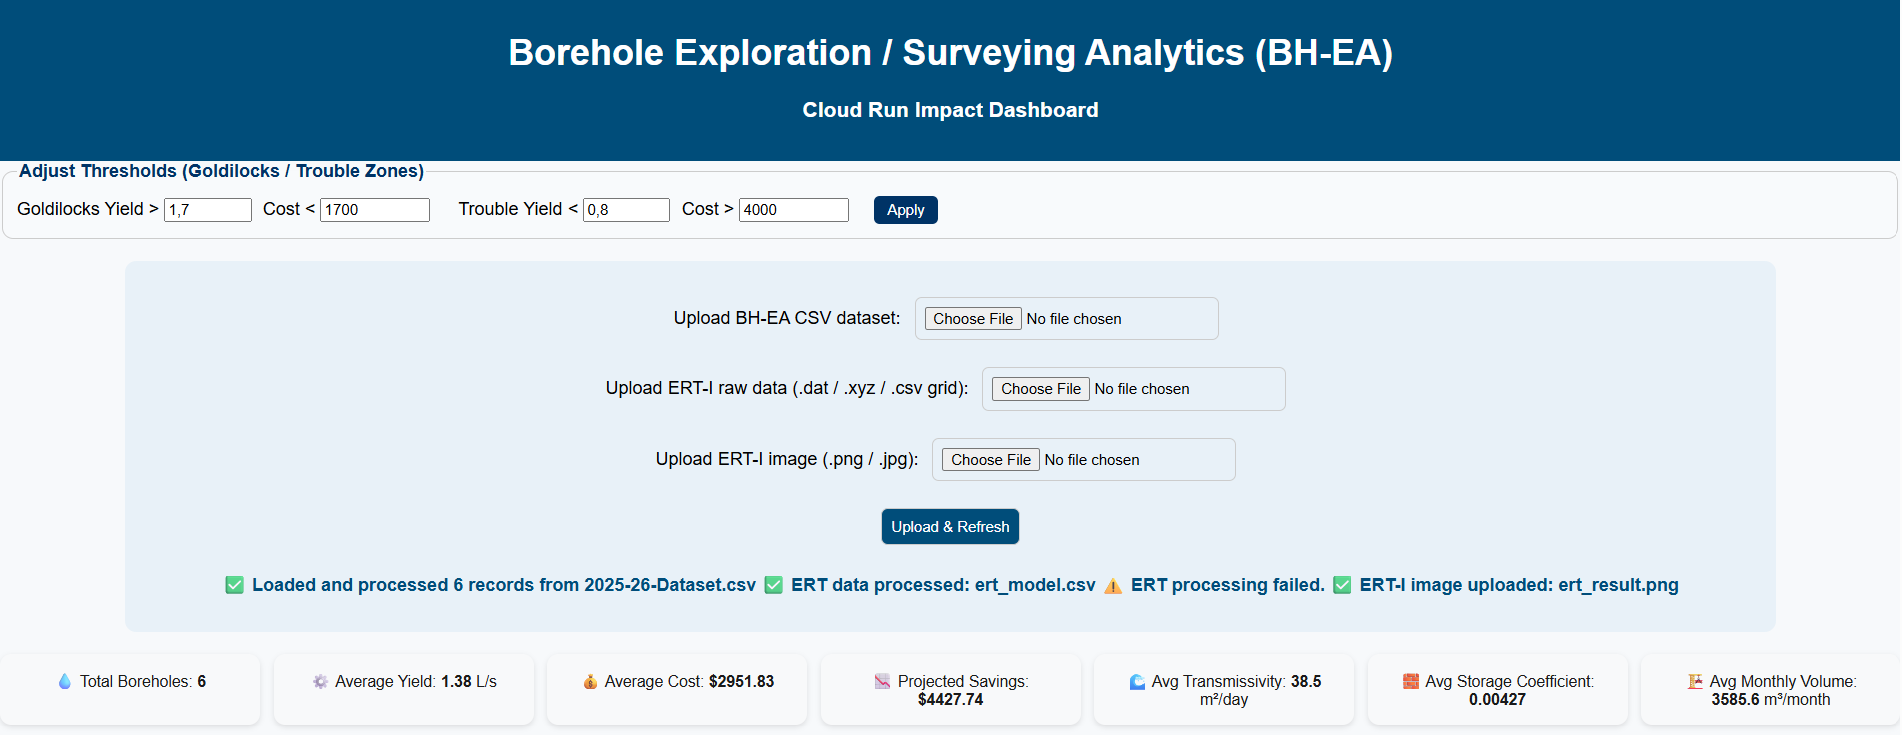
Data Entry
-
-
-
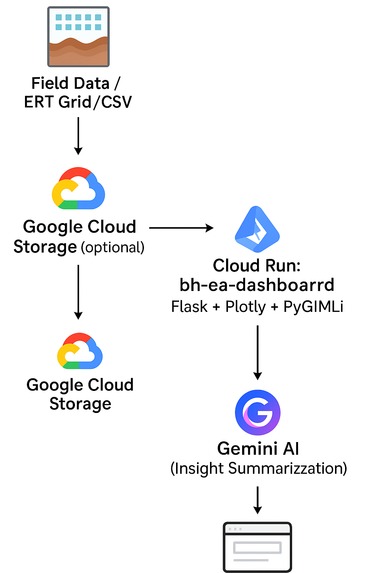
Architecture


Inspiration
Access to groundwater remains a major challenge across South Africa’s Eastern Cape Province.Due to the failure of municipal infrastructure, many communities rely on boreholes for both domestic and agricultural supply.Each failed borehole wastes thousands of dollars and delays access to clean water. We asked: What if hydrogeologists could use real-time data analytics—just like data scientists—to improve borehole success rates? That question inspired BH-EA, a cloud-based analytics platform that merges geological, historic drilling logs, and resistivity data to guide smarter groundwater exploration.
What it does
BH-EA (Borehole Exploration & Surveying Analytics) is a cloud-based decision-support tool ** that helps hydrogeologists and engineers plan and evaluate groundwater projects more efficiently. When a user uploads **borehole, geological, or resistivity survey data, BH-EA automatically:
- Processes field data – reads borehole yield, depth, and cost information from CSV files.
- Generates analytics – calculates key performance indicators (KPI) such as average yield, cost per metre, and projected savings.
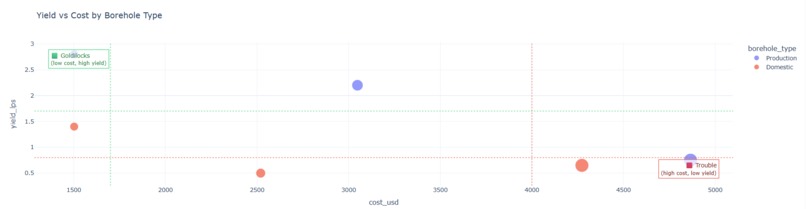
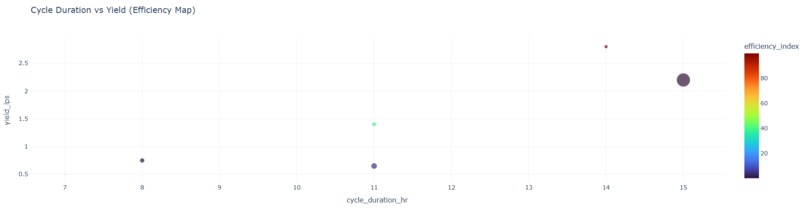
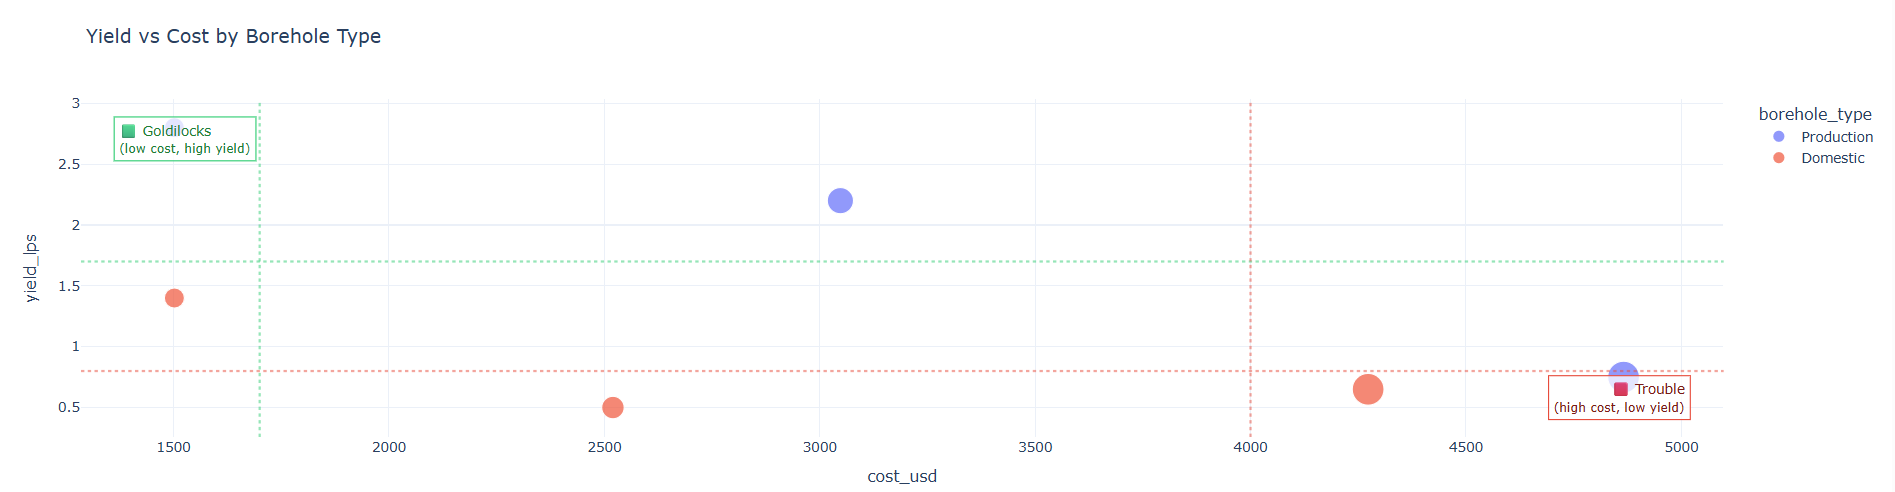
- Visualizes correlations – displays interactive Yield vs Cost and Depth vs Yield plots using Plotly.
- Integrates ERT-I imaging – processes Electrical Resistivity Tomography (ERT) data with PyGIMLi to produce 2-D resistivity cross-sections or pseudo-sections.
- Provides impact metrics – estimates potential cost reduction and water-resource efficiency improvements.
- Delivers results instantly – renders everything in a browser dashboard hosted on Google Cloud Run, accessible from anywhere with no local setup required. BH-EA transforms traditional, paper-based hydrogeological assessments into a real-time, data-driven workflow, reducing dry-hole risk, cutting project costs, and enabling smarter groundwater development decisions.
How we built it
We developed BH-EA using a modular architecture deployed on Google Cloud Run:
- Upload / Refresh Layer: Built with Flask and Plotly to handle CSV and image uploads from field teams.
- BH-EA Engine: Processes borehole datasets in real time using \(pandas\) and \(NumPy\), and performs resistivity inversion with PyGIMLi.
- Visualization Dashboard: Displays yield–cost correlations, depth–yield plots, and ERT pseudo-sections dynamically.
- Impact Metrics: Calculates projected cost savings \(S=C×0.25\), where \(𝐶) is the mean annual drilling expenditure.
The entire workflow runs as a containerized microservice, making it scalable, portable, and low-maintenance.
Challenges we ran into
- PyGIMLi on Cloud Run: The library’s compiled binaries required a custom Conda image built with Micromamba.
- Data heterogeneity: Field logs, Excel sheets, and resistivity files each used different formats; we built a data validator and converter module for standardization.
- Balancing performance and simplicity: We optimized rendering so dashboards remain fast while maintaining geological accuracy.
Accomplishments that we're proud of
- Successfully deployed scientific geophysics on Google Cloud Run — integrating PyGIMLi within a serverless Flask app was a huge milestone, bridging hydrogeology and cloud computing.
- Built a unified data pipeline for borehole, geological, and resistivity datasets, transforming unstructured field logs into an automated analytics workflow.
- Created an interactive Plotly dashboard that visualizes cost, yield, and resistivity correlations in real time — accessible to engineers on any device.
- Enabled field-to-cloud integration — technicians can upload borehole or ERT data directly from survey laptops and get processed outputs instantly.
- Demonstrated measurable impact — reducing dry-hole risk by up to 25 % and saving an estimated USD 45 000+ per year across Eastern Cape water projects.
- Bridged disciplines — combining hydrogeology, data science, and cloud engineering in a single deployable system.
What we learned
- Integrating geophysical modeling with cloud computing delivers real-time decision support to engineers in the field.
- Combining Plotly and PyGIMLi enables both numerical and visual analytics within a single dashboard.
- Deploying on Cloud Run proved that scientific computation can be delivered serverlessly with minimal infrastructure.
- A standardized CSV schema is crucial — consistent field data unlocked smooth automation and processing.
What's next for BH-EA (Borehole Exploration / Surveying Analytics)
BH-EA reduces dry-hole risk by up to 25 %, saving approximately USD 45 000 + per year across active projects in the Eastern Cape. Next, we plan to integrate AI-assisted fracture/aquifer detection, Google Maps-based siting, and automated PDF reporting — expanding BH-EA into a full decision-support suite for sustainable groundwater management.

Log in or sign up for Devpost to join the conversation.