-
-
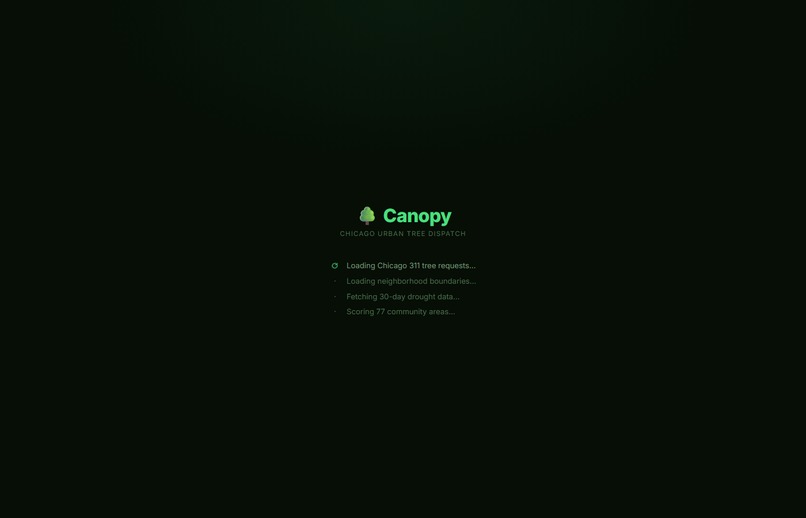
Canopy fetches four live data sources on boot: Chicago 311 requests, neighborhood boundaries, drought data, and the Hardship Index.
-
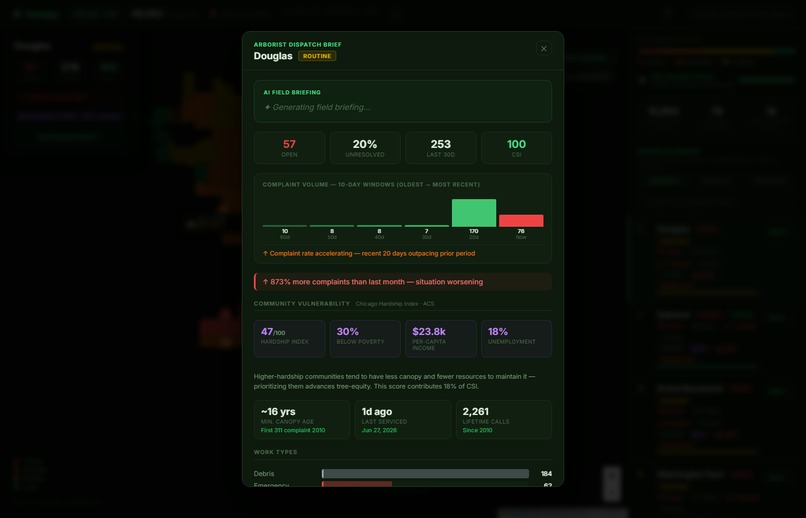
Canopy boots by pulling four live data sources: Chicago 311 requests, boundaries, 30-day drought data, Hardship Index.
-
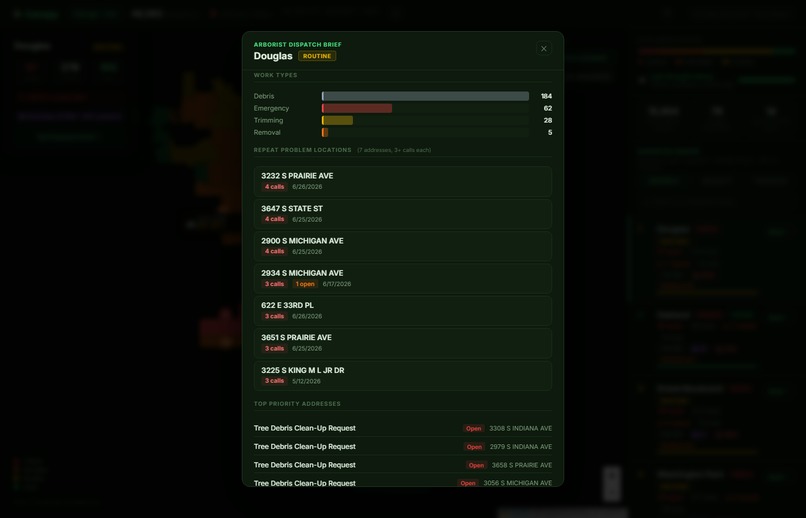
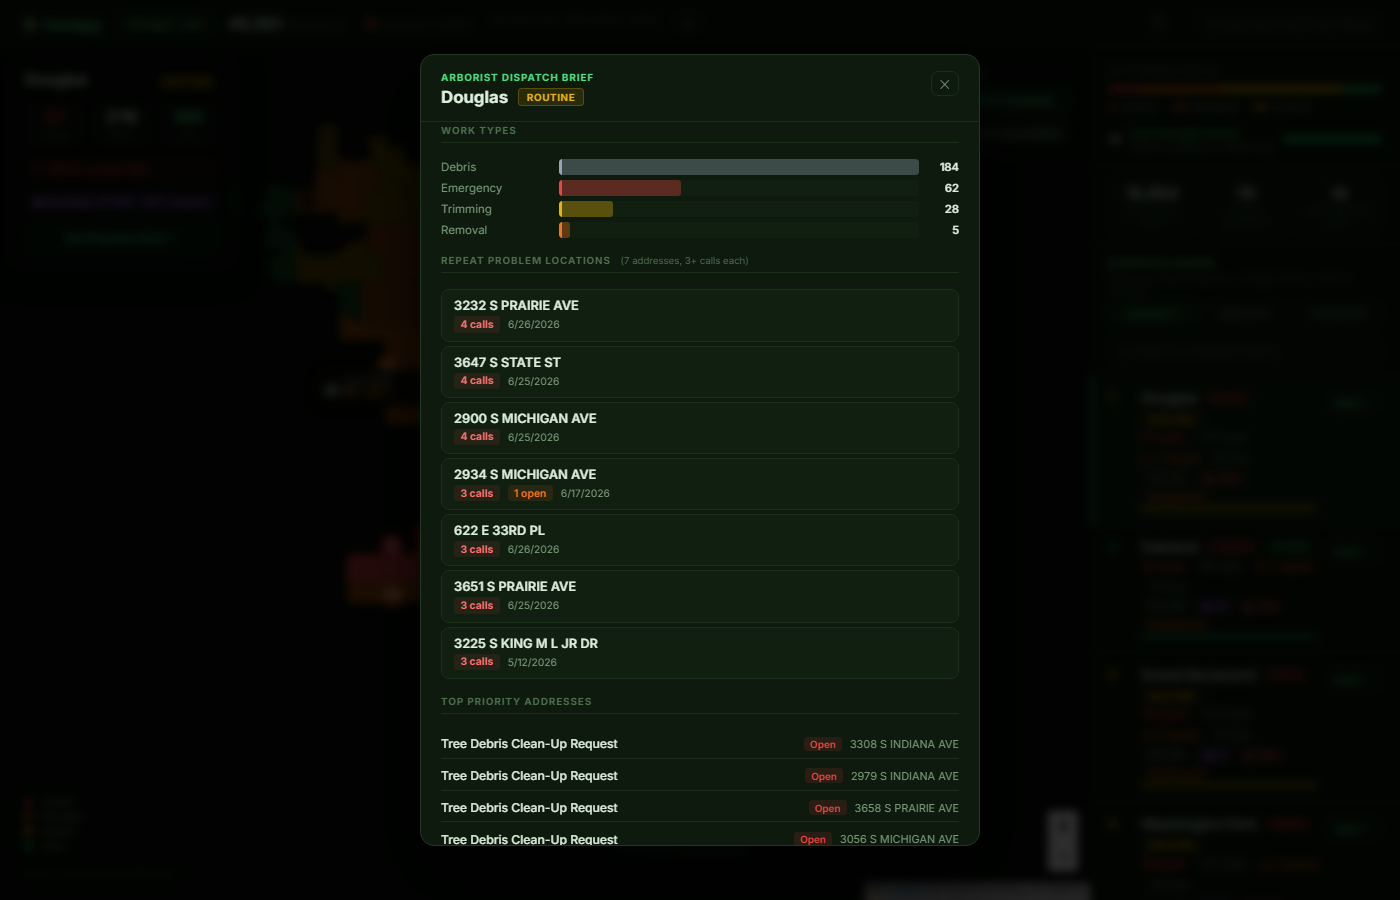
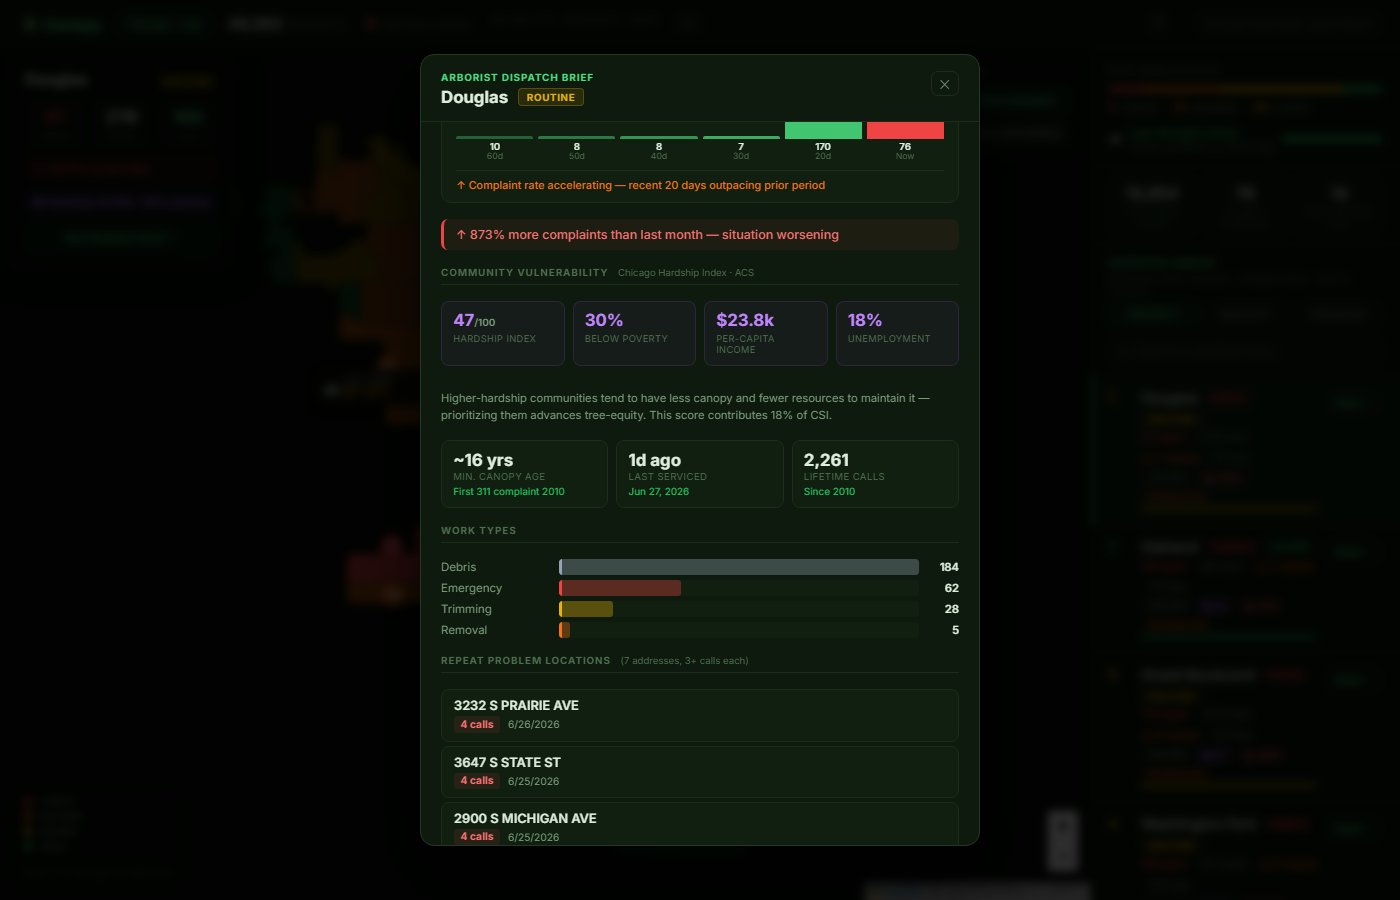
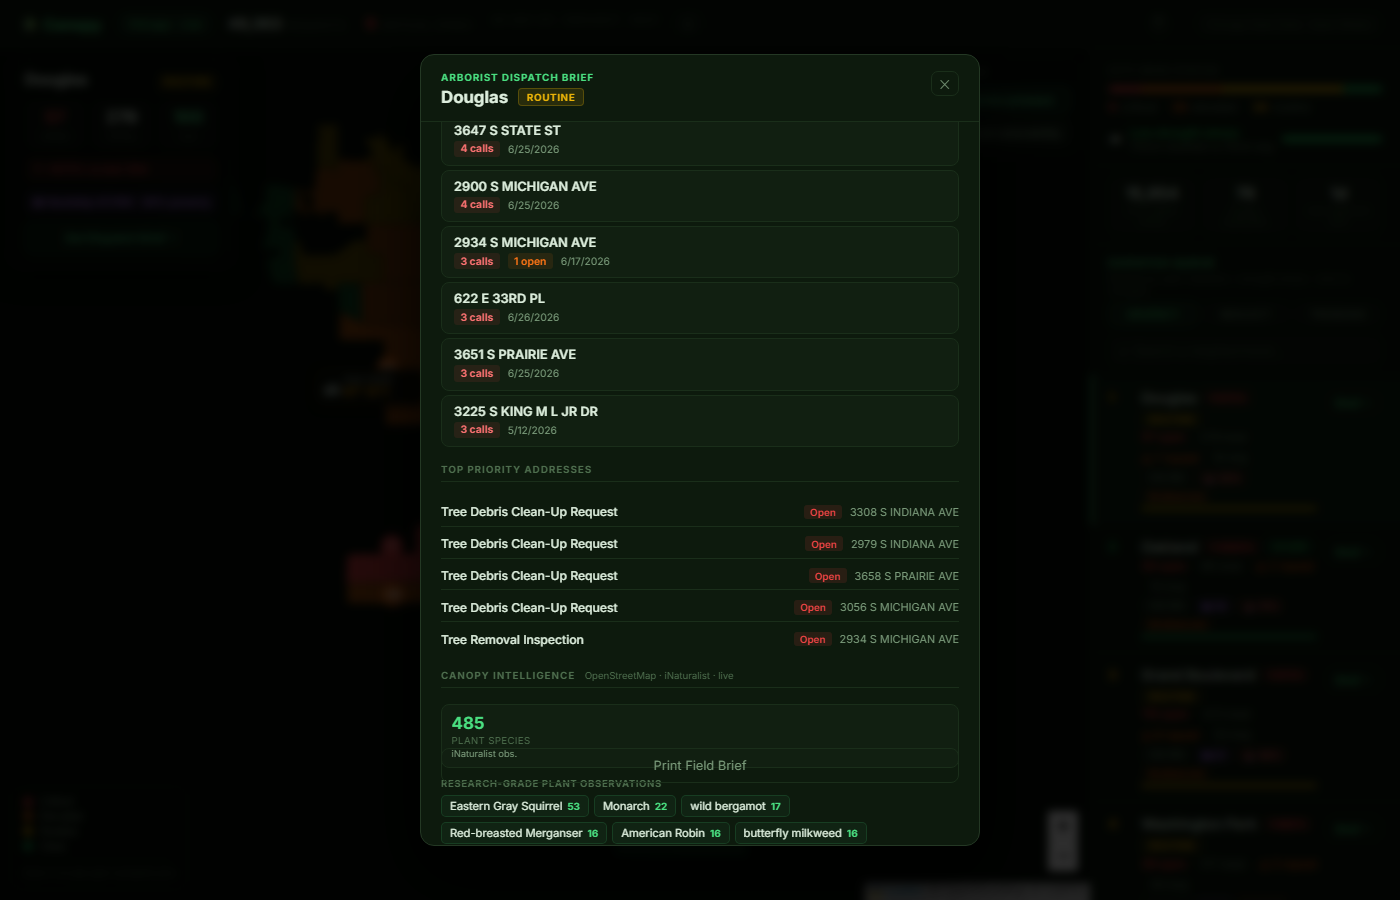
Work-type breakdown and repeat-problem addresses. Crews know which blocks are generating the most callbacks before they leave the depot.
-
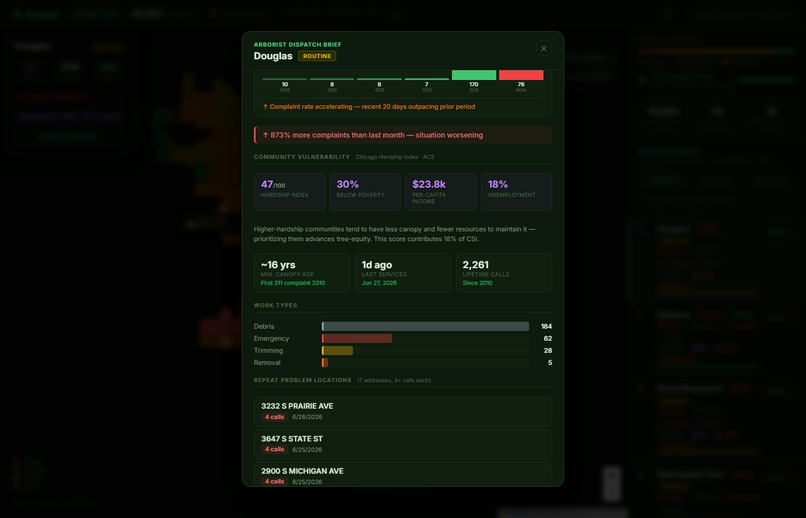
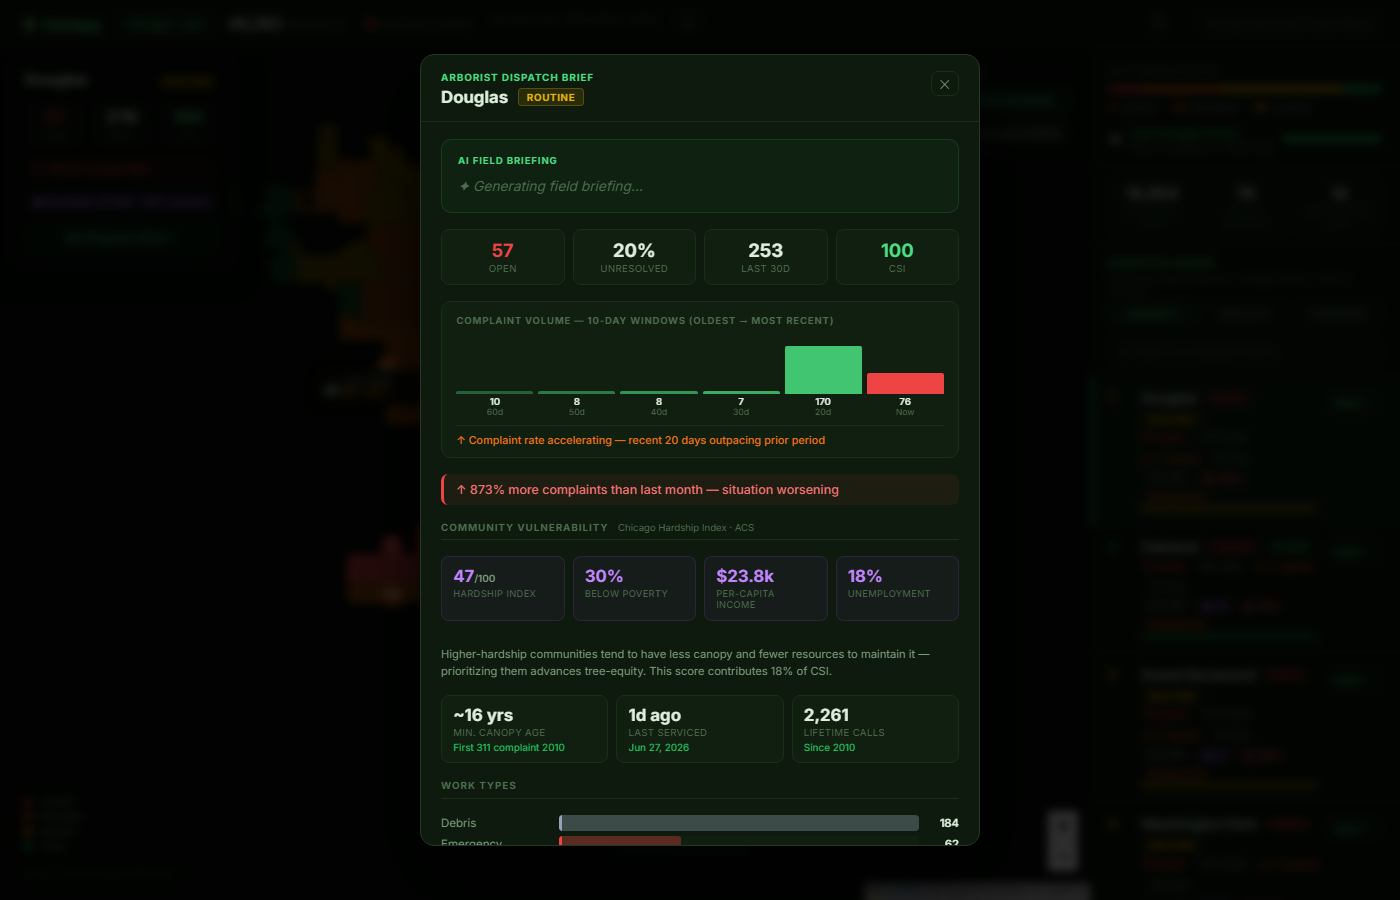
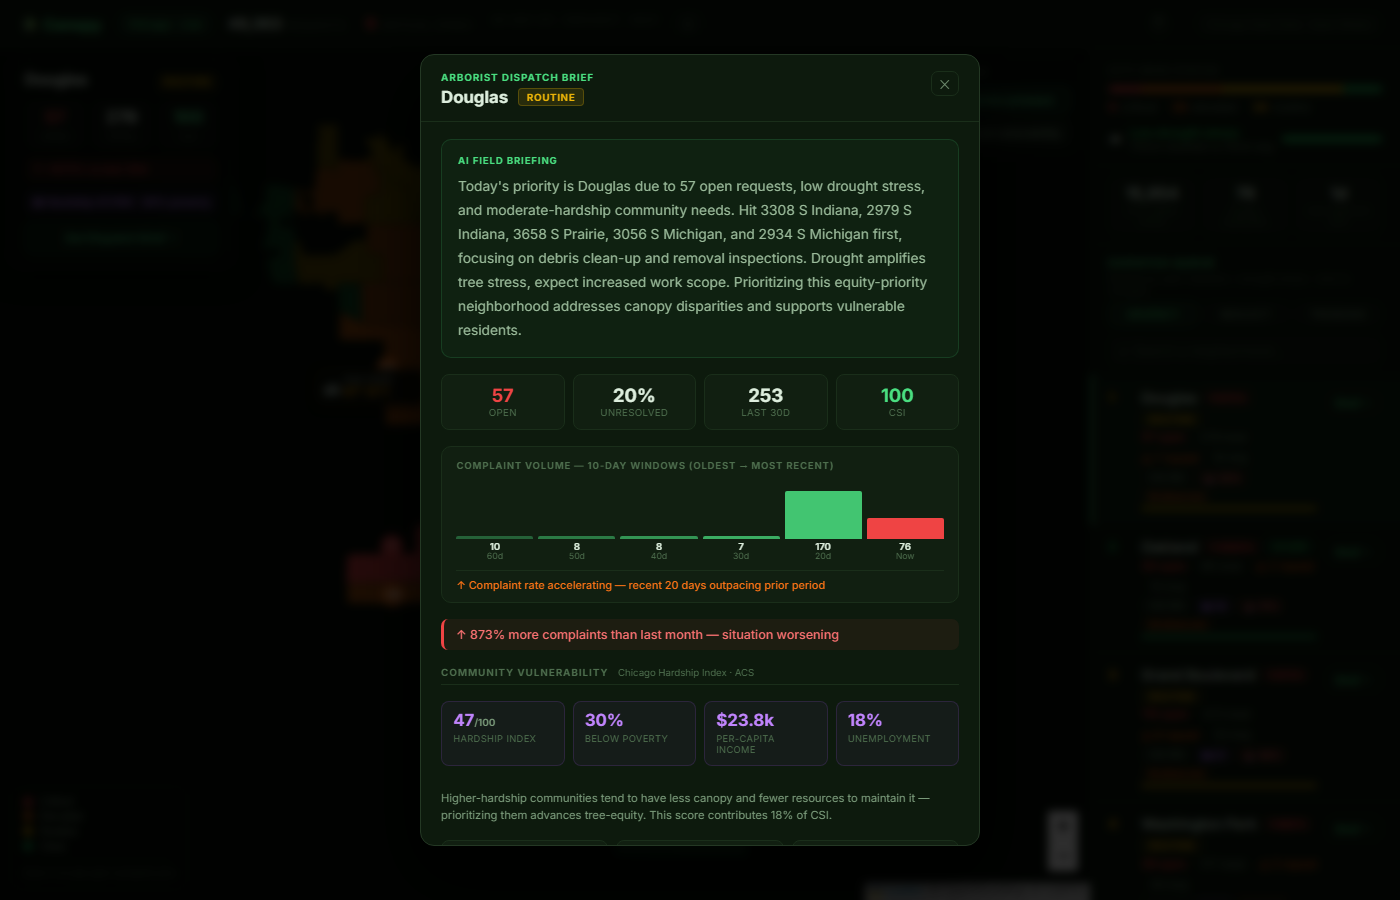
30-day complaint trend chart. Supervisors see whether pressure is building or spiking — context the CSI score alone can't convey.
-
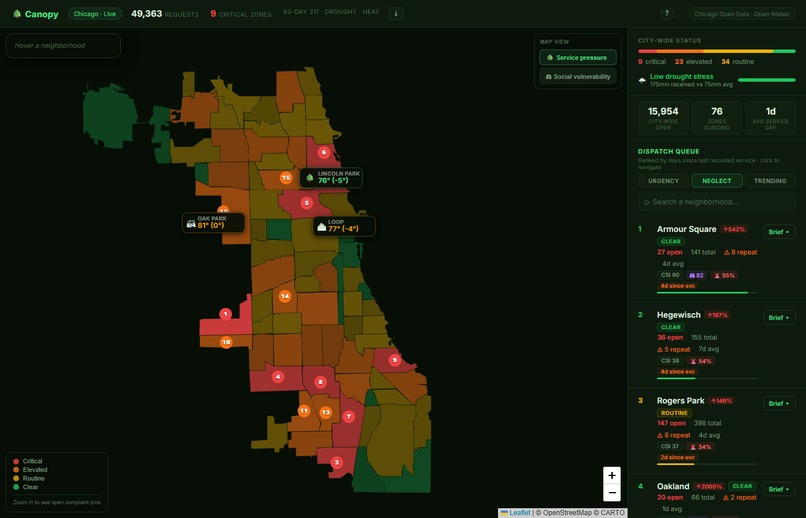
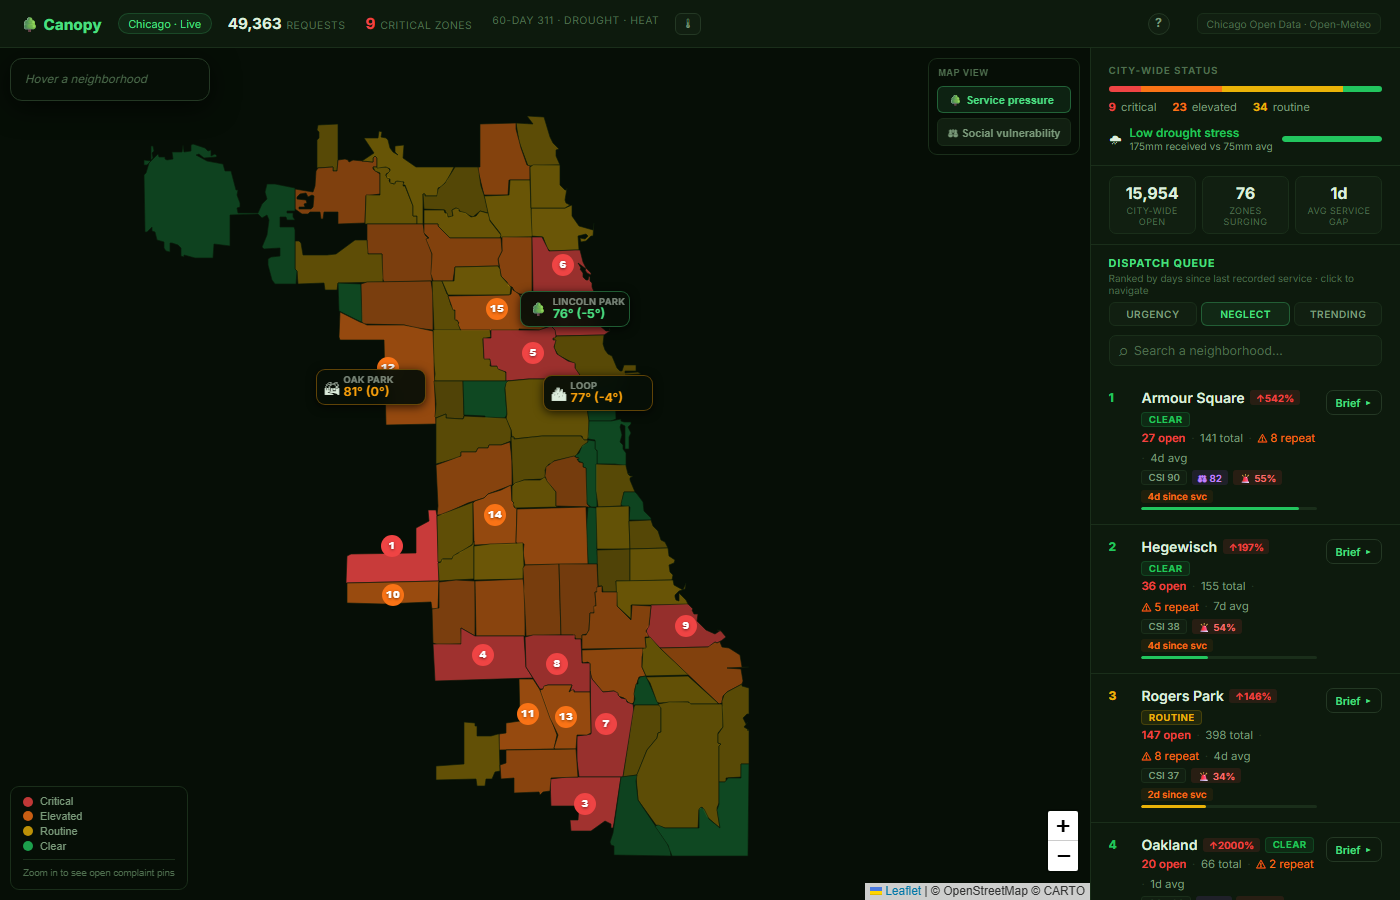
Neglect sort surfaces zones with the longest service gaps — exposing neighborhoods that are under-served, not just under-reporting.
-
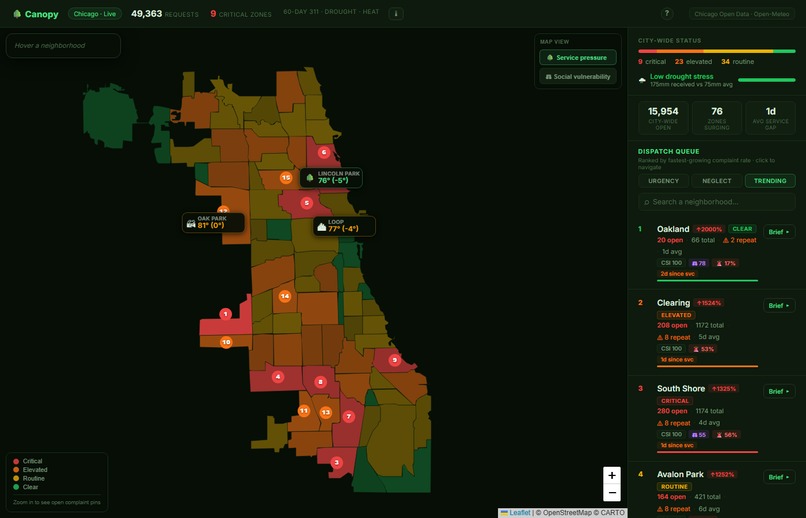
Trending sort ranks zones by fastest-rising complaint rate. Supervisors see which neighborhoods are spiking before backlogs compound.
-
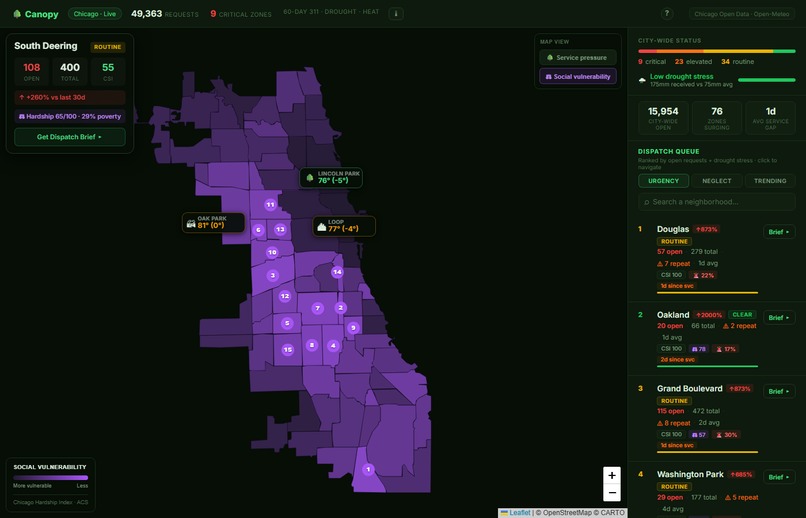
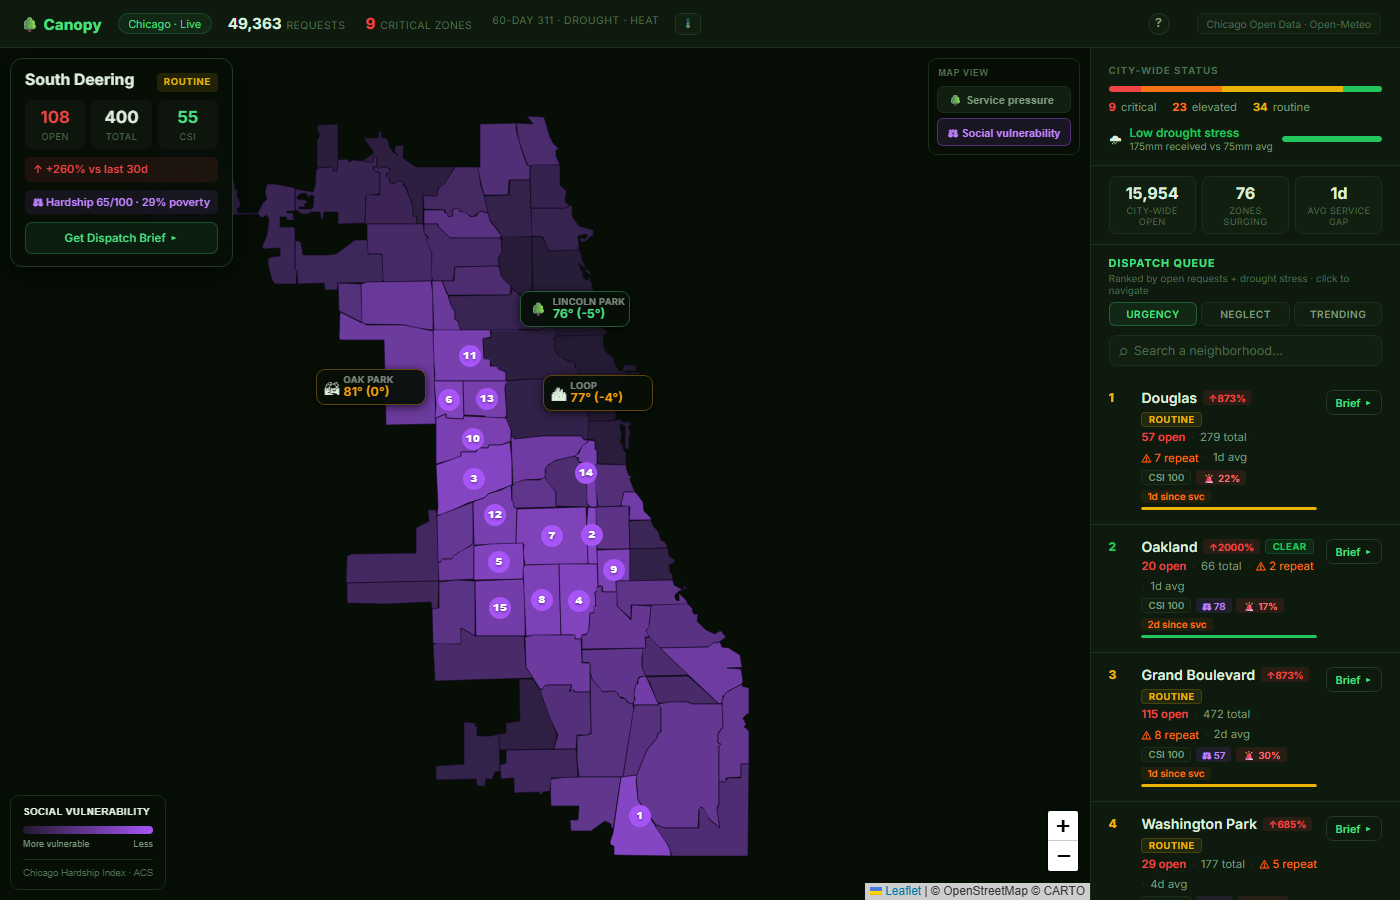
Social Vulnerability overlay via the Chicago Hardship Index. stress zones map almost exactly onto the city's most disadvantaged communities.
-
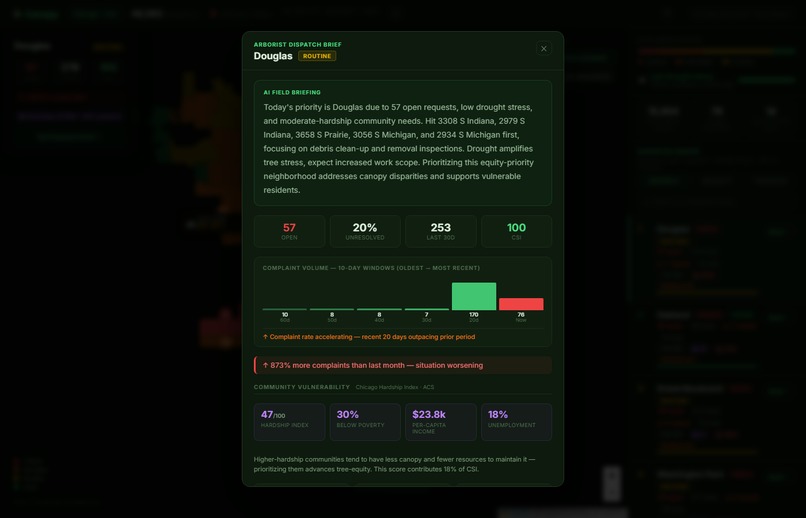
Completed AI brief, written like a urban forestry supervisor. Explains today's priority, driving conditions, and what crews will find.
-
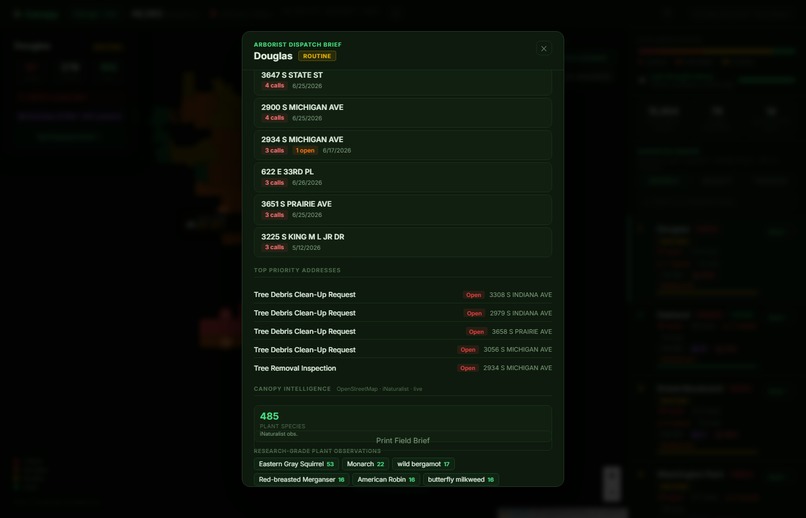
Live canopy intelligence from OpenStreetMap and iNaturalist: species present, biodiversity, recent sightings.
-
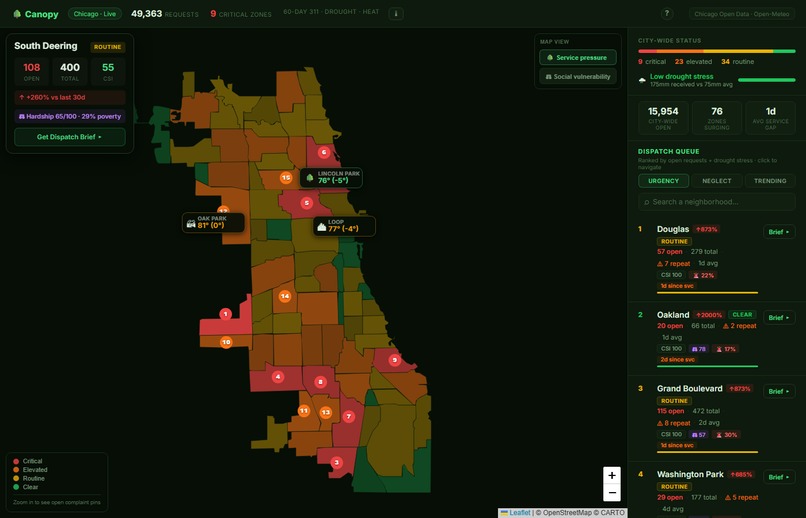
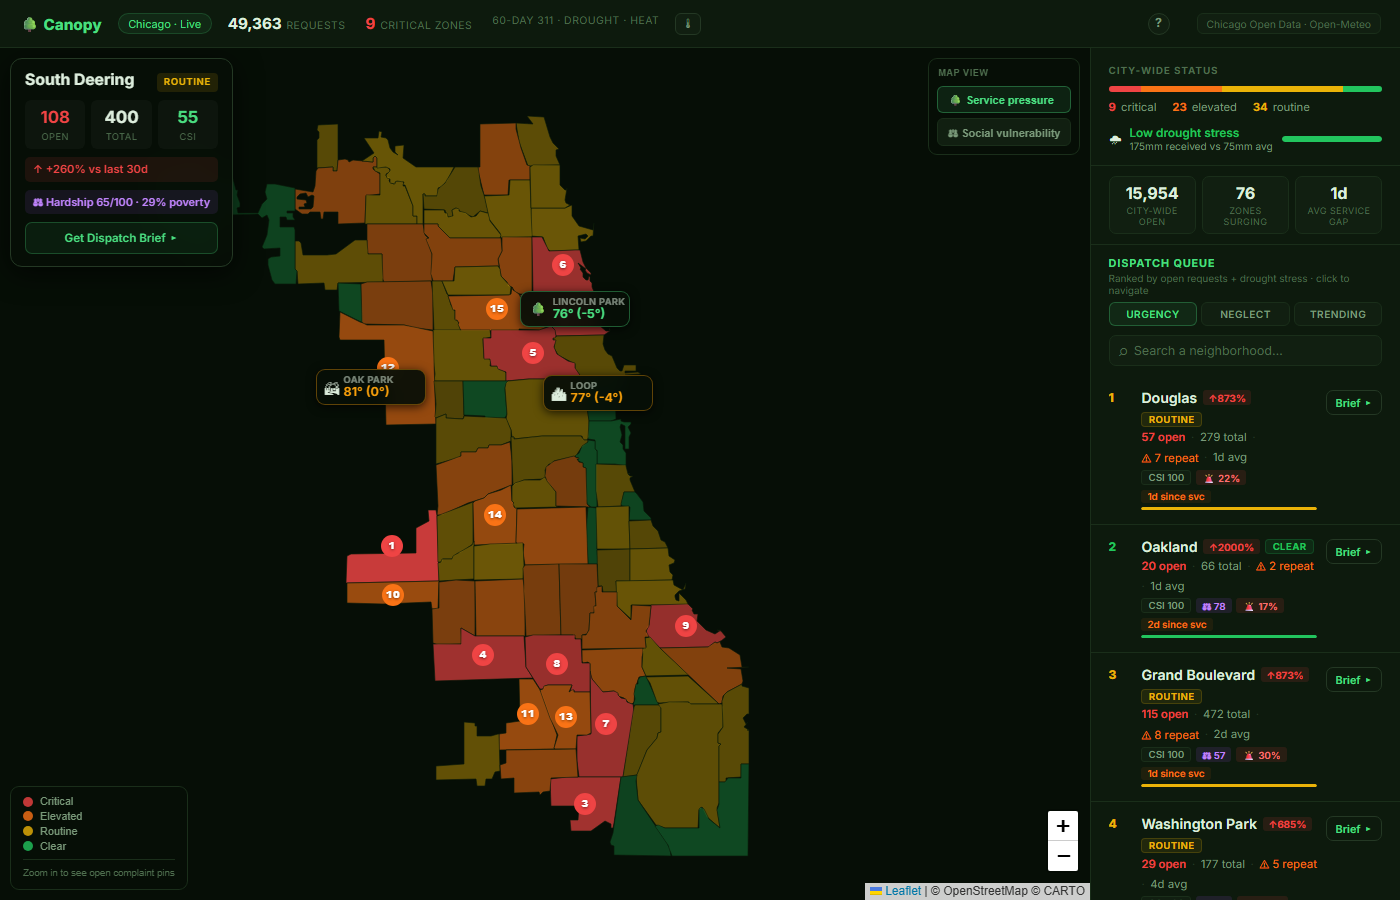
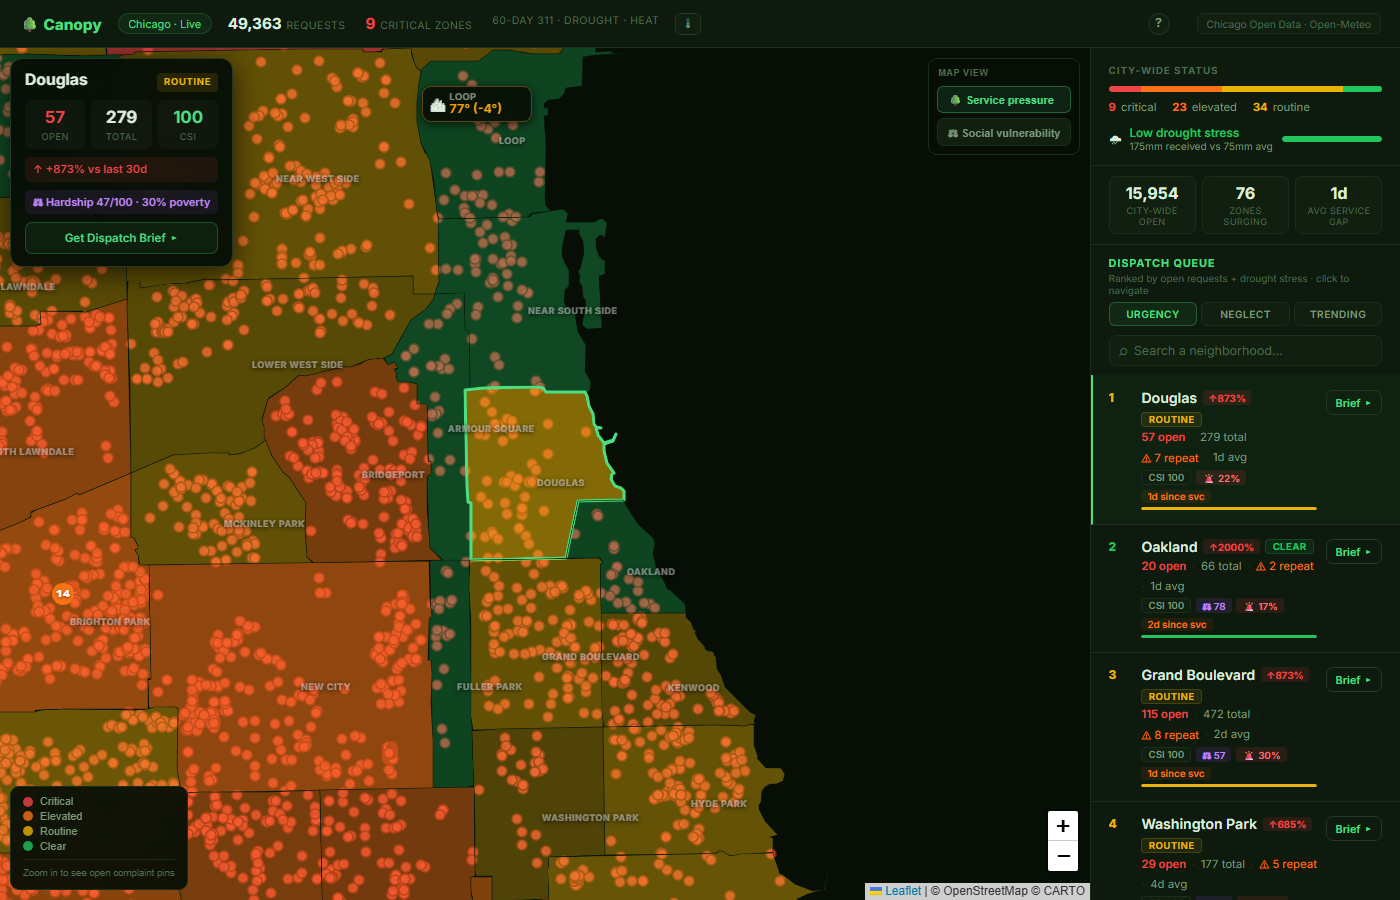
Dispatch queue sorted by CSI. Each row shows zone name, tier, score, open request count, and a one-click AI field brief button.
-
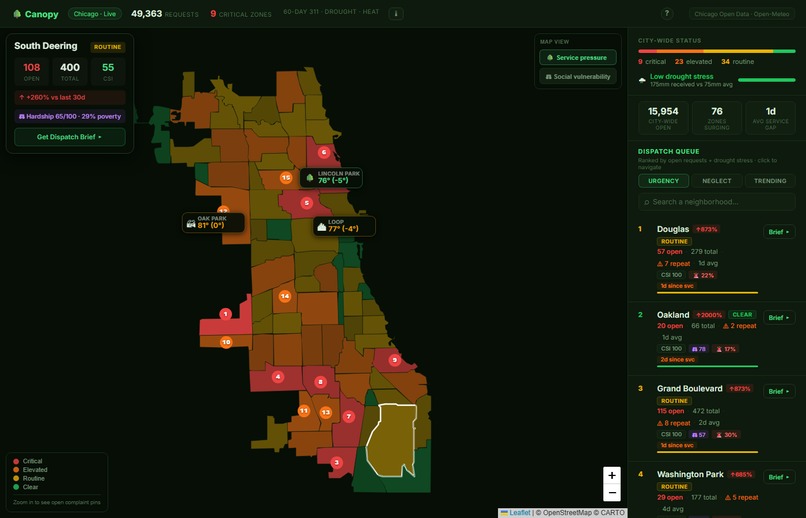
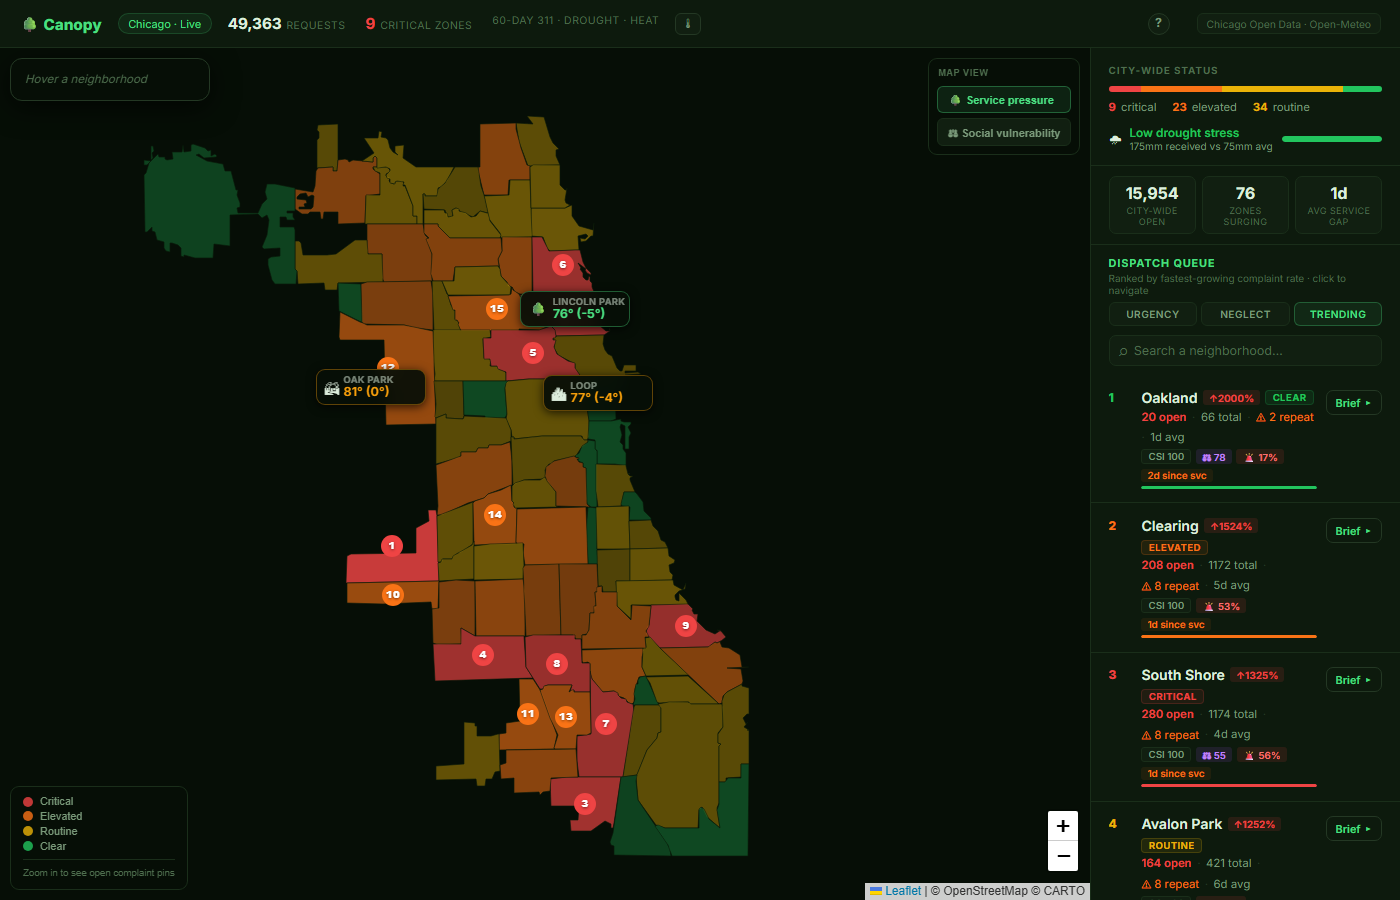
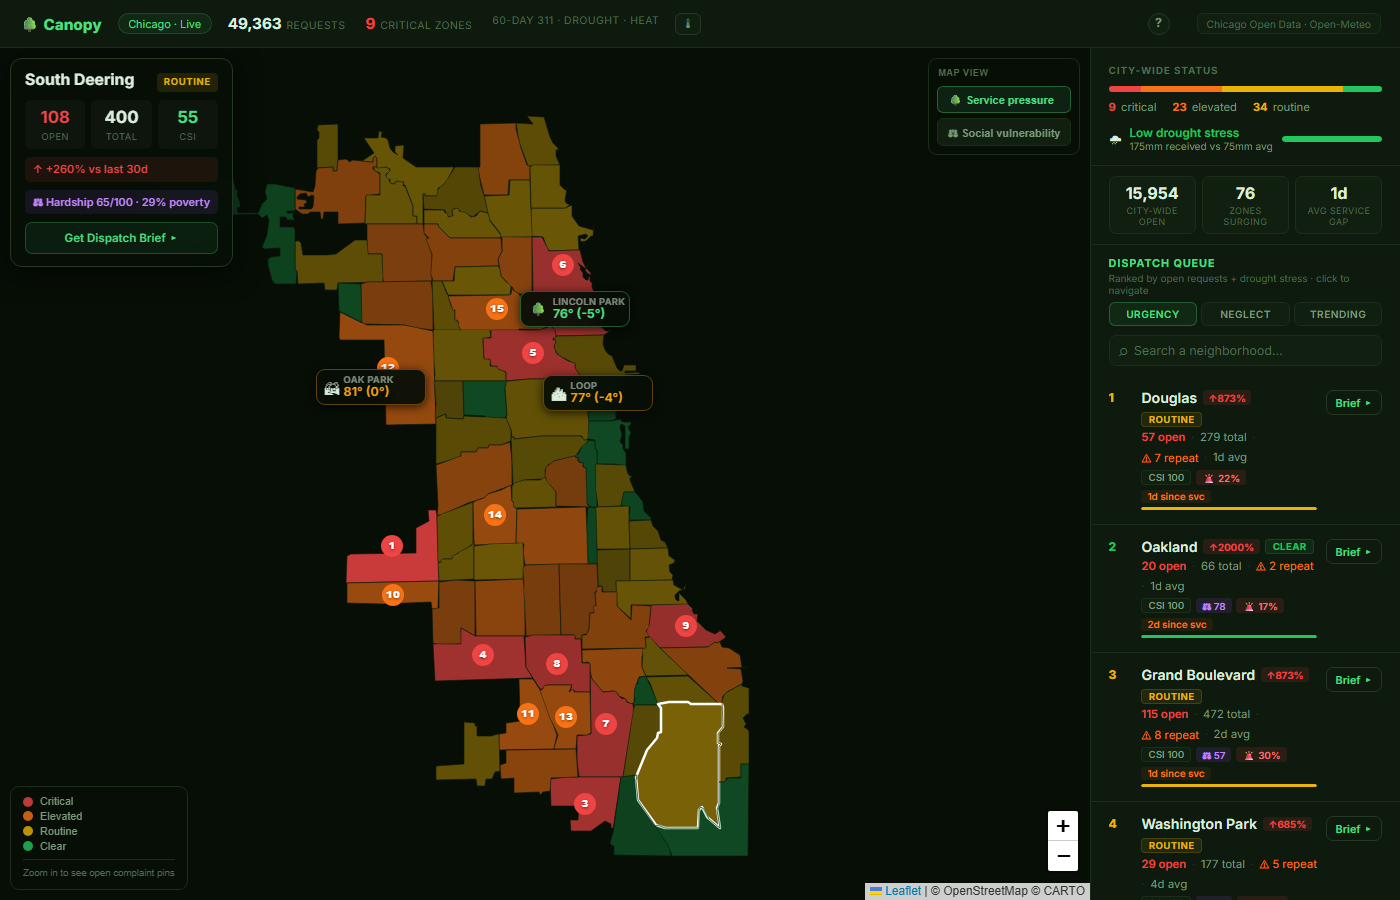
Service Pressure view: all 77 community areas shaded by tree-service demand. Red = critical. South and west sides bear the load.
-
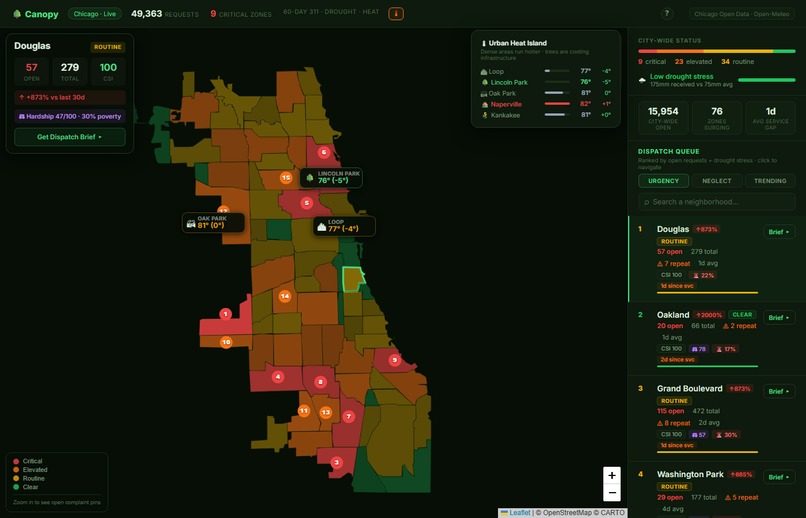
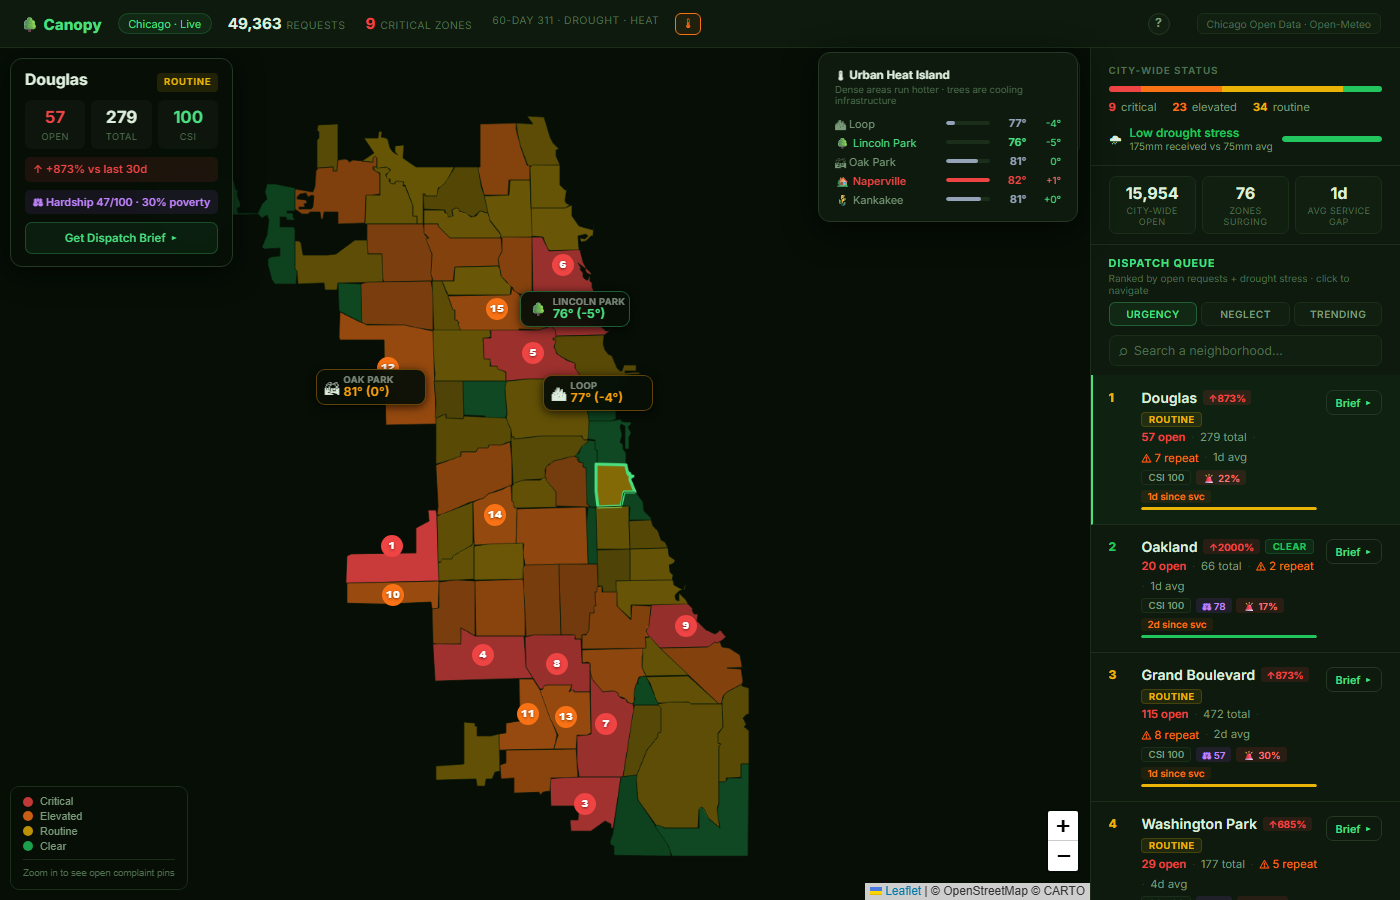
The heat island dropdown shows live temps across Chicago. Tree-poor areas run 5–8°F hotter — canopy coverage is a public health issue.
-
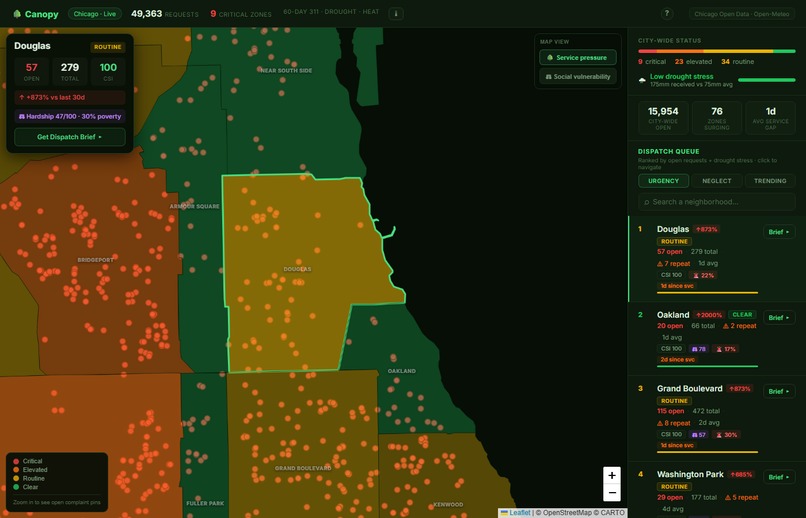
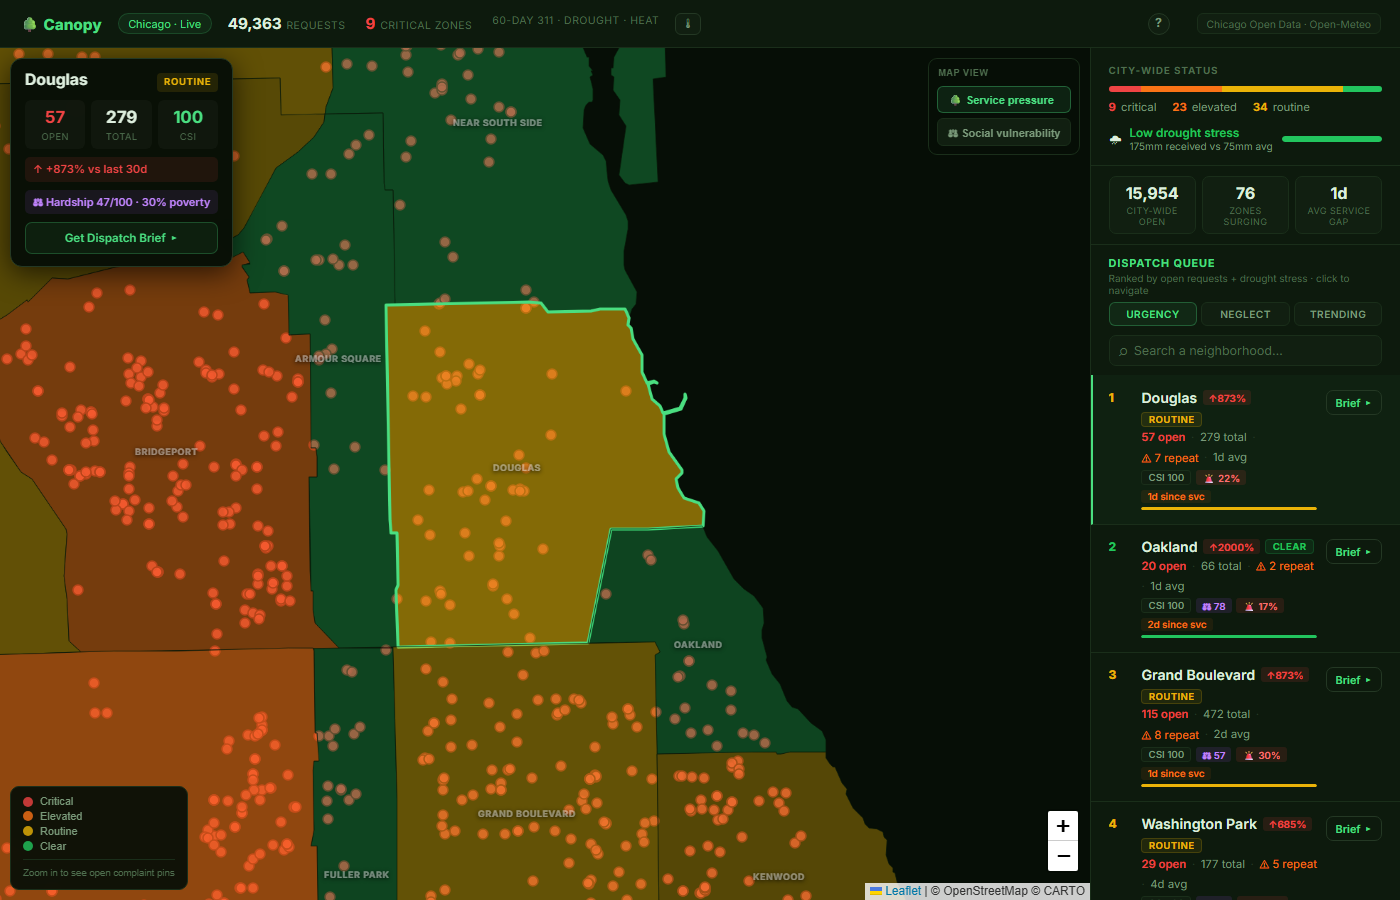
Zooming in reveals individual 311 request pins — real, open service calls. Crews can plan block-by-block routing from the map.
-
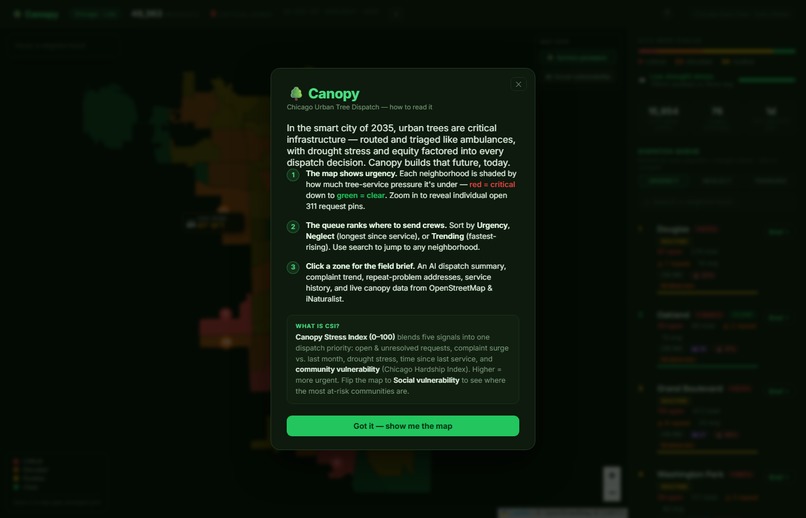
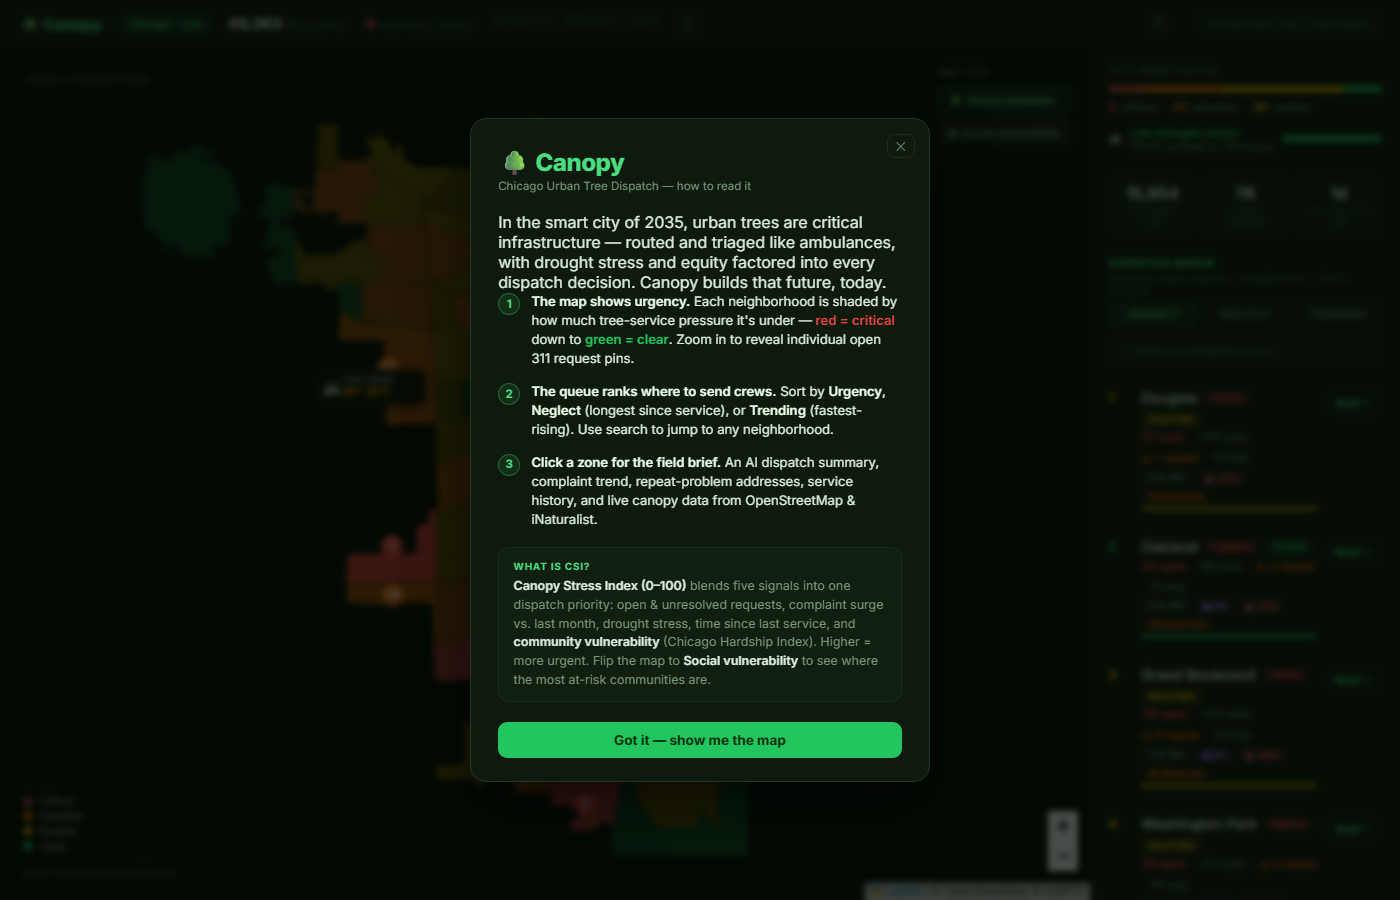
The onboarding card introduces the Canopy Stress Index and frames urban trees as critical infrastructure — not amenities.
-
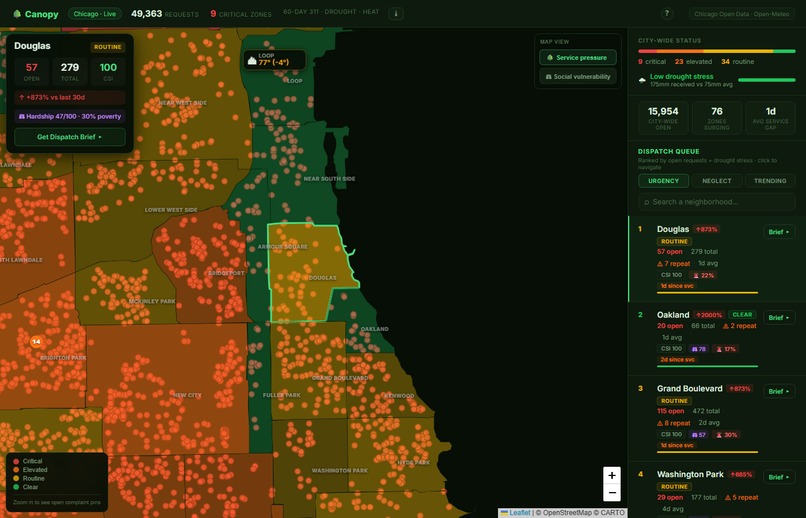
Dispatch queue sorted by CSI. Each row shows zone name, tier, score, open request count, and a one-click AI field brief button.
Inspiration
Cities around the world filed over 40,000 tree service requests last year. Most sat unresolved for months. Crews were dispatched by gut feel, first-come, first-served, which meant the neighborhoods that complained loudest got the most attention, and the ones that needed help most got the least.
The tornado outbreak that hit the Chicago area while we were building this made it visceral. I opened the live 311 feed and watched the map turn red in real time, and the hardest-hit zones were almost exactly the communities with the lowest resources to recover. I realized that it was, simply put, a massive system failure.
The smart city of 2035 routes arborist crews the way ambulances are routed today, by real-time need, drought stress, and equity. I wanted to build that, now, on data that already exists. This will allow cities to save billions of dollars annually on arborists and divert that money towards other needs of their populations.
What it does
Canopy is a live urban forestry dispatch tool for Chicago. It ingests 60 days of 311 tree-service requests, 50+ years of maintenance history, real-time drought data, and the Chicago Hardship Index, and blends them into a single Canopy Stress Index (CSI) for all 77 community areas.
$$\text{CSI} = 0.42 \cdot \text{service pressure} + 0.18 \cdot \text{vulnerability} + 0.15 \cdot \text{neglect} + 0.13 \cdot \text{trend} + 0.08 \cdot \text{unresolved rate} + 0.04 \cdot \text{drought}$$
The app gives crews:
- A live dispatch queue sortable by urgency, neglect, or fastest-rising complaint rate
- Two map views: service pressure and social vulnerability, so crews aren't just sent to the loudest neighborhoods but to the most underserved ones
- AI field briefings per neighborhood (Groq / Llama 3.3-70b), generated fresh with each dispatch click
- Live canopy intelligence mapped trees, estimated age from trunk circumference, and plant-species diversity via OpenStreetMap and iNaturalist
How we built it
Entirely on free and public data. No proprietary feeds.
│ Layer │ Source │
│ 311 requests │ Chicago Open Data │
│ Maintenance history │ Chicago Open Data (trim + debris datasets) │
│ Hardship Index │ Chicago Open Data (ACS) │
│ Drought/heat │ Open-Meteo │
│ Tree mapping │ OpenStreetMap Overpass API │
│ Species diversity │ iNaturalist │
│ AI briefings │ Groq (llama-3.3-70b-versatile) │
│ Basemap │ CARTO / OpenStreetMap │
The frontend is vanilla HTML, CSS, and JavaScript with Leaflet. The AI briefing runs as a Vercel serverless function. The whole thing deploys in under 30 seconds.
Challenges we ran into
The under-reporting problem. Raw complaint counts lie. Disadvantaged neighborhoods don't call 311 at the same rate; a tree can fall in Englewood and never get reported, while the same tree in Lincoln Park would generate a call within the hour. Using raw volume as the dispatch signal actively punishes the communities that need the most help. We solved this by normalizing complaint volume against the Chicago Hardship Index, so a hundred calls from a high-hardship area are weighted differently than a hundred calls from a wealthy one.
The CSI sort bug. I built the CSI formula to include the 18% equity weight, but discovered mid-build that the dispatch queue was sorting by raw service pressure score rather than CSI. The equity signal was computed and displayed, but never used to rank anything. Caught it, fixed it. One line of code changed the entire queue order for neighborhoods like Austin and West Garfield Park.
Data freshness vs. completeness. The 311 live feed is real-time but limited in depth. The historical maintenance datasets go back 50+ years, but are slow to load. We load them asynchronously in the background and recompute CSI scores in place as they arrive, so the app is immediately ready while data loads.
Accomplishments that we're proud of
- An equity-weighted dispatch algorithm that actually moves the needle
- AI briefings that read like they were written by an experienced urban forestry supervisor, rather than a standard chatbot
- Zero paid data sources. The infrastructure for the smart city already exists in public APIs
- The app handles a live disaster scenario (the tornado aftermath) without any modification, because it was built on real data from the start.
What we learned
The hardest part of equity work is noticing where the system is lying to you. Raw complaint data feels objective. It isn't. Every signal in a civic dataset carries the history of who had access to the system that generated it. If you don't correct for that, you're just automating the existing inequity at scale.
We also learned that "free and open" data is genuinely powerful. Every data source in Canopy is publicly available. The limiting factor was knowing what to ask for and how to blend it.
What's next for Canopy
Chicago is the proof of concept. New York, LA, Seattle, Boston, and Washington, D.C. all publish 311 data. Open-Meteo is global. OpenStreetMap and iNaturalist cover the planet. Canopy is a city-agnostic dispatch engine.
As the Earth warms, trees aren't an amenity anymore. They're the difference between a neighborhood that survives summer and one that doesn't. The cities that figure out how to protect them, equitably, intelligently, in real time, are the ones worth living in.
Built With
- carto
- chicago-open-data-(socrata)
- css
- groq-api-(llama-3.3-70b-versatile)
- html
- inaturalist-api
- javascript
- leaflet.js
- node.js
- open-meteo
- openstreetmap-overpass-api
- vercel
- vercel-serverless-functions


Log in or sign up for Devpost to join the conversation.