-
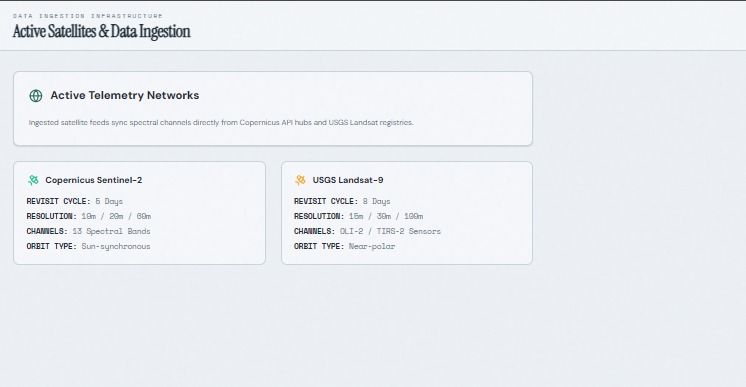
Data Sources
-
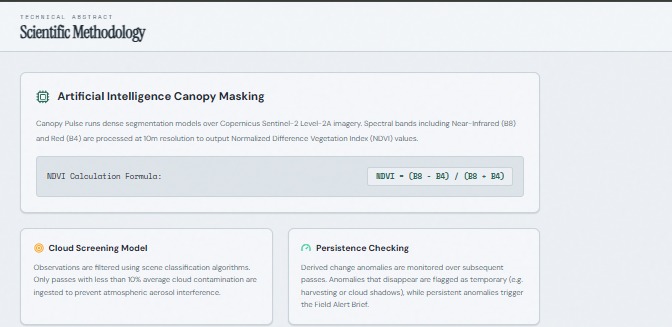
Methodology
-
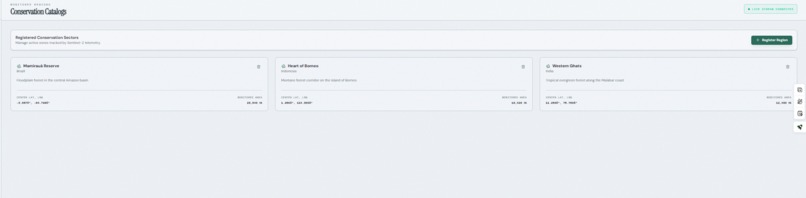
Regions
-
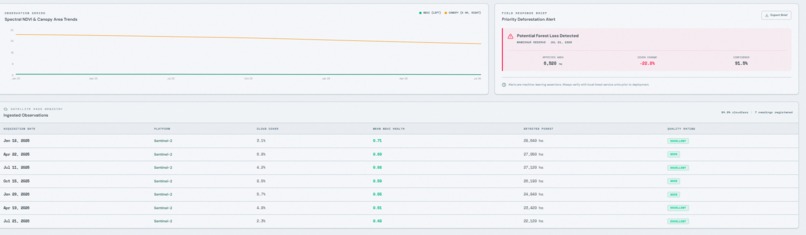
Persistent data
-
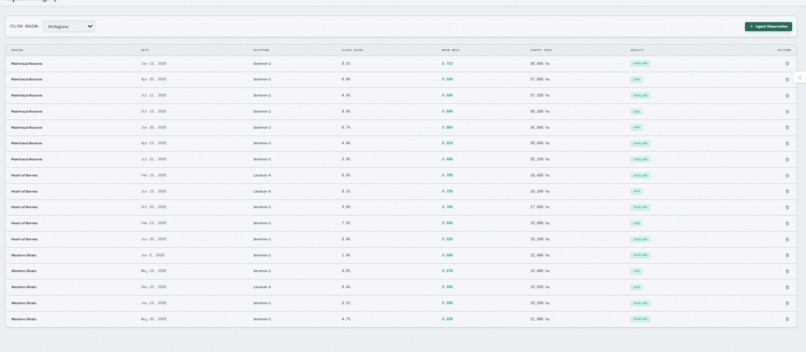
Data History
-
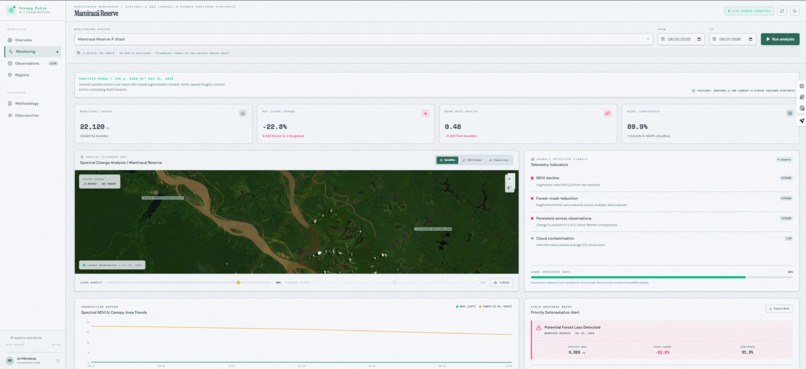
Dashboard
-
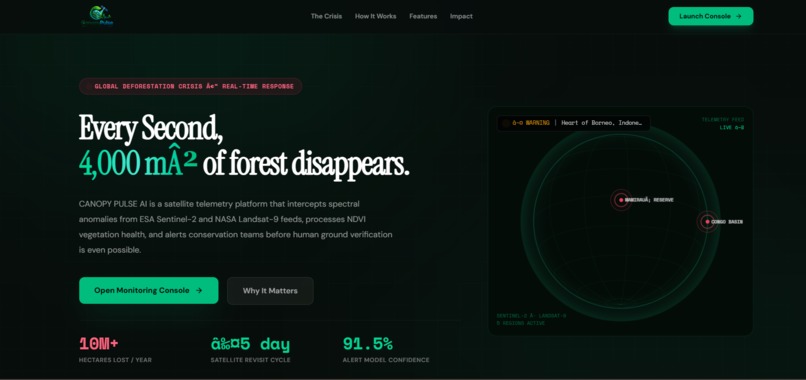
Landing Page
About the Project
🌿 Inspiration
Forests are constantly changing, but most of us only see those changes when they become obvious on the ground. Meanwhile, satellites such as Sentinel-2 and Landsat continuously collect information about Earth's surface.
That led to a simple question:
Can we turn satellite observations into an early-warning system that helps conservation teams understand where something may be changing and where they should investigate first?
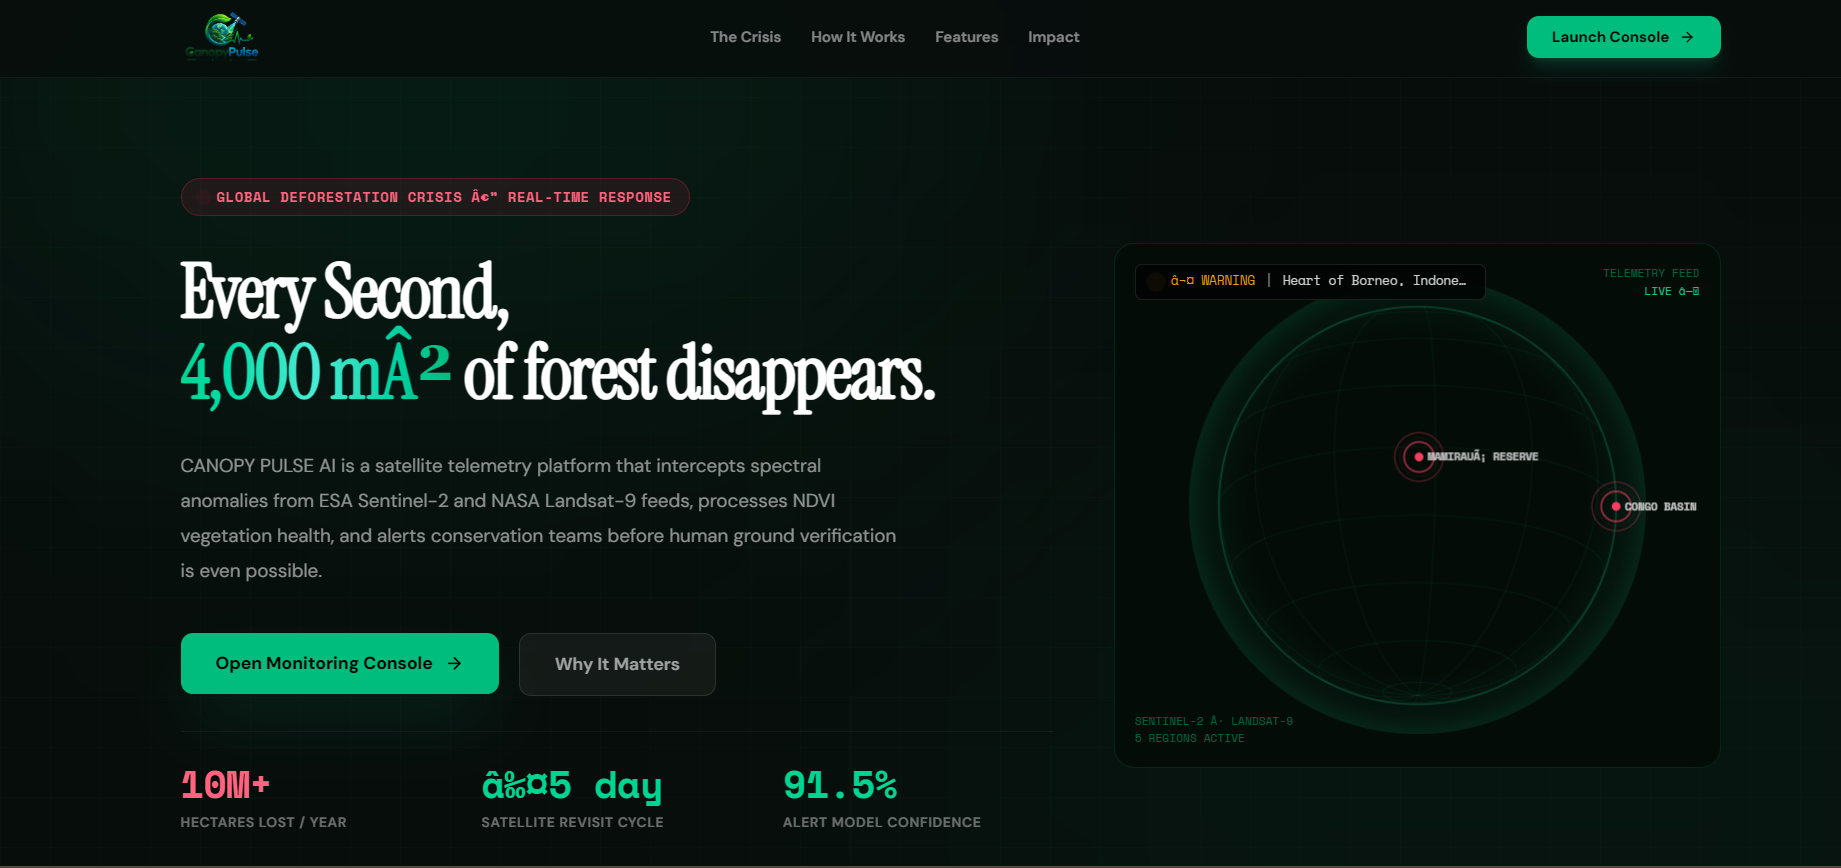
That idea became CanopyPulse — a satellite-powered forest monitoring and decision-support platform.
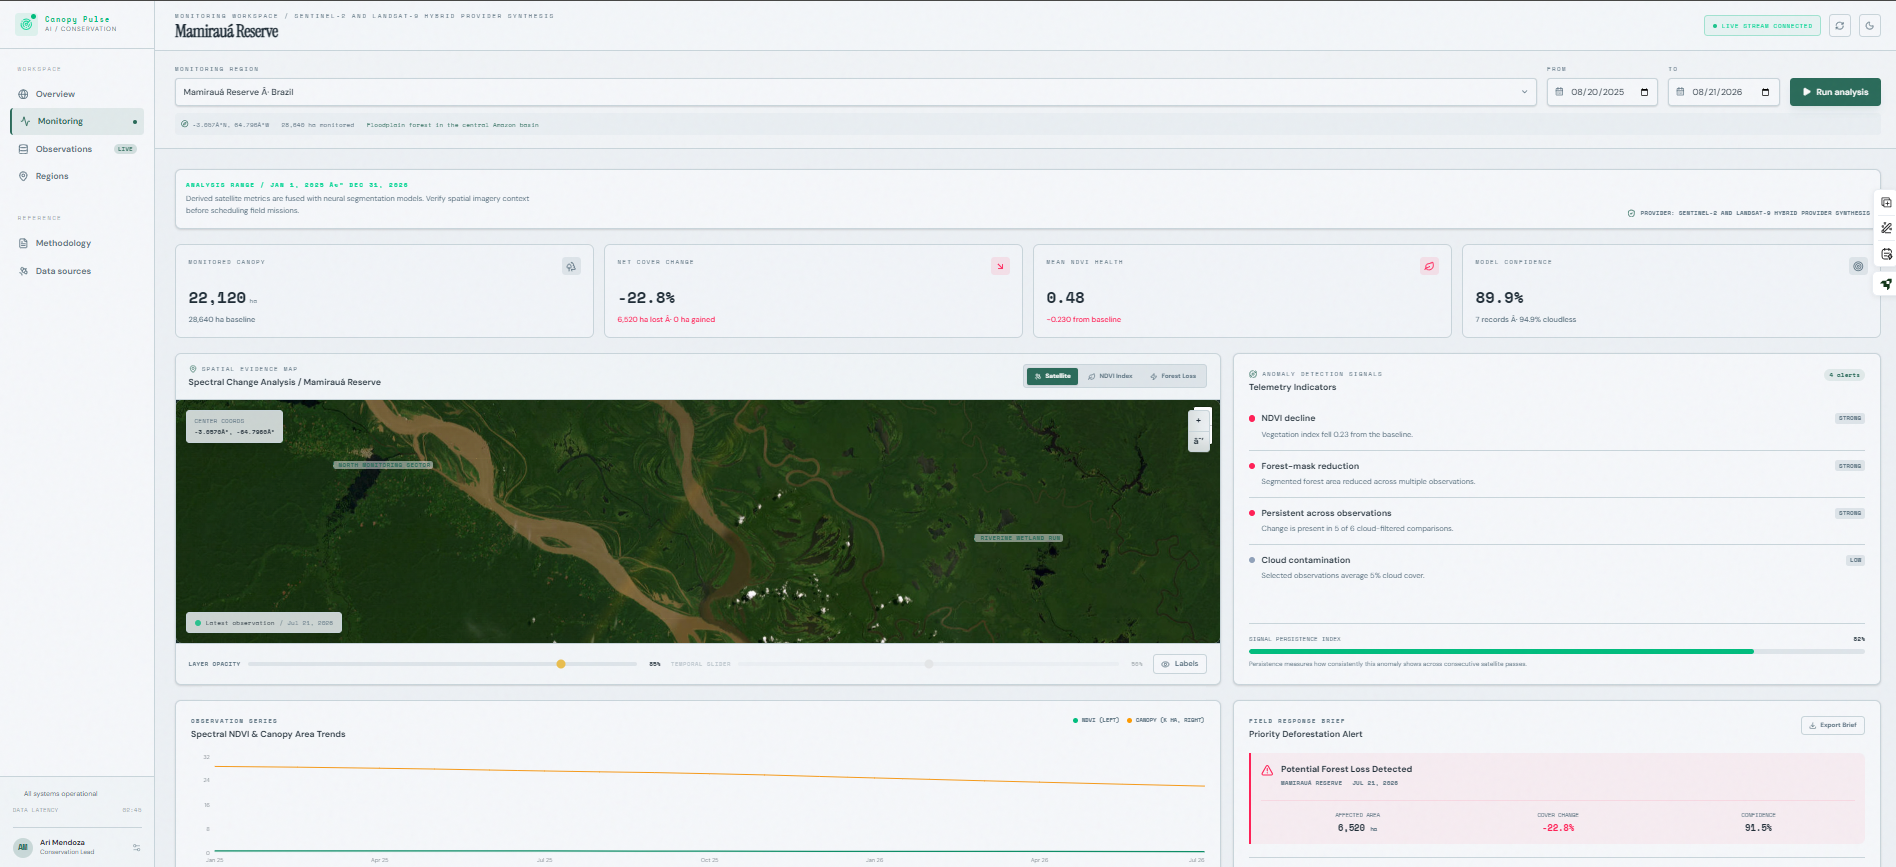
Instead of presenting users with raw satellite imagery alone, CanopyPulse brings together multispectral data, vegetation indices, canopy analysis, temporal comparisons, cloud filtering, and persistence detection into one interface.
🛰️ What I Built
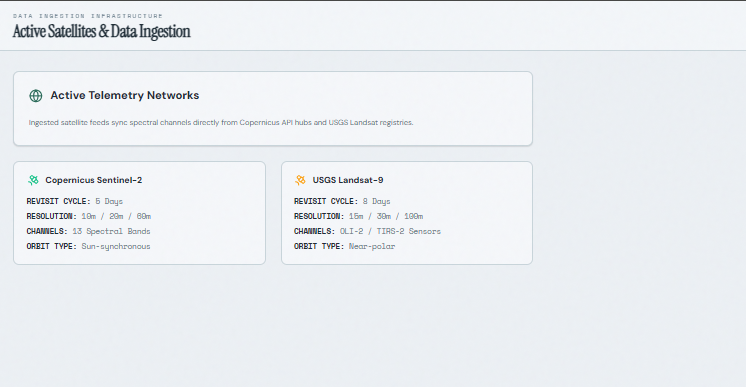
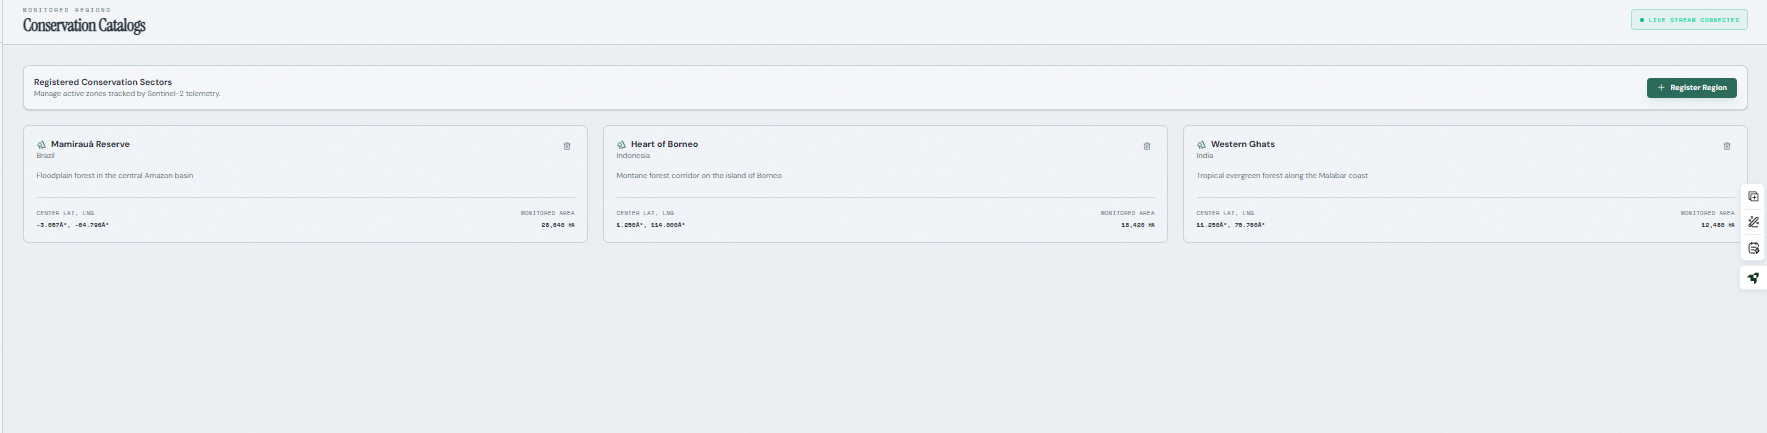
CanopyPulse monitors selected conservation regions using satellite observations from Copernicus Sentinel-2 and USGS Landsat.
The workflow is:
Satellite observations → Quality filtering → Spectral analysis → Canopy analysis → Temporal comparison → Persistent-change detection → Investigation alert
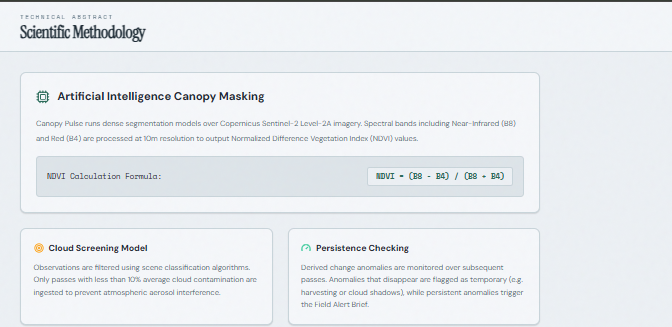
One of the core measurements is the Normalized Difference Vegetation Index (NDVI):
$$ NDVI = \frac{NIR - Red}{NIR + Red} $$
For Sentinel-2, CanopyPulse uses the Red (B4) and Near-Infrared (B8) bands to derive this vegetation signal.
The platform then combines observations over time rather than relying on a single satellite image. This helps distinguish potentially meaningful, persistent change from effects that could be caused by cloud cover, shadows, atmospheric effects, or temporary observation anomalies.
🗺️ Making Satellite Data Understandable
A major part of the project was making remote-sensing information understandable without requiring the user to be a satellite-data expert.
The monitoring dashboard provides multiple spatial views:
- Satellite view — visual context of the monitored region.
- NDVI view — shows the spatial vegetation signal.
- Forest/canopy-change view — highlights areas where the analysis detects potential change.
These are combined with:
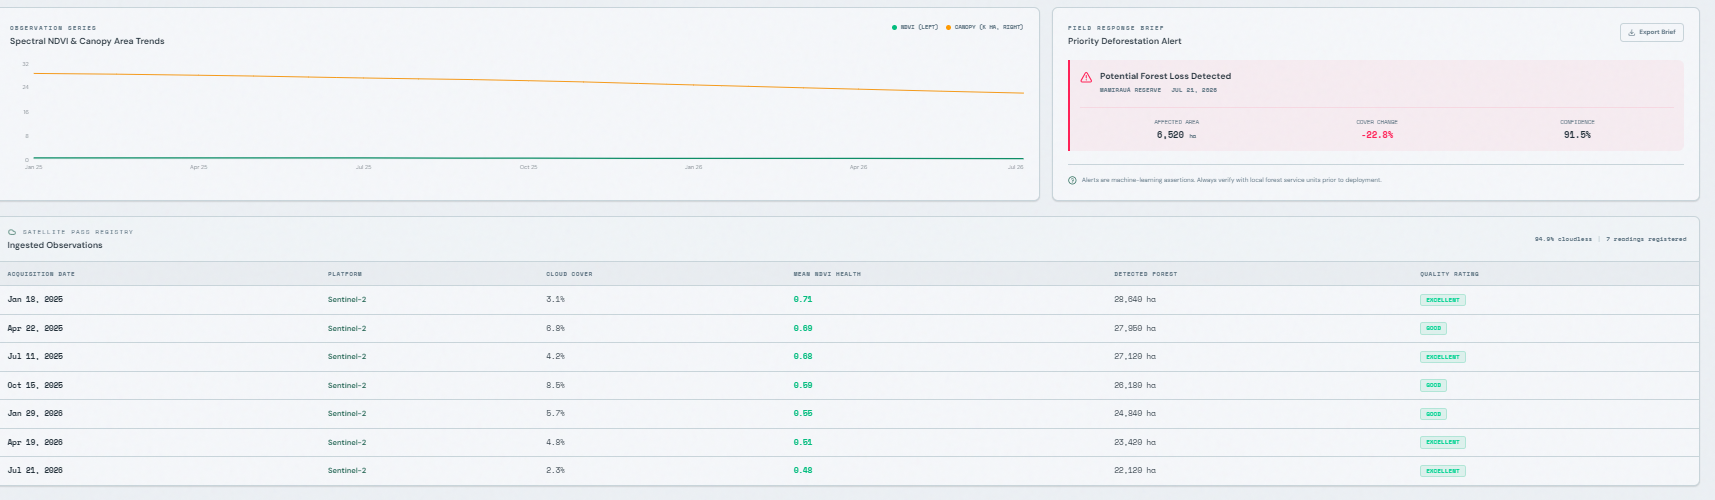
- Mean NDVI
- Monitored canopy area
- Net canopy/cover change
- Model/evidence confidence
- Cloud contamination
- Temporal trends
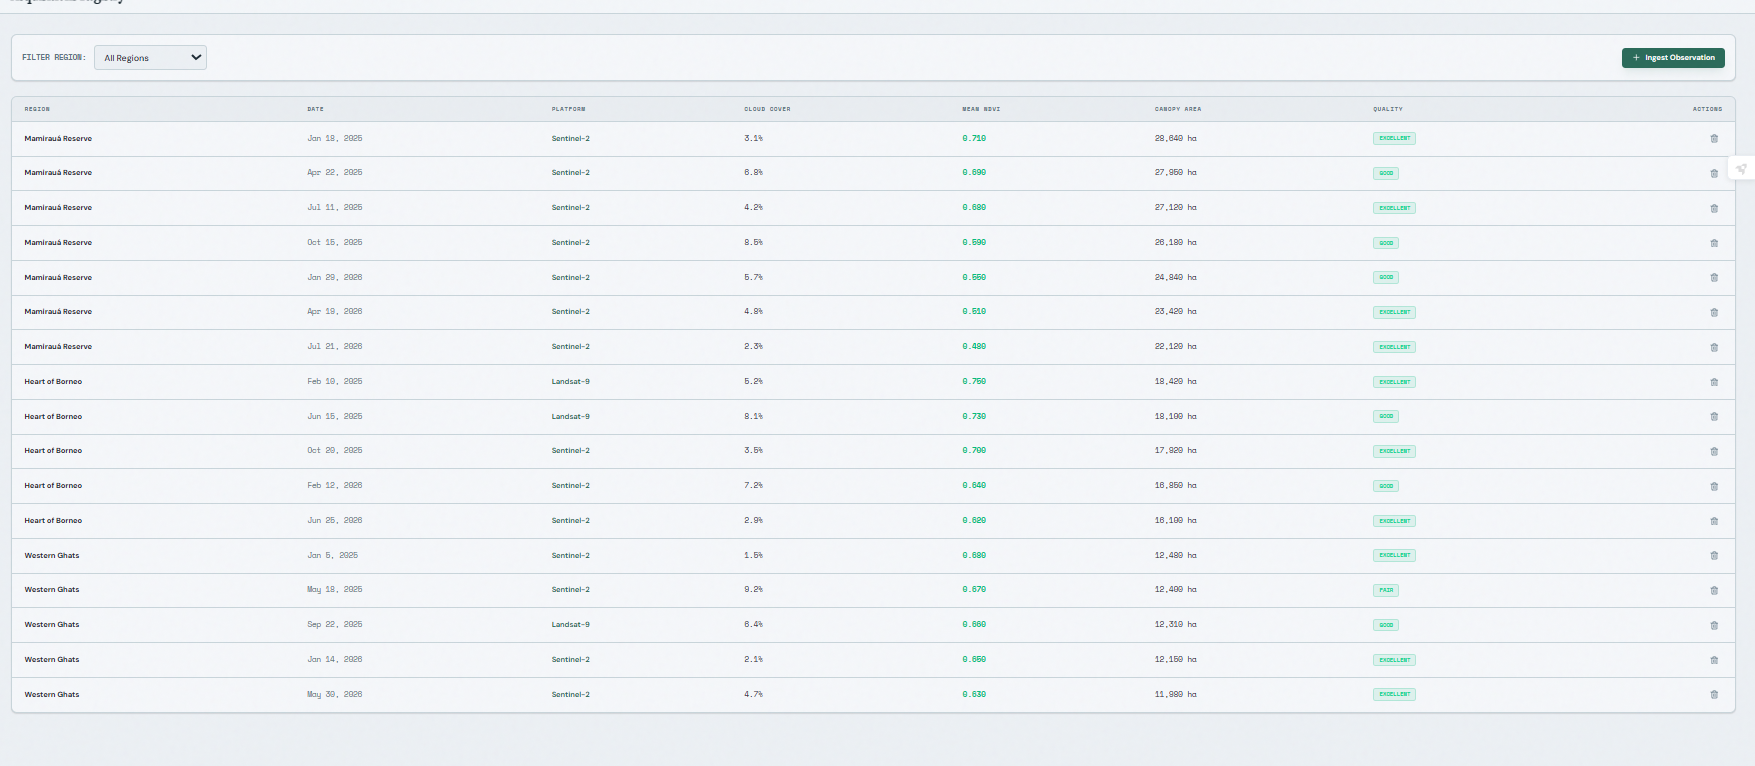
- Observation history
- Persistence indicators
- Priority alerts
The goal is to answer three simple questions:
What changed? Where did it change? And is the change persistent enough to investigate?
🧠 What I Learned
Building CanopyPulse required me to go beyond simply building a web interface.
I had to learn the fundamentals of remote sensing and Earth observation, including:
- How multispectral satellite imagery works
- Spectral bands and what they represent
- Red vs. Near-Infrared reflectance
- NDVI and vegetation health
- Spatial and temporal resolution
- Satellite revisit cycles
- Cloud contamination and observation quality
- Canopy/forest masking
- Change detection
- Temporal persistence
- Why a single satellite observation can be misleading
I also learned how satellite APIs and data catalogues fit into an actual software product, rather than treating satellite imagery as just another static dataset.
Most importantly, I learned that detecting change is not the same as proving what caused the change. CanopyPulse therefore treats its results as signals for investigation, rather than automatically declaring that deforestation has occurred.
⚙️ How I Built It
The project combines a web-based monitoring interface with an Earth-observation analysis pipeline.
At a high level:
Conservation Region
        ↓
Satellite Data
(Sentinel-2 / Landsat)
        ↓
Observation Filtering
(clouds + quality)
        ↓
Spectral Processing
        ↓
NDVI + Canopy Analysis
        ↓
Multi-temporal Comparison
        ↓
Persistence Detection
        ↓
Dashboard + Map Layers
        ↓
Priority Investigation Alert
Built With
- api
- backend
- fastapi
- html
- javascript
- nasa
- netlify
- python
- react
- sentinel


Log in or sign up for Devpost to join the conversation.