Inspiration
Year by year, rising temperatures make walking outdoors less comfortable. Canopy’s focus on shaded walking routes is informed by research showing that trees and shade significantly influence people’s preferences for walking (Tabatabaie, Litt, & Muller, 2023; Levenson, Pearlmutter, & Aleksandrowicz, 2023).
Key findings from these studies:
- Shade and trees strongly increase people’s intuitive preference for walking on residential streets.
- Pedestrians under hot conditions overwhelmingly choose shaded paths, with over 70% opting for shade when available.
Canopy helps people choose routes that align with these preferences, making walking more comfortable, enjoyable, and appealing even during hot days.
What it does
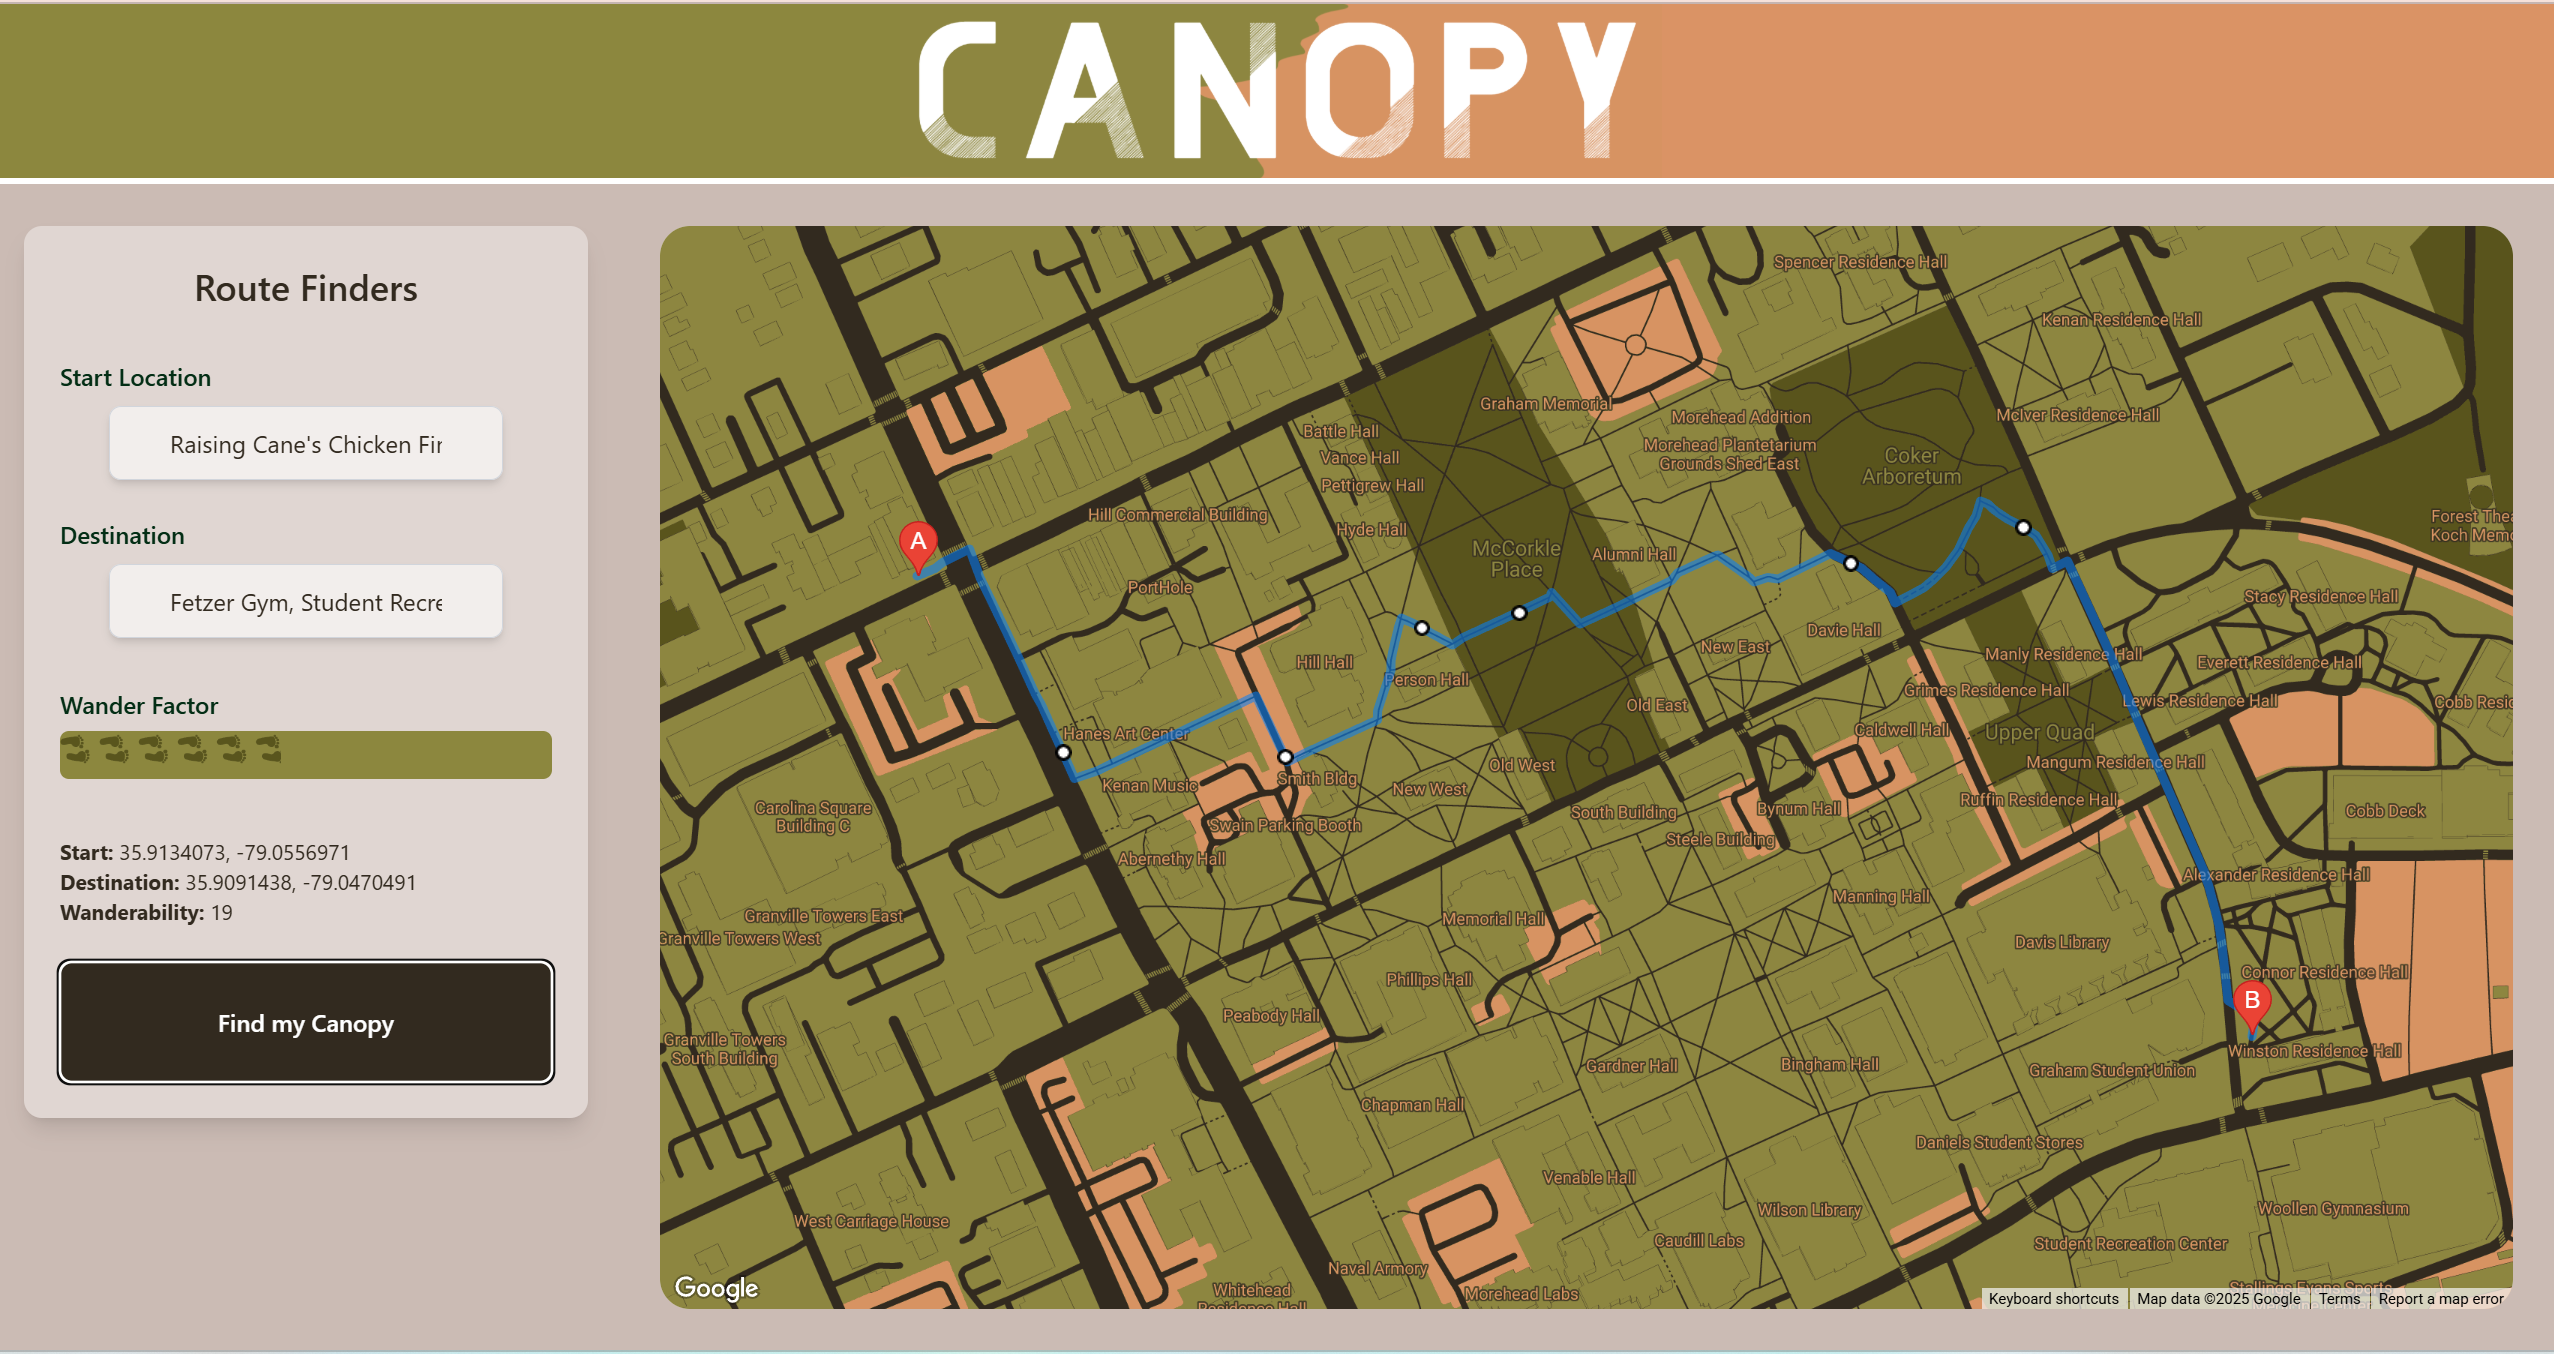
Canopy finds the coolest (literally) walking path in the contiguous United States by combining tree canopy coverage from the Multi-Resolution Land Characteristics Consortium with real-time temperature and wind data from NOAA’s National Weather Service. Our app calculates the optimal path and loads it onto Google Maps, displaying a custom route that is guaranteed to maximize shade, minimize heat exposure, and make every walk more comfortable and enjoyable.
How we built it
We split our group into frontend and backend using separate branches on GitHub. Collaboration was key to our success as we brainstormed different ideas in both teams. We tried multiple different approaches until we found a path that we were satisfied with.
Challenges we ran into
We ran into two categories of challenges: technical and team.
- Team challenges: Assigning roles that matched each member’s strengths took time and communication, but ultimately made collaboration smoother.
- Technical challenges: Integrating multiple APIs and accounting for various environmental factors (like temperature gradients, wind direction, and canopy density) required careful optimization and data structuring. Balancing these variables in real time was complex but crucial for accurate pathfinding.
Accomplishments that we're proud of
Figuring out Git and GitHub and actually creating a plan before jumping into coding prevented the major setbacks we've had in previous hackathons. Most of all, we are proud of creating the general form of the optimization algorithm and the backend data structure that were done utilizing linear maps. The basics of the equations are as follows: $$D_e = T_{\text{ambient}, xy} \otimes {W_{\text{ambient}, xy}} \otimes C_{\text{ambient}, s}$$ where $$T_{xy}, W_{xy}, C_{s}$$ represent tensors calculated through API calls and discriminated and vectorized through NumPy for efficient calculations.
What we learned
Searching algorithms are really complicated... but also incredibly rewarding to work on. Good communication and planning can save countless hours of debugging and refactoring.
What's next for Canopy
In the future we hope to maximize heat instead of coolness so you can use Canopy during the winter and the additional feature of avoiding grass for CS majors.
Citations
Tabatabaie, S., Litt, J. S., & Muller, B. H. F. (2023). Sidewalks, trees and shade matter: A visual landscape assessment approach to understanding people’s preferences for walking. Urban Forestry & Urban Greening. https://doi.org/10.1016/j.ufug.2023.127931
Levenson, M., Pearlmutter, D., & Aleksandrowicz, O. (2025). An observational analysis of shade-related pedestrian activity. Buildings and Cities, 6(1), 398–414. https://doi.org/10.5334/bc.574
Built With
- dotenv
- flask
- flask-cors
- gdal
- google-cloud
- google-maps
- javascript
- matplotlib
- mrlc-tree-canopy-cover
- noaa-national-weather-service-(nws)
- numpy
- pathlib
- polyline
- python
- rasterio
- react
- requests
- tailwind
- vite


Log in or sign up for Devpost to join the conversation.