-
-
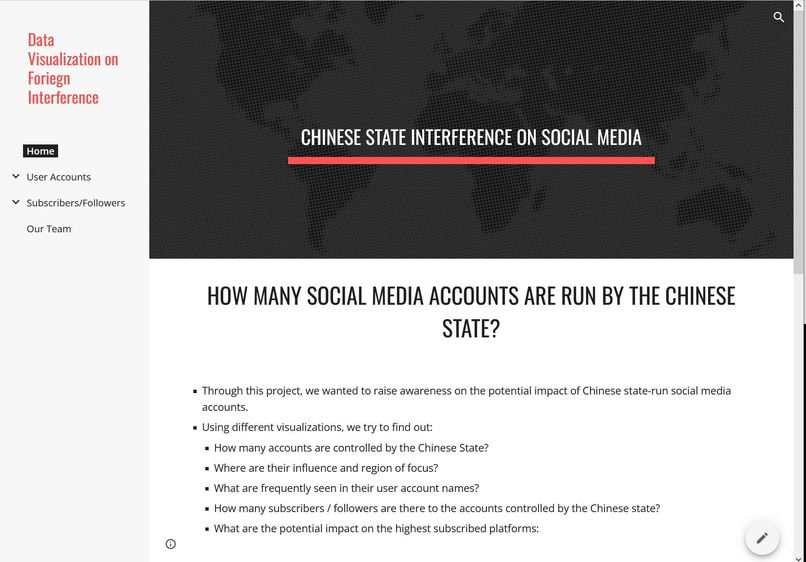
Website presenting our visualizations
-
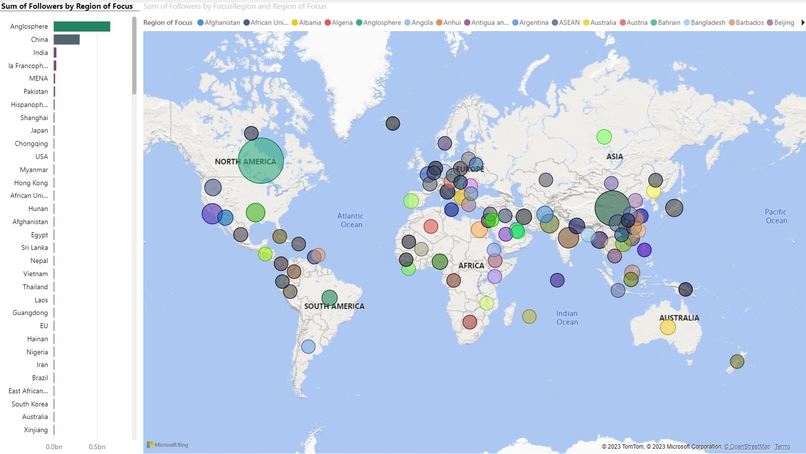
Region of Influence of Chinese state-owned social medial accounts
-
PowerBI Dashboard and Network Graph
-

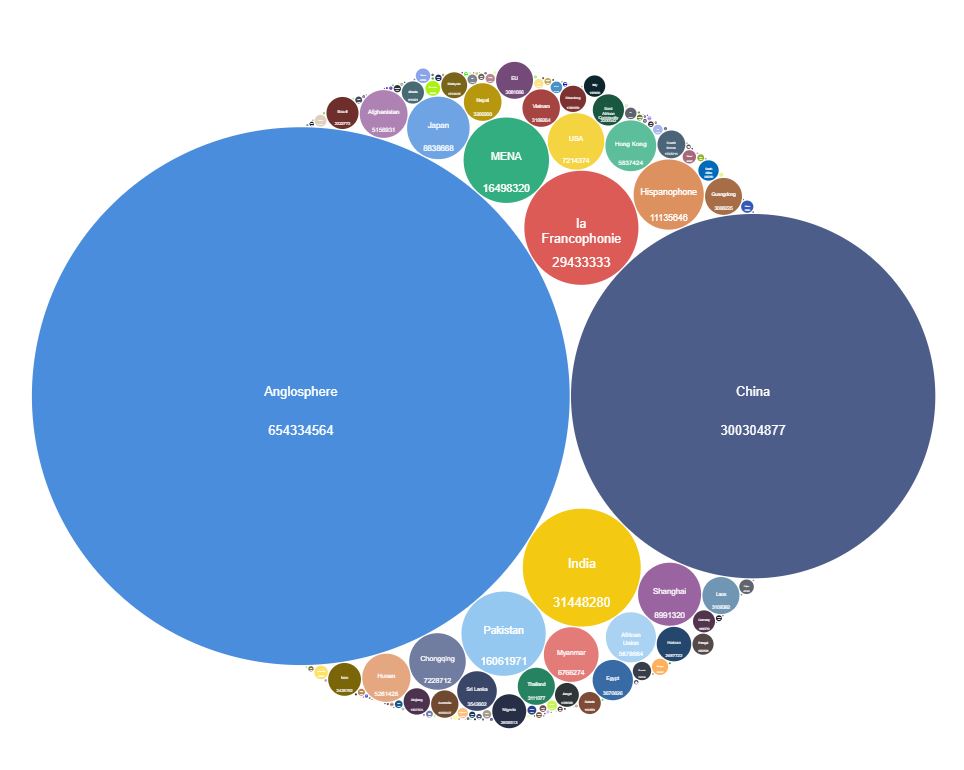
PowerBI Visuals Bubble Graph
-

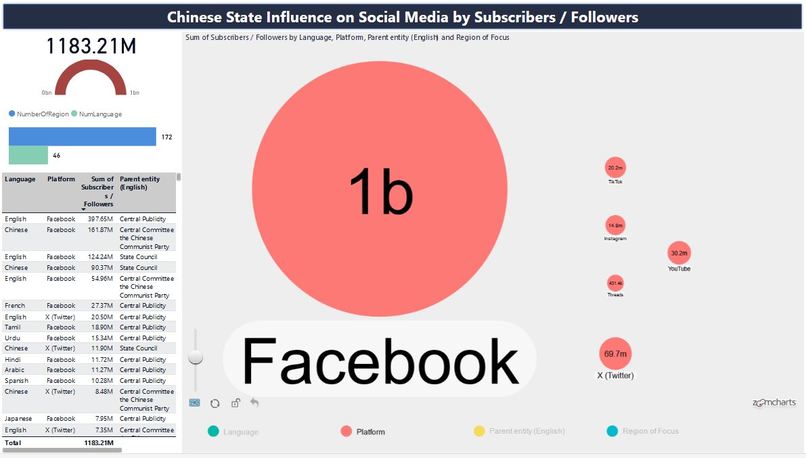
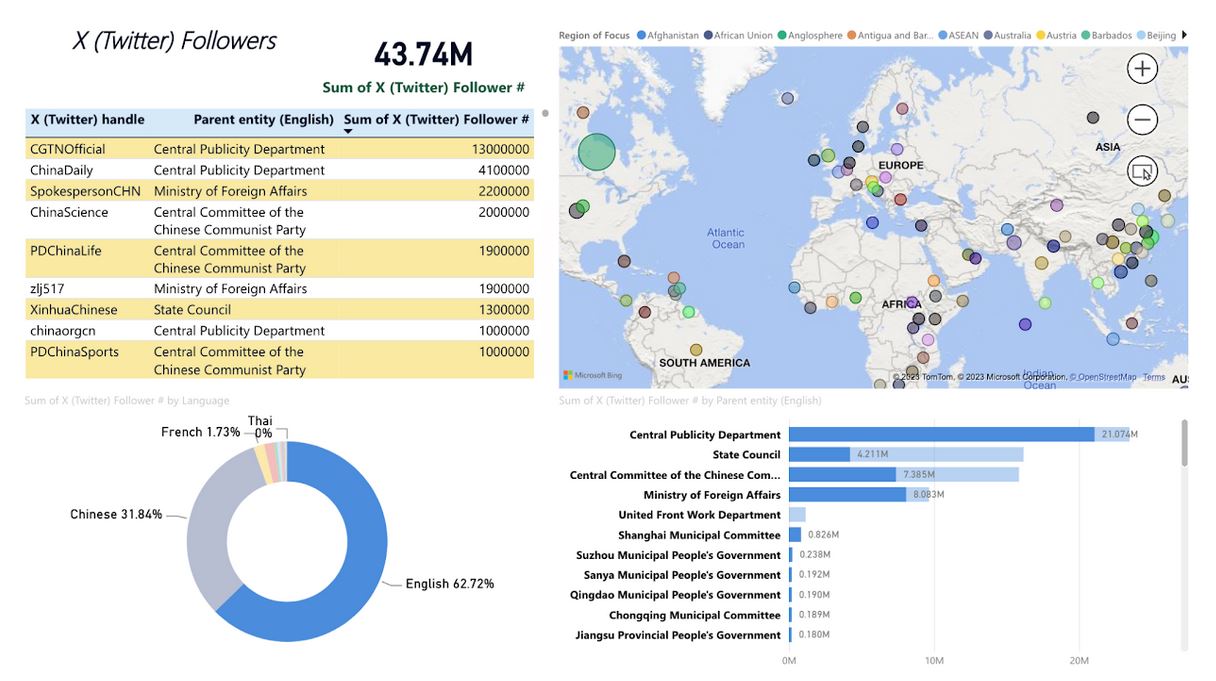
PowerBI Dashboard on Twitter Followers


Inspiration
We are a team of 3 Master of Data Science students from the University of Calgary. It was a challenge beside from course work to participate in the hackathon. However, we were eager to put forth what we have learned so far since September onto studying a real-world dataset.
What it does
In the span of 72 hours, the three of us learned from ground how to use Microsoft Power PI. We used the free edition to build all visualization to the dataset. Through this project, we wanted to raise awareness on the potential impact of Chinese state-run social media accounts.
We studied and visualized the dataset from two angles:
- Number of Chinese state-run social media accounts
- Number of subscribers / followers to these accounts
The final deliverable was (1) a website we built to show our findings, (2) a video explaining our visualization and (3) various interactive Power BI visualizations for the readers to gain insights and make further interpretations on their own.
How we built it
- Python Jupyter Notebook files included here used for initial data exploration, cleaning, and wrangling
- All visualization done using Power BI.
Challenges we ran into
At first, we were not sure how to approach this dataset. We had many ideas including scraping to try get more secondary data on number of likes, number of retwits and level of engagement in terms of comments made etc.. However, data was very limited as these social media platforms were very protective in their data. We did find some third party websites that do provide weekly and monthly trends on subscribers and view counts but at the end, we decided not to go that route as we were not sure about the trustworthiness of those data.
At last, we decided to just go with what is given. We asked ourselves what we wanted to learn most from this hackathon experience. The all three of us arrived on a single consensus: Power BI! We wanted to add another toolbox to enhance our rather young data science journey.
Accomplishments that we're proud of
- Learning Power BI from scratch and made the dashboard to show the presentation
What we learned
We learned using Power BI from ground. Once we got going, we were surprised how easy it is to produce powerful visualizations. (We finally understood why companies paid for it.) However, we did face a couple challenges using Power BI. First, it was due to our lack of experience in Power BI, we still had to do some data cleaning and wrangling in Python before we import those data into Power BI. Second, Power BI was not available on Mac. A couple of us using Mac spent some time figuring out the workaround. Finally, we each were able to build 3 to 4 pages of BI visualization that we think are helpful in explaining our dataset.
What's next for Canis Hackathon Group - Bo, Brian, Alton
This experience was valuable to our journey to become a Data Scientist. We hope that we can refine more of our Power BI and other visualization skills and provide more helpful insights on this topic of Foreign Interference.


Log in or sign up for Devpost to join the conversation.