-
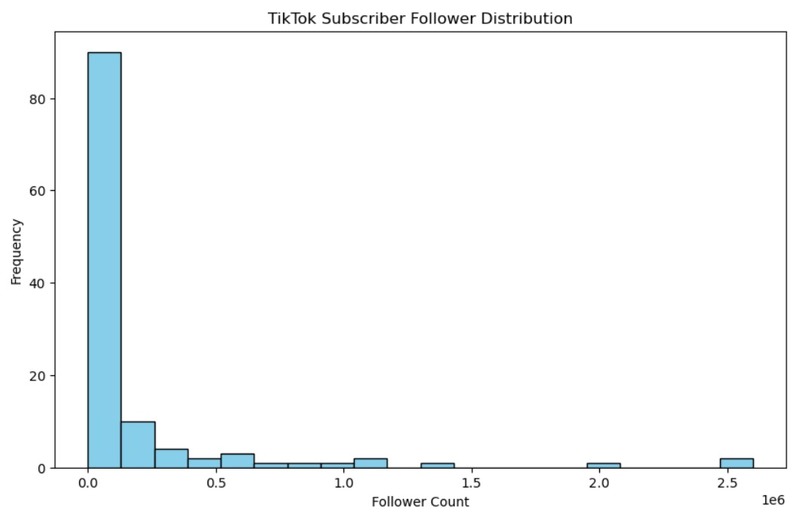
Follower Distribution example
-
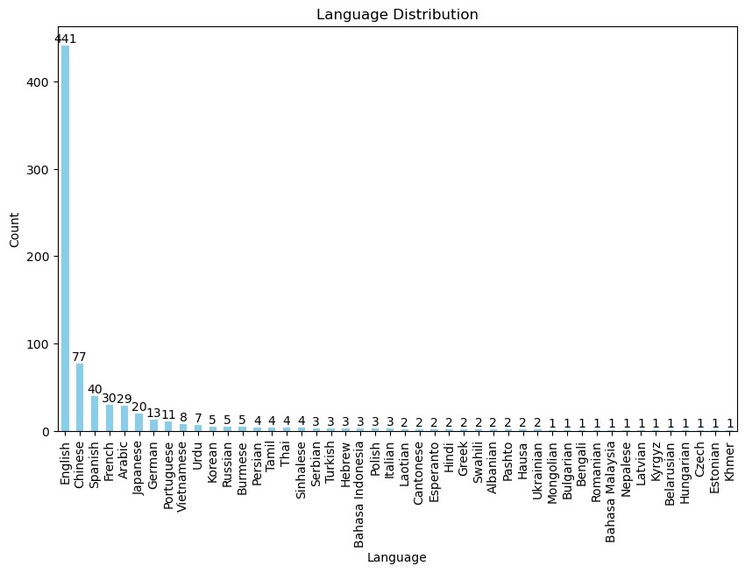
Language Distribution Example
-
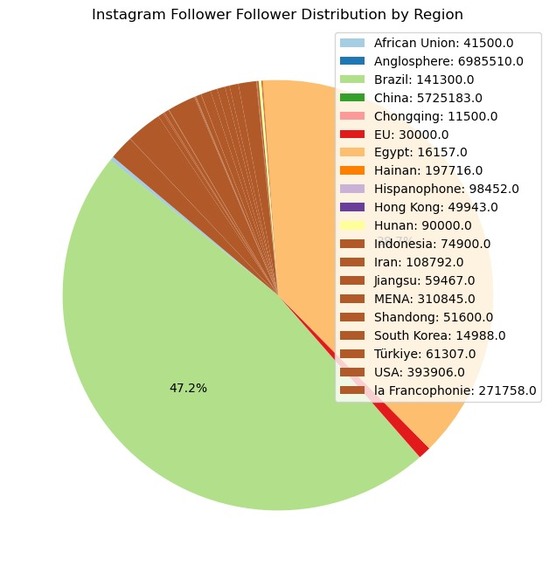
Pie chart
-
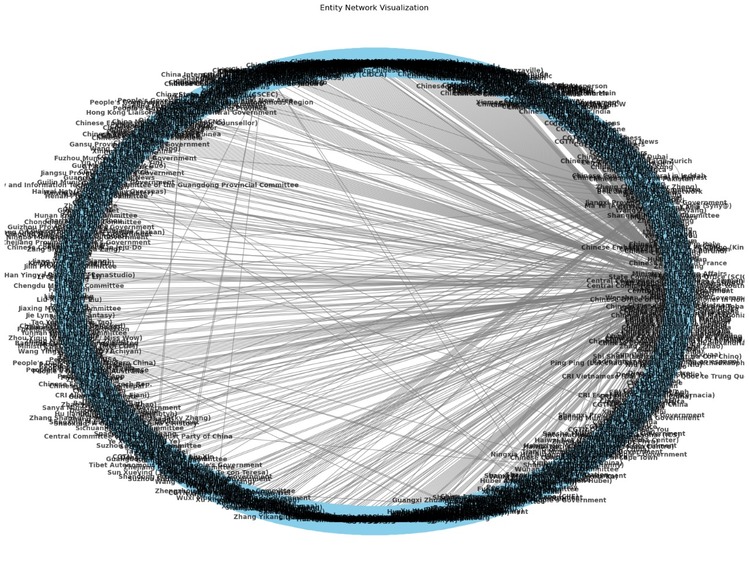
Complex Network


Inspiration
Our inspiration stems from the desire to unravel the intricate patterns within data and present them in a visually compelling manner. The goal is to make complex information accessible and meaningful.
What it does
CANIS DATA VISUALIZATION AND FOREIGN INTERFACE transforms raw data into vivid visual narratives. It leverages advanced visualization tools to navigate foreign interfaces, providing a clearer understanding of complex datasets.
How we built it
We built this project by incorporating cutting-edge data visualization tools like Gephi and leveraging our expertise in handling diverse datasets. The process involved meticulous data cleaning, exploratory analysis, and the strategic application of visualization techniques.
Challenges we ran into
One significant challenge was dealing with the intricacies of large datasets, leading to cluttered visualizations. To overcome this, we explored advanced tools and techniques tailored for complex network structures.
Accomplishments that we're proud of
We're proud to have successfully translated intricate data into compelling visual stories. Our accomplishment lies in creating clear and engaging presentations that communicate complex information with precision.
What we learned
Throughout the project, we deepened our understanding of advanced visualization tools, honed our skills in data preprocessing, and discovered effective strategies for handling complex network structures.
What's next for CANIS DATA VISUALIZATION AND FOREIGN INTERFACE
The journey doesn't end here. We aim to further refine our visualization techniques, explore additional tools, and expand our capabilities. The next phase involves continuous learning, refining our approach, and applying these insights to diverse datasets.

Log in or sign up for Devpost to join the conversation.