-
-
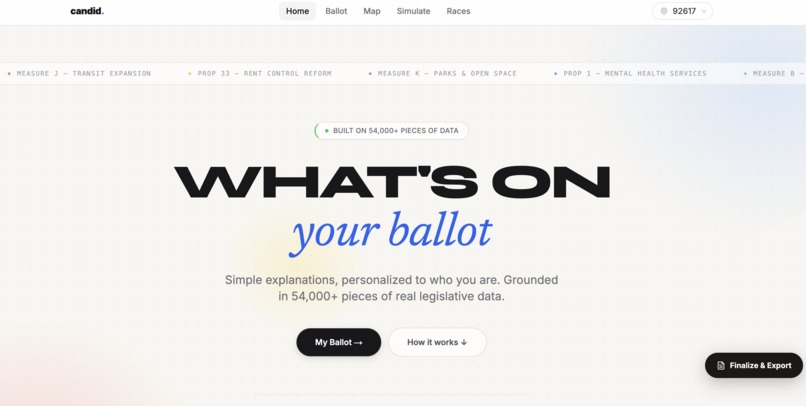
What's on your ballet?
-
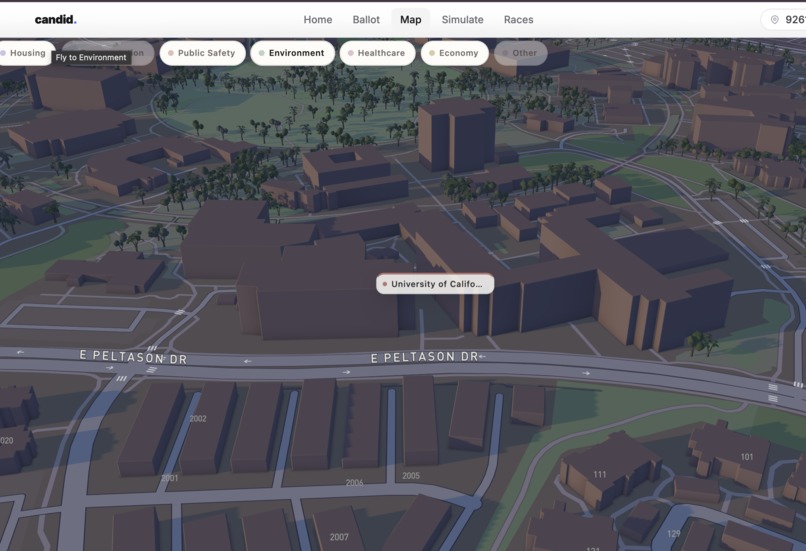
3D Map
-
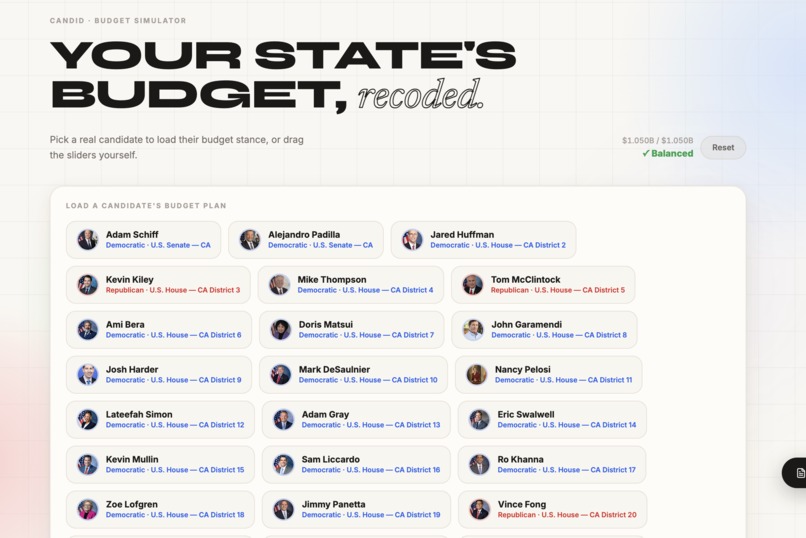
Real Data
-
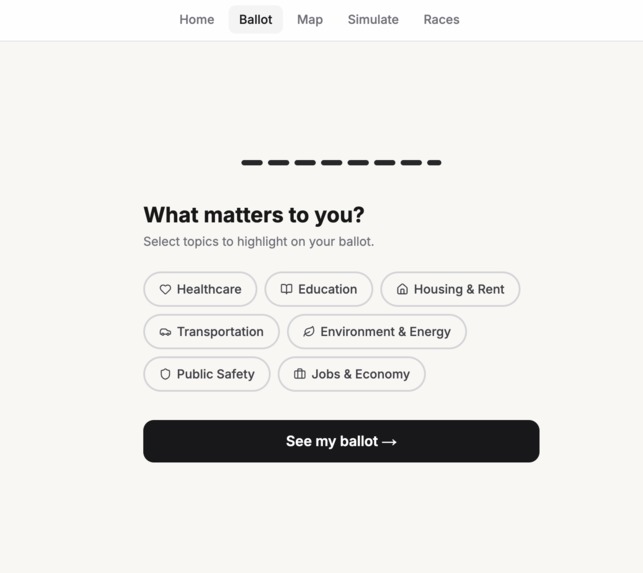
Real Personalization
Inspiration
Democracy has a comprehension problem. The average ballot measure runs 40+ pages of dense legal text. Most voters either skip it entirely or vote based on a 10-word summary written by someone with an agenda. We built Candid because we believe an informed vote shouldn't require a law degree, it should require 30 seconds and a ZIP code. We wanted to build something that actually works. Not a demo with fake data and hardcoded numbers. Real legislation. Real budget models. Real consequences, translated into dollars and cents for real people.
What it does
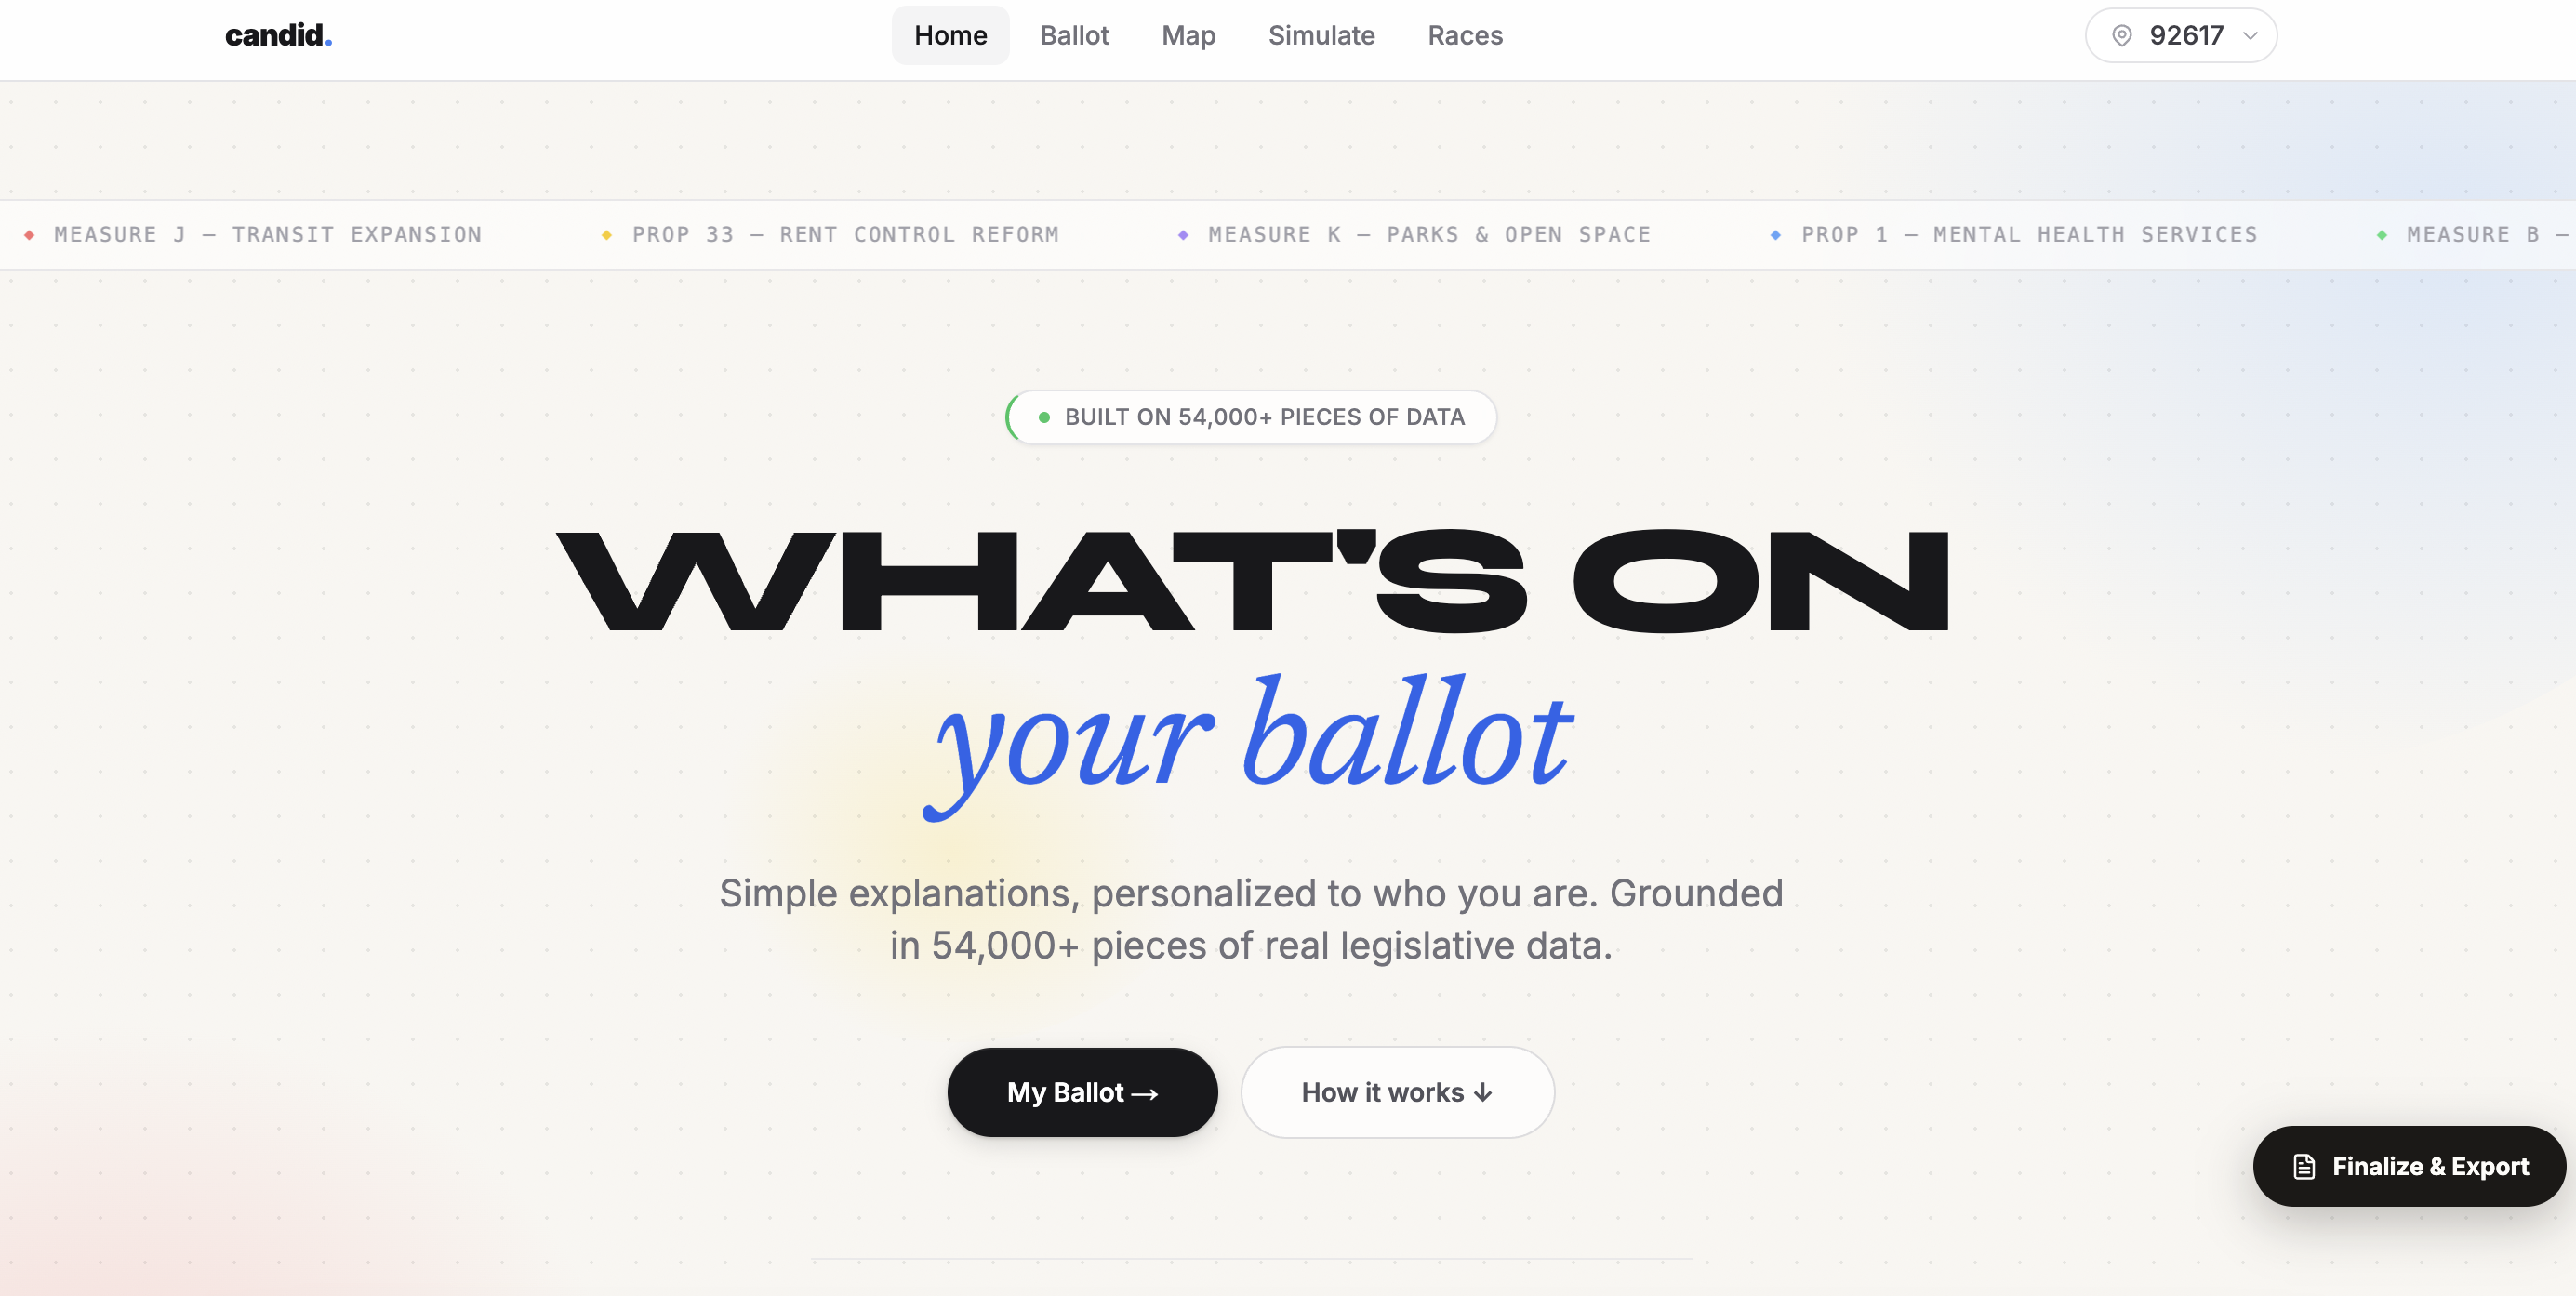
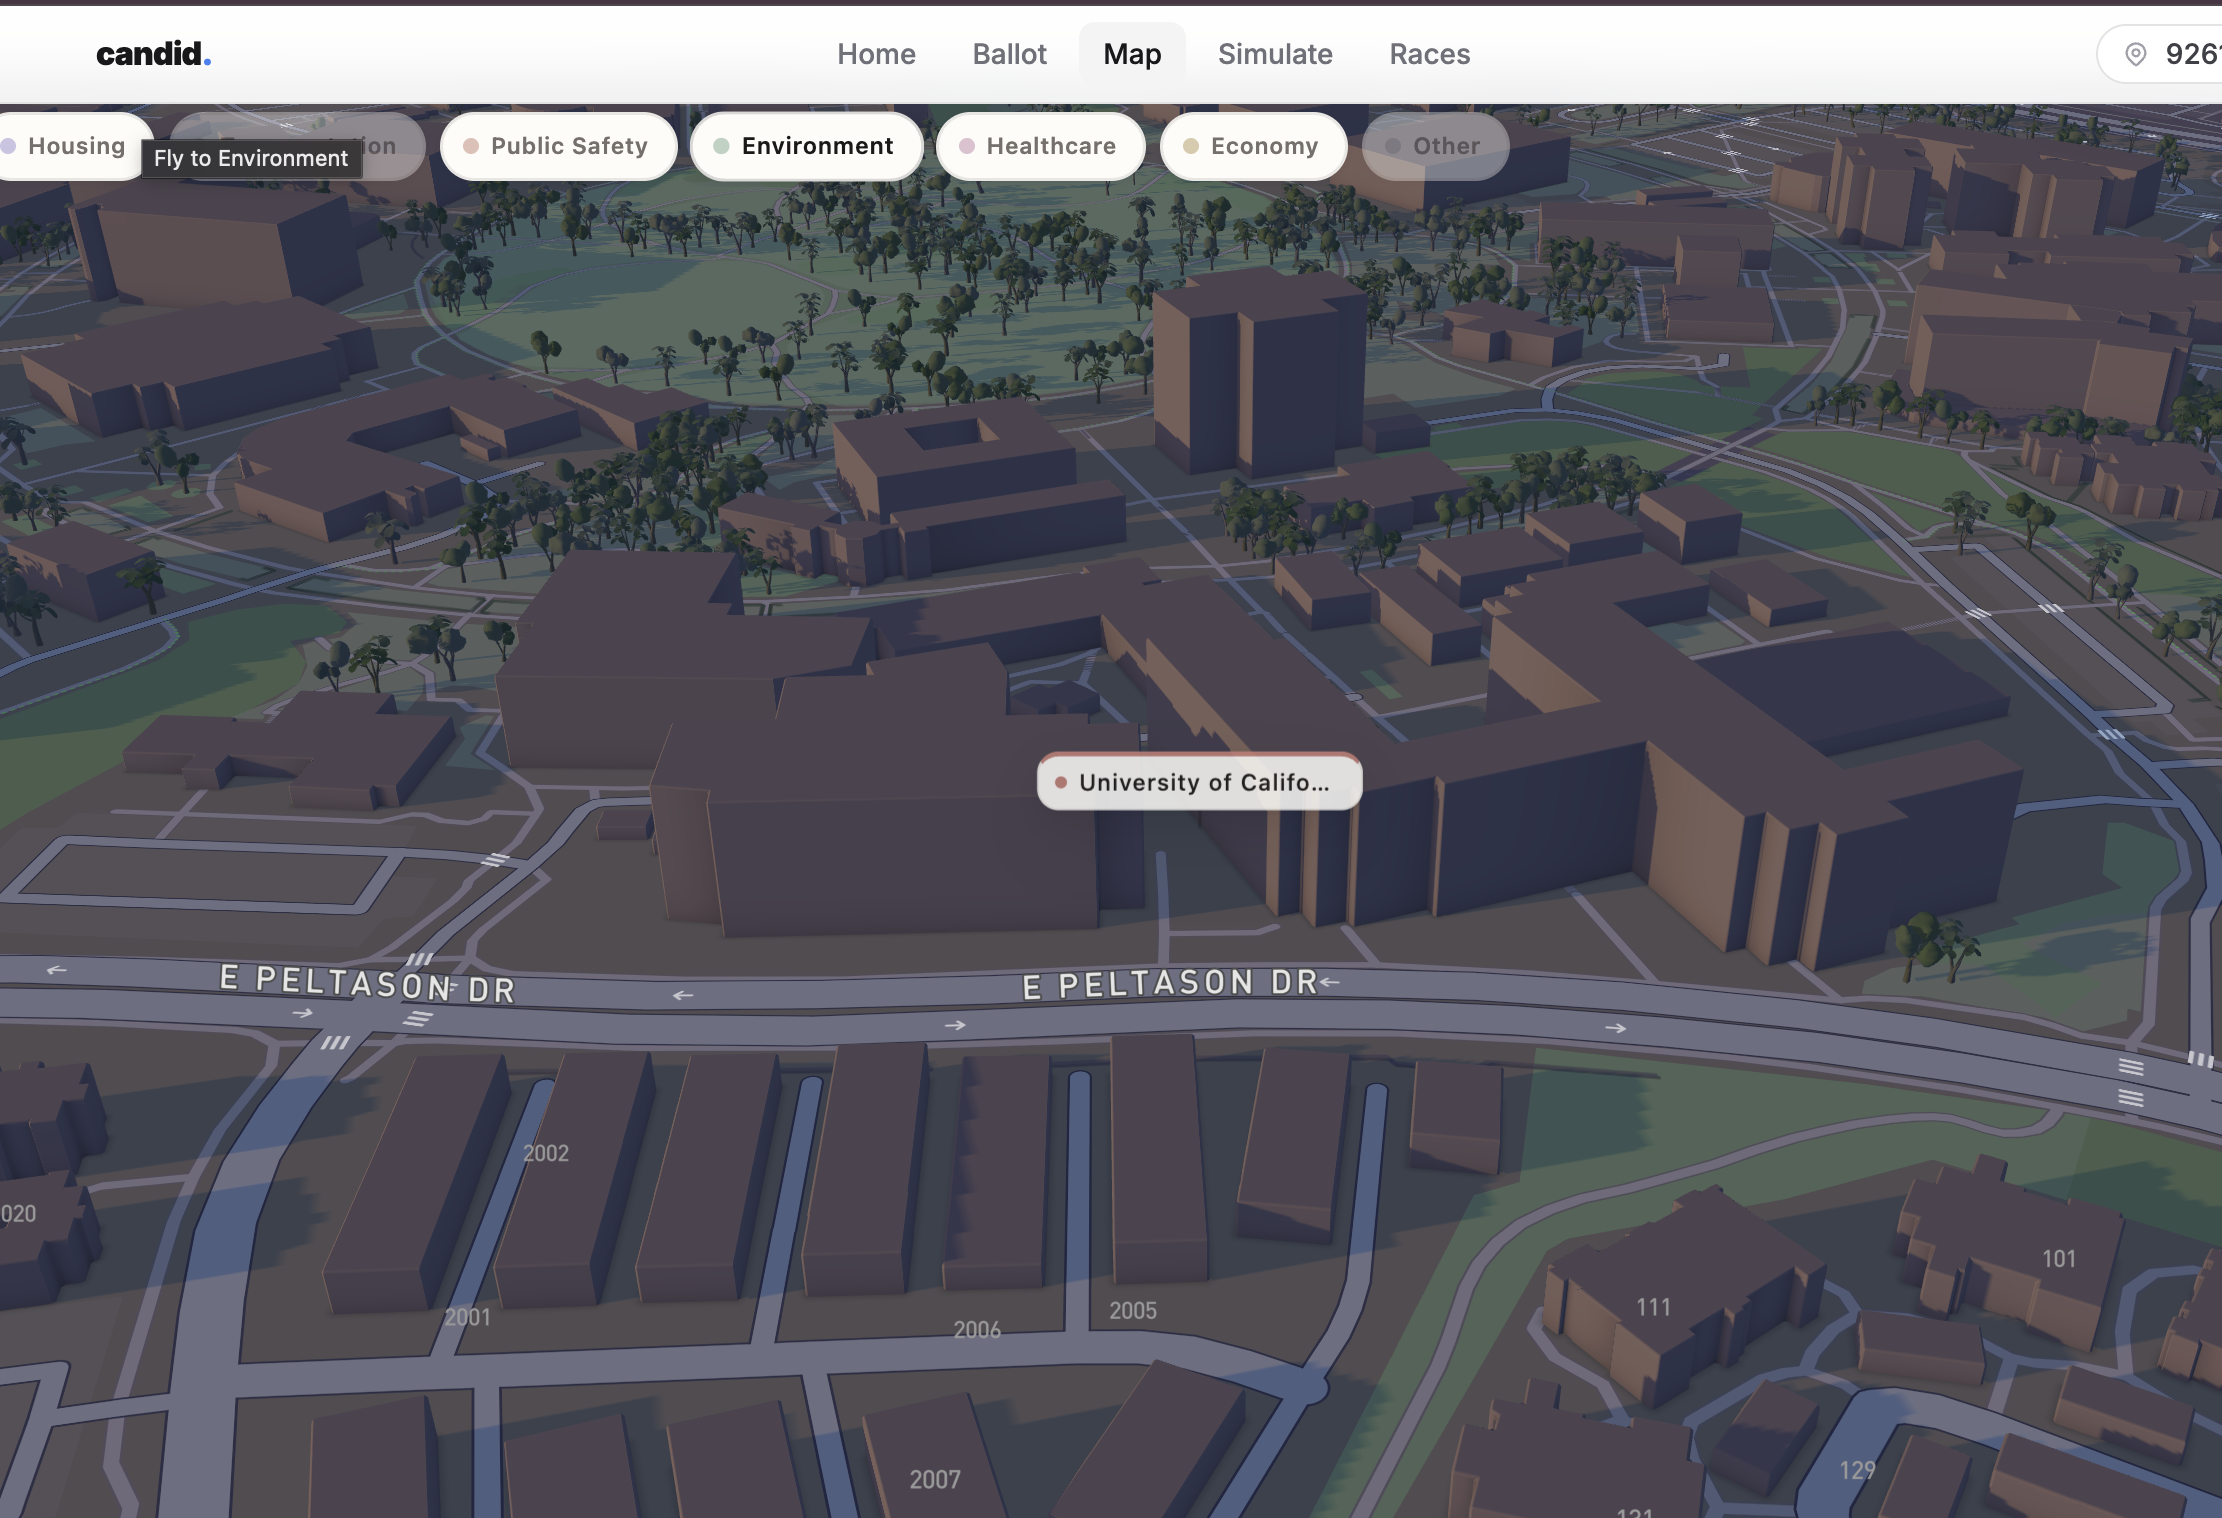
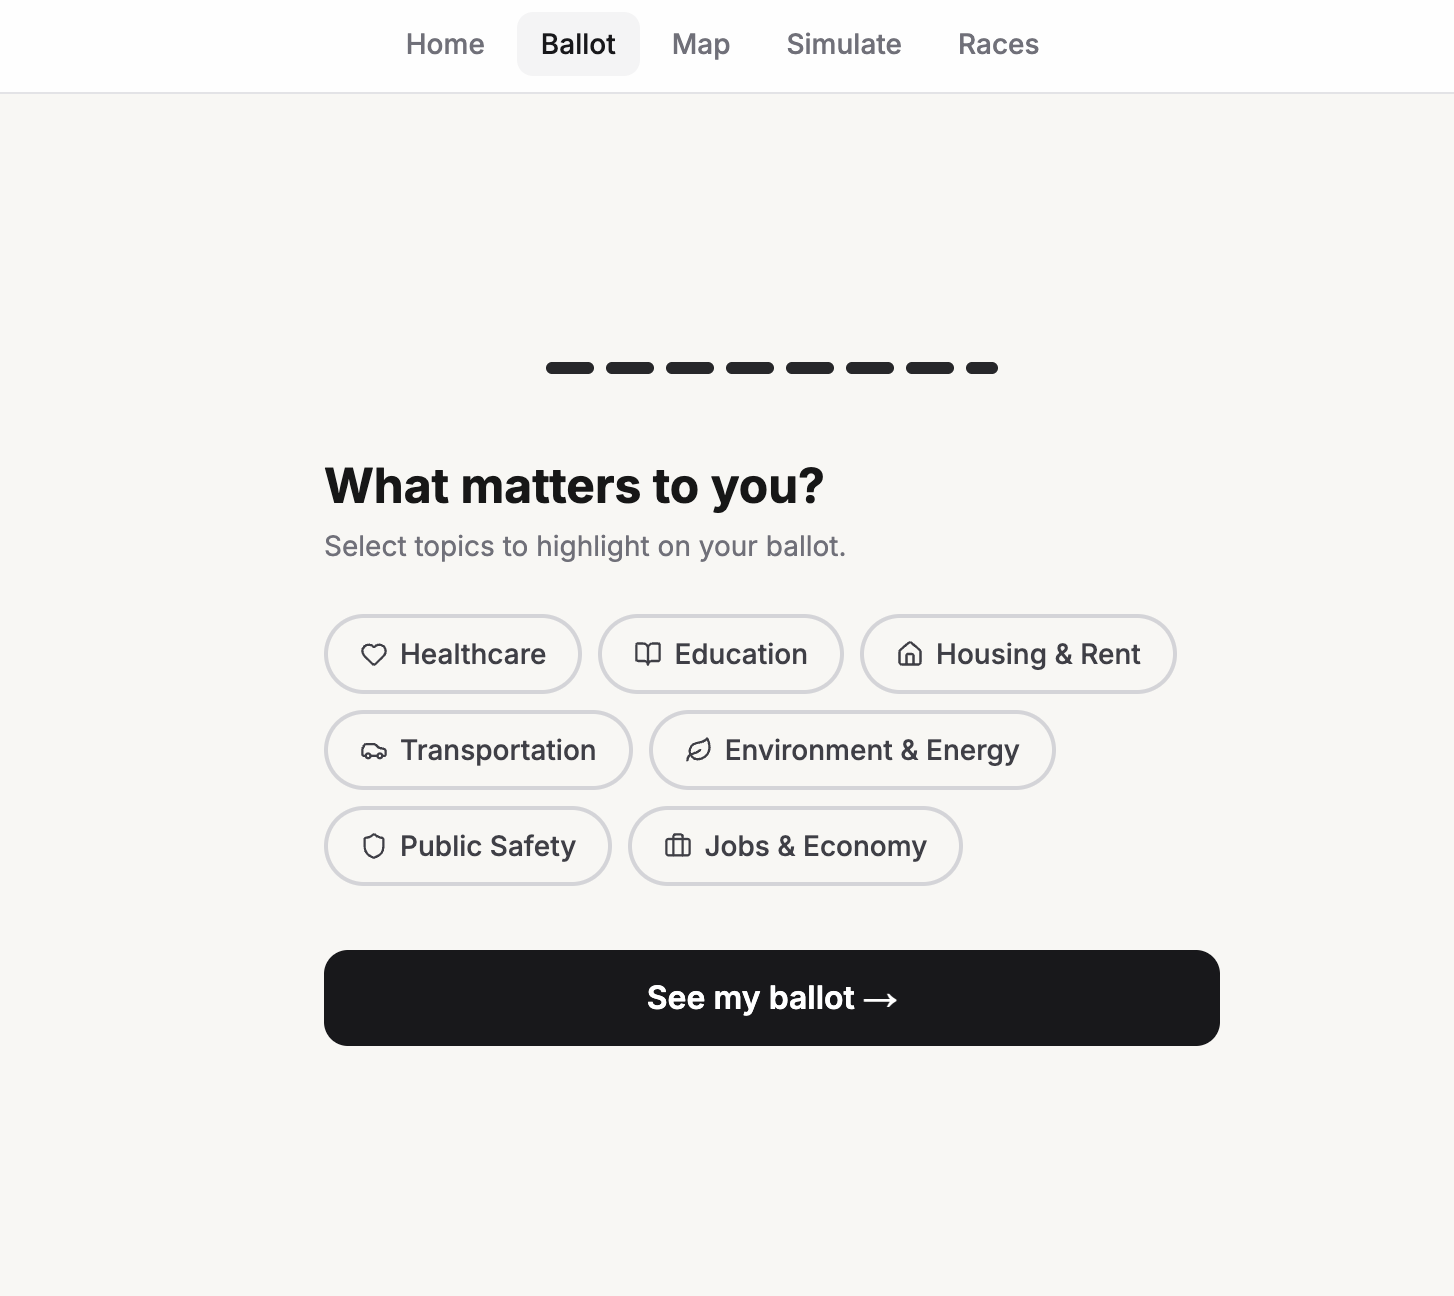
Candid takes real legislation, models its financial impact on your actual household, and explains it in plain English. Not summaries written by campaigns. Not vibes. Numbers, sources, and honest uncertainty, personalized to your ZIP code, income bracket, and housing situation. 52,521 chunks of real legislation from the 116th Congress and all 50 states. A machine learning budget model trained on thousands of rows of Census Bureau expenditure data. Real candidate records from OpenStates and the Congressional Bioguide. A live 3D civic map that finds your actual nearest hospital, school, and transit hub using Overpass API, then shows you how a bill affects each one. Every citation links to a real source. Every confidence score comes from actual cosine similarity out of ChromaDB. Every dollar figure traces to real state budget data.
How we built it
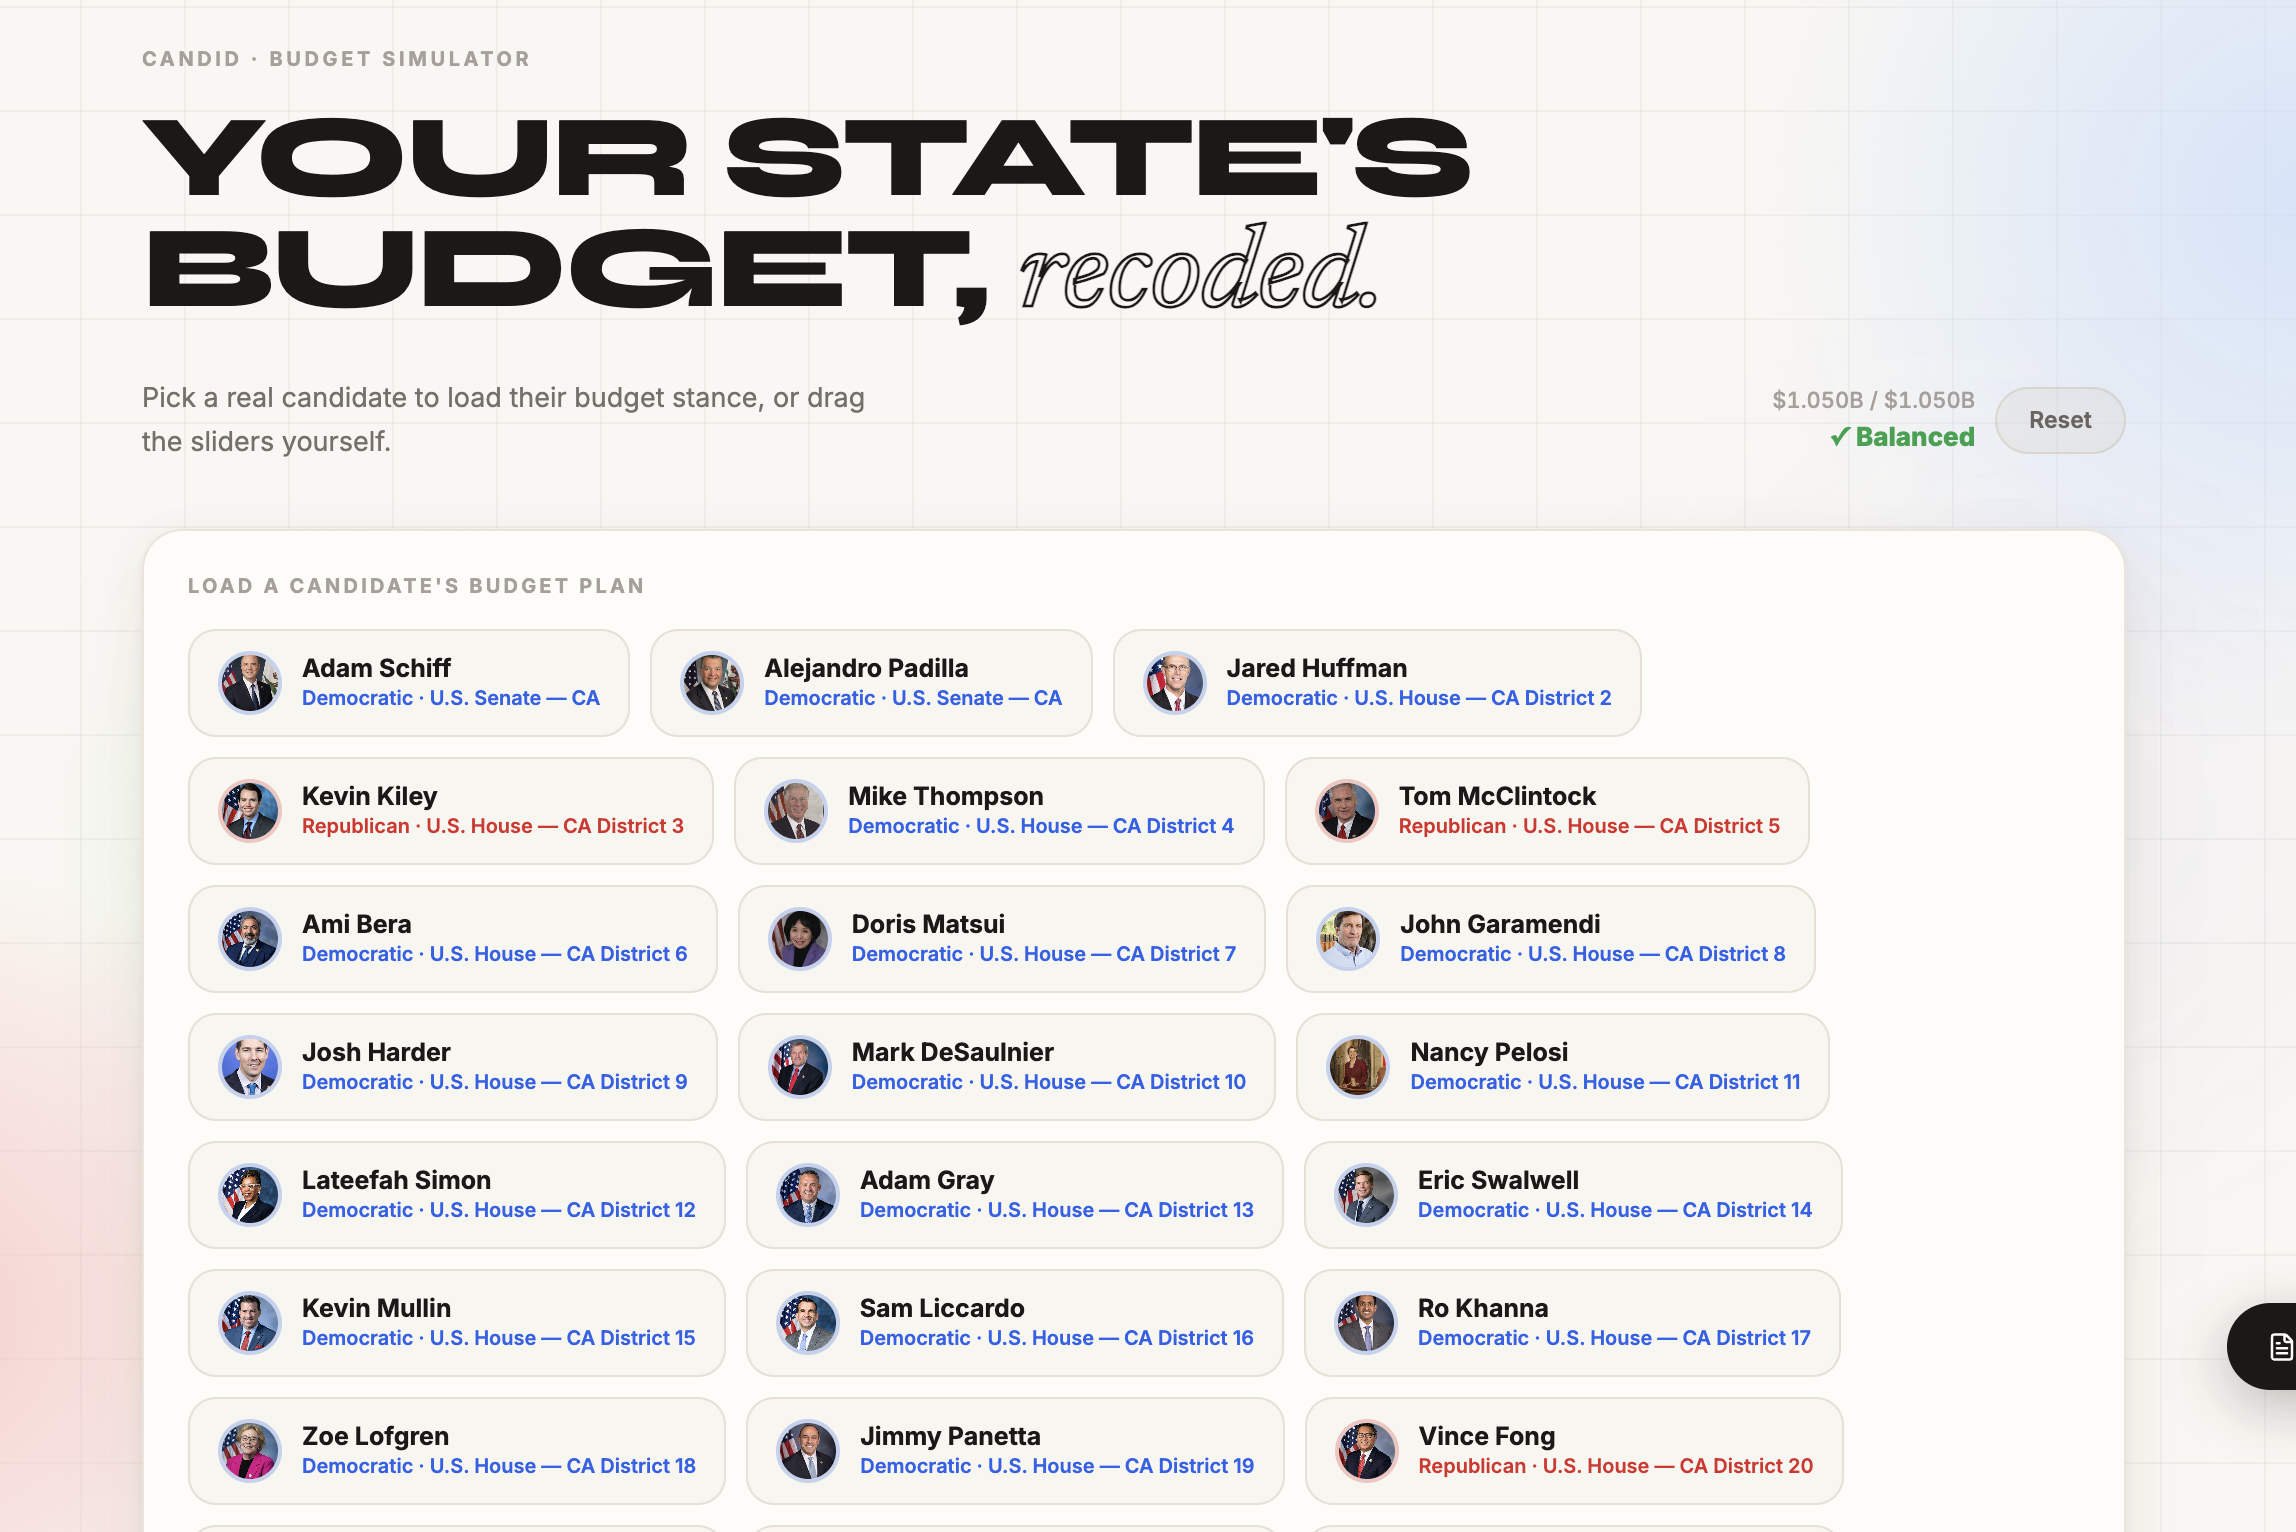
The RAG Pipeline We ingested 52,521 chunks of federal and state legislation, embedded them using sentence-transformers, and indexed them in ChromaDB. At query time, chunks are retrieved by semantic similarity, then reranked by Groq LLaMA 3.3 70B for voter relevance against the user's specific profile. We added jurisdiction-aware filtering so state legislation queries don't get contaminated by unrelated federal bills. The Budget Model We trained a linear regression model with engineered features on 2,151 rows of historical Census Bureau State and Local Government Finance data across all 50 states. Features include category relevance scores, lagged budget trends, and rolling 3-year averages. On top of the regression output, we built a keyword-based relevance scaling layer that makes the model semantically aware of bill content. A housing bill hits maximum housing impact. A voting rights bill correctly shows near-zero housing shift. The model earns its predictions. The Frontend Next.js and TypeScript, Framer Motion animations, a real-time 3D Mapbox GL visualization with live Overpass API POI lookup, and a budget simulator wired directly to real candidate data. The whole thing is personalized at the component level to the user's ZIP, income, and housing status. Challenges Early versions of the budget model predicted the same dollar impact for every bill regardless of what it said. We caught it and built the relevance scoring layer from scratch. Our confidence scores were hardcoded to 0.5. We replaced them with real cosine similarity scores. Our RAG was pulling unrelated federal bills for state legislation queries. We built jurisdiction-aware filtering to fix it. None of this was glamorous. All of it mattered.
Challenges we ran into
The first day was almost entirely data. Getting 52,521 legislation chunks ingested sounds straightforward until you're debugging why ChromaDB is rejecting half your documents, why sentence-transformers won't install on Python 3.14, and why your embedding job has been running for 3 hours and is 12% done. We spent the entire first day and most of the second morning just getting clean data into the vector database and a trained model on disk. The Census Bureau data alone took hours. Finding the right dataset, figuring out the API, getting the key activated, discovering the endpoint we needed didn't exist in the format we expected, falling back to raw CSV files, parsing inconsistent state abbreviations, and finally producing budget figures we could actually trust for all 50 states. Training the linear regression model sounds fast. It wasn't. Feature engineering the lagged trends and rolling averages on thousands of rows of messy government finance data, realizing the model was predicting identical outputs for every bill, diagnosing that the relevance signal was missing entirely, and rebuilding the prediction pipeline with a keyword-based scaling layer on top consumed most of our second day before we ever touched the frontend. By the time the data pipeline was solid and the model was honest, we had a fraction of the time left to build everything the user actually sees.
Accomplishments that we're proud of
We built something that doesn't lie to you. That sounds like a low bar. It isn't. Every number in Candid is defensible. The confidence score traces to a cosine similarity calculation. The budget impact traces to Census Bureau expenditure data. The citations link to the actual bill on OpenStates or Congress.gov. We could have hardcoded impressive-looking figures and shipped a prettier demo in half the time. We didn't. We're also proud that the budget model actually learned something. Getting a linear regression to produce meaningfully different outputs for a housing bill versus a voting rights bill required building a relevance layer from scratch on top of the regression output. It works. You can watch it work. A housing bill in California produces a real housing impact. A voting rights bill produces near zero. The model earned its predictions. And honestly, we're proud we finished. The first 20 hours were almost entirely infrastructure, data wrangling, and debugging. The fact that there's a working frontend at all is a minor miracle.
What we learned
Training data is a product. We treated the Census Bureau data like it would just work. It didn't. Inconsistent formats, missing state codes, endpoints that didn't exist, CSVs that were actually HTML. Every data source fought back. The lesson is that cleaning and validating data is not prep work before the real work. It is the real work. We also learned that a model that outputs something is not the same as a model that outputs something meaningful. Our regression ran fine from day one. It produced confident numbers for every bill. Those numbers were wrong in a subtle way that took hours to catch. The model had no signal connecting bill content to budget category. It was predicting based on historical trends alone, completely ignoring what the bill actually said. Building the relevance scoring layer to fix that was the most important technical decision we made. The last thing we learned is that honesty is a feature. Users notice when a system feels like it's performing confidence rather than earning it. Every time we replaced a hardcoded value with a real one, the product got better.
What's next for Candid
The 50-state data is there. The model is trained. The RAG pipeline is live. The obvious next step is making Candid work for every election, not just federal bills. We want to ingest local ballot measures, school board races, city council candidates. The further down the ballot you go, the less information voters have and the more a tool like this matters. A Senate race gets wall-to-wall coverage. A water district board race gets nothing. Candid should work for both. We also want to improve the budget model. Linear regression with engineered features was the right call for a hackathon because it's interpretable and fast to train. But with more data and more time, a gradient boosted model with richer legislative features could produce much tighter impact estimates. The architecture is already there. The pipeline just needs better inputs. Long term, Candid should be the thing you open before you vote. Not after. Not to confirm what you already think. Before, when the measure is still just a number on a piece of paper and you have no idea what it means for your life.
Built With
- 3.3
- 70b
- api
- bureau
- census
- chromadb
- css
- data
- fastapi
- framer
- gl
- groq
- llama
- mapbox
- motion
- next.js
- openstates
- overpass
- postgresql
- python
- scikit-learn
- sentence-transformers
- tailwind
- typescript


Log in or sign up for Devpost to join the conversation.