Inspiration
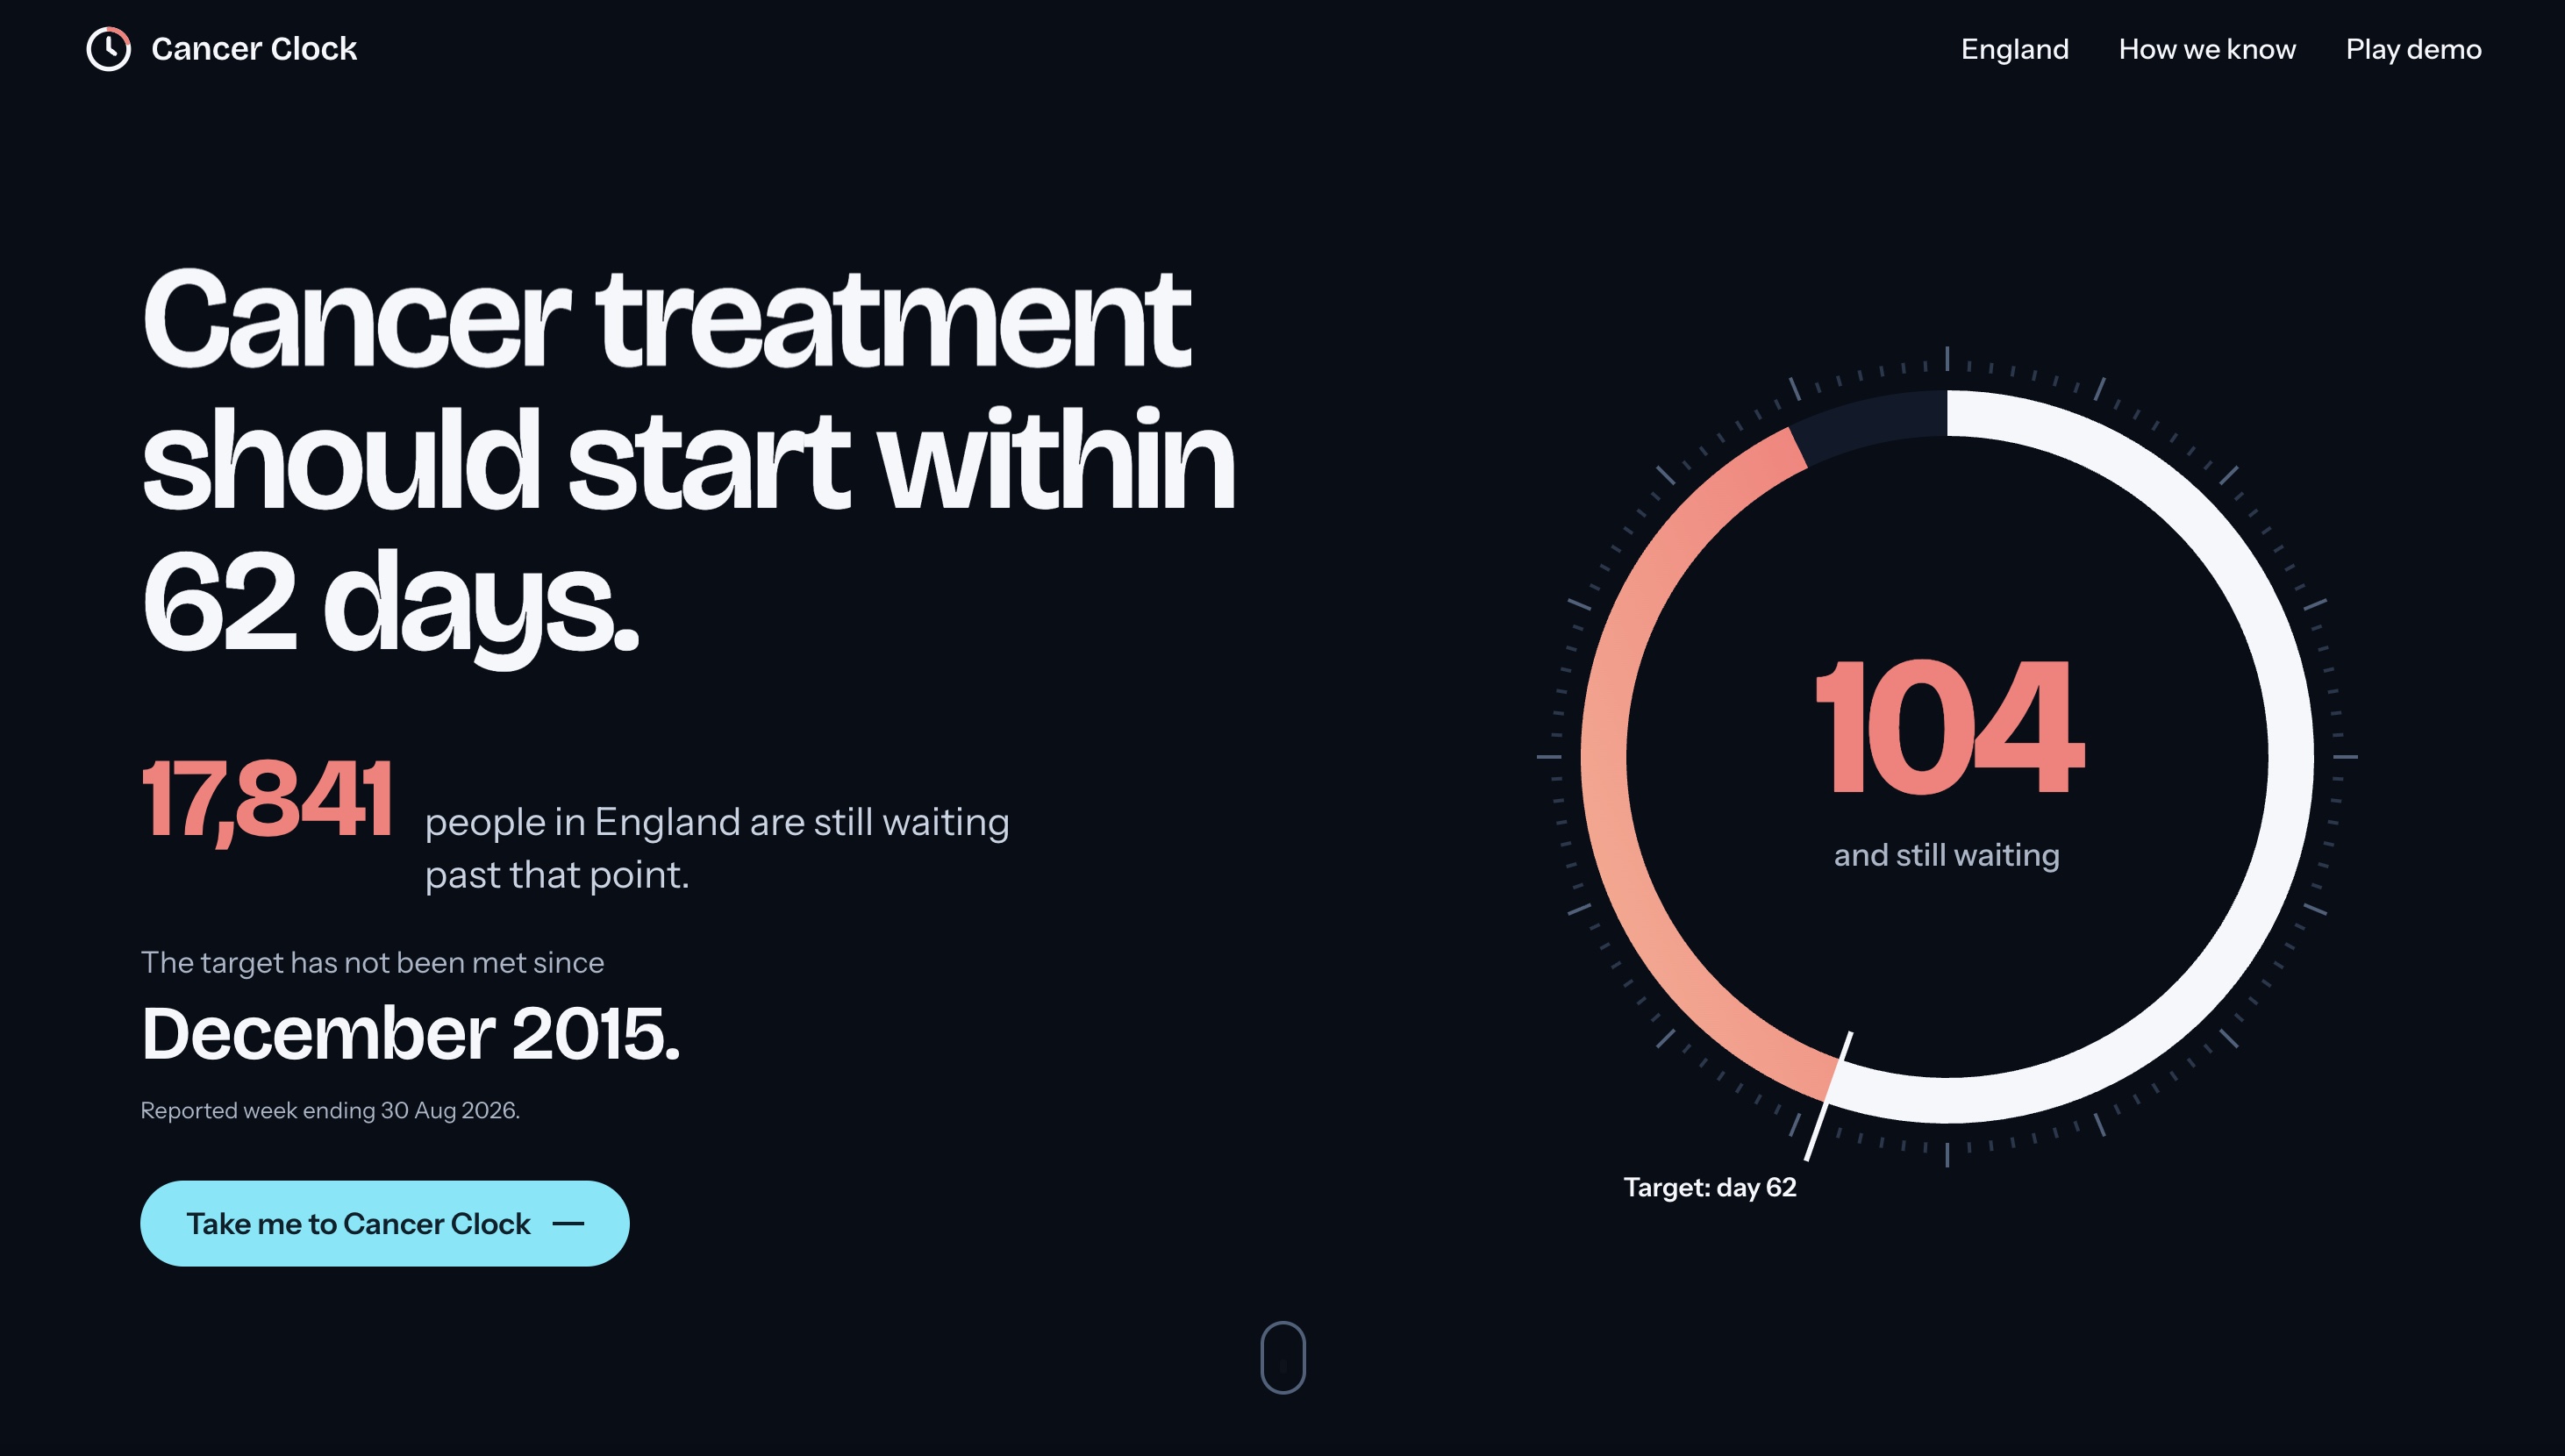
After an urgent cancer referral in England, treatment should start within 62 days. The NHS target is for 85% of patients to start within that window. It hasn't been met since December 2015, and the latest reported figure is 17,841 people waiting past day 62 (week ending 30 August 2026).
Research in the BMJ found that each four-week delay in cancer treatment is linked to a 6–13% higher risk of death. Yet the published figures are already about 7 weeks old by the time hospitals see them. They tell you where waits were, not where they're heading, and not what would help.
One of us studies medicine, and that's how we came to this problem. We wanted to turn public data into something a hospital could act on.
What it does
Cancer Clock answers three questions for each of 130 NHS trusts that treat cancer:
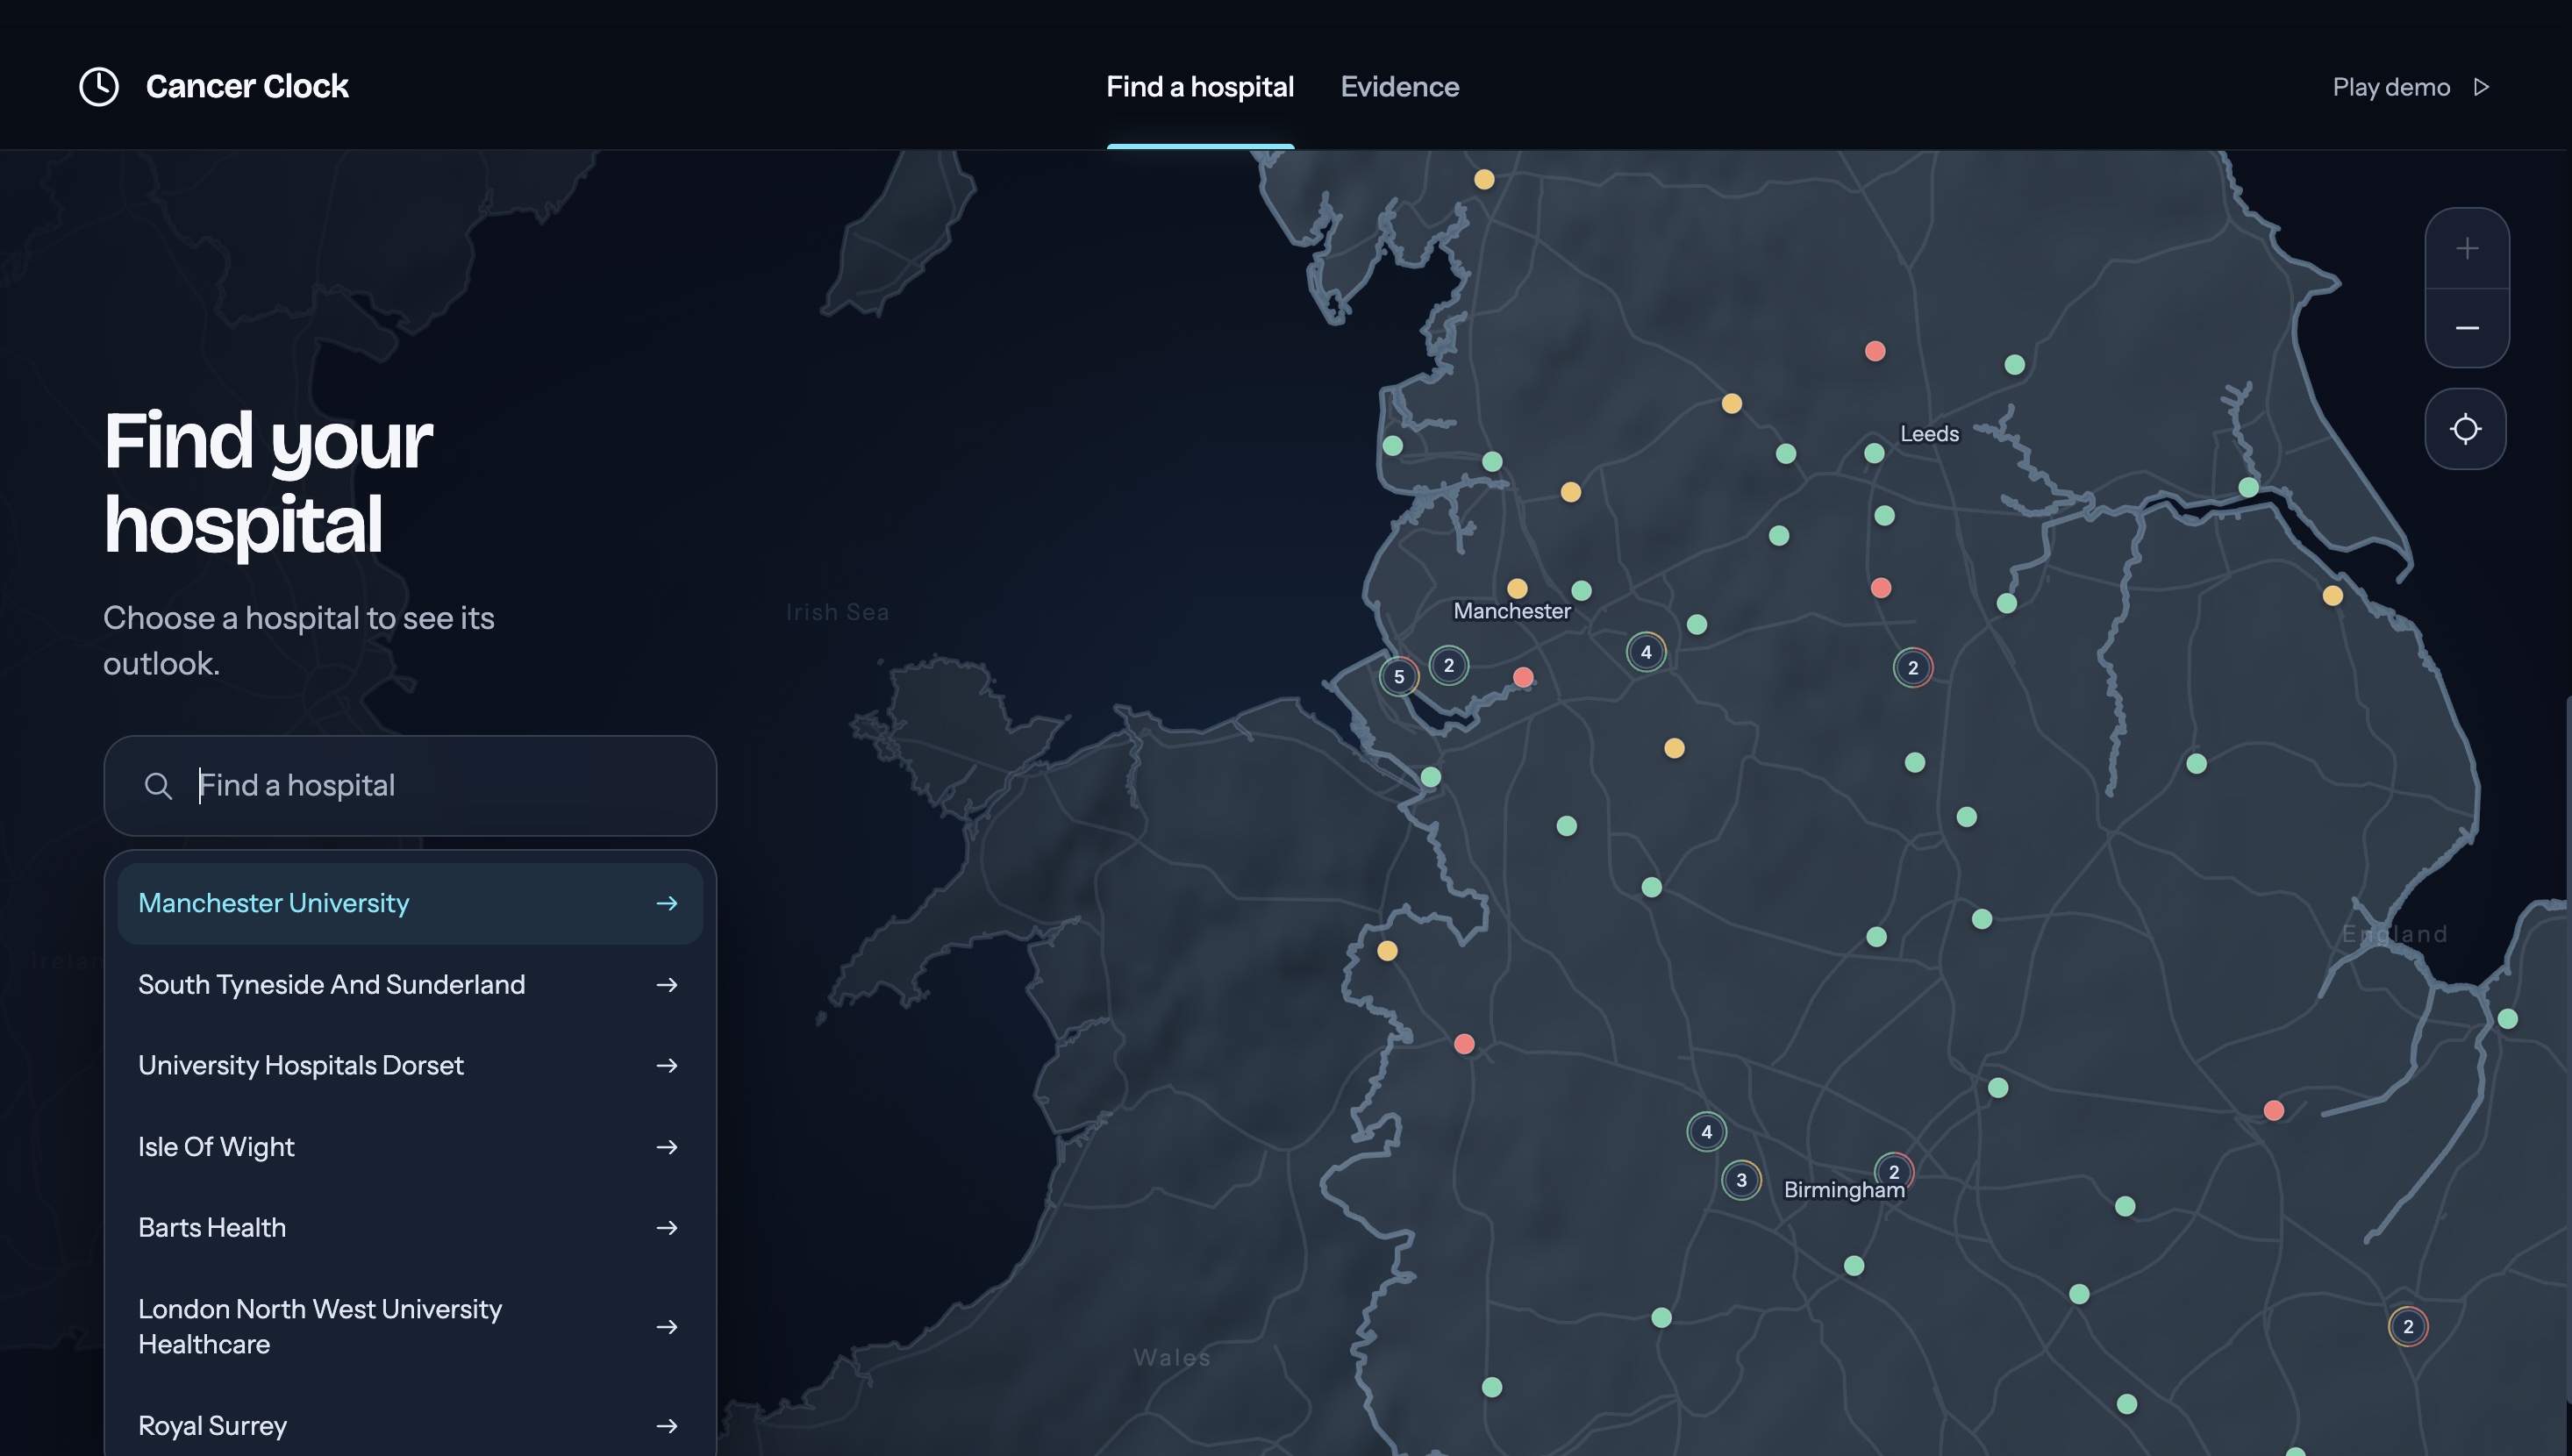
- Where are waits building? A map of England showing whether each hospital's backlog is expected to rise or fall.
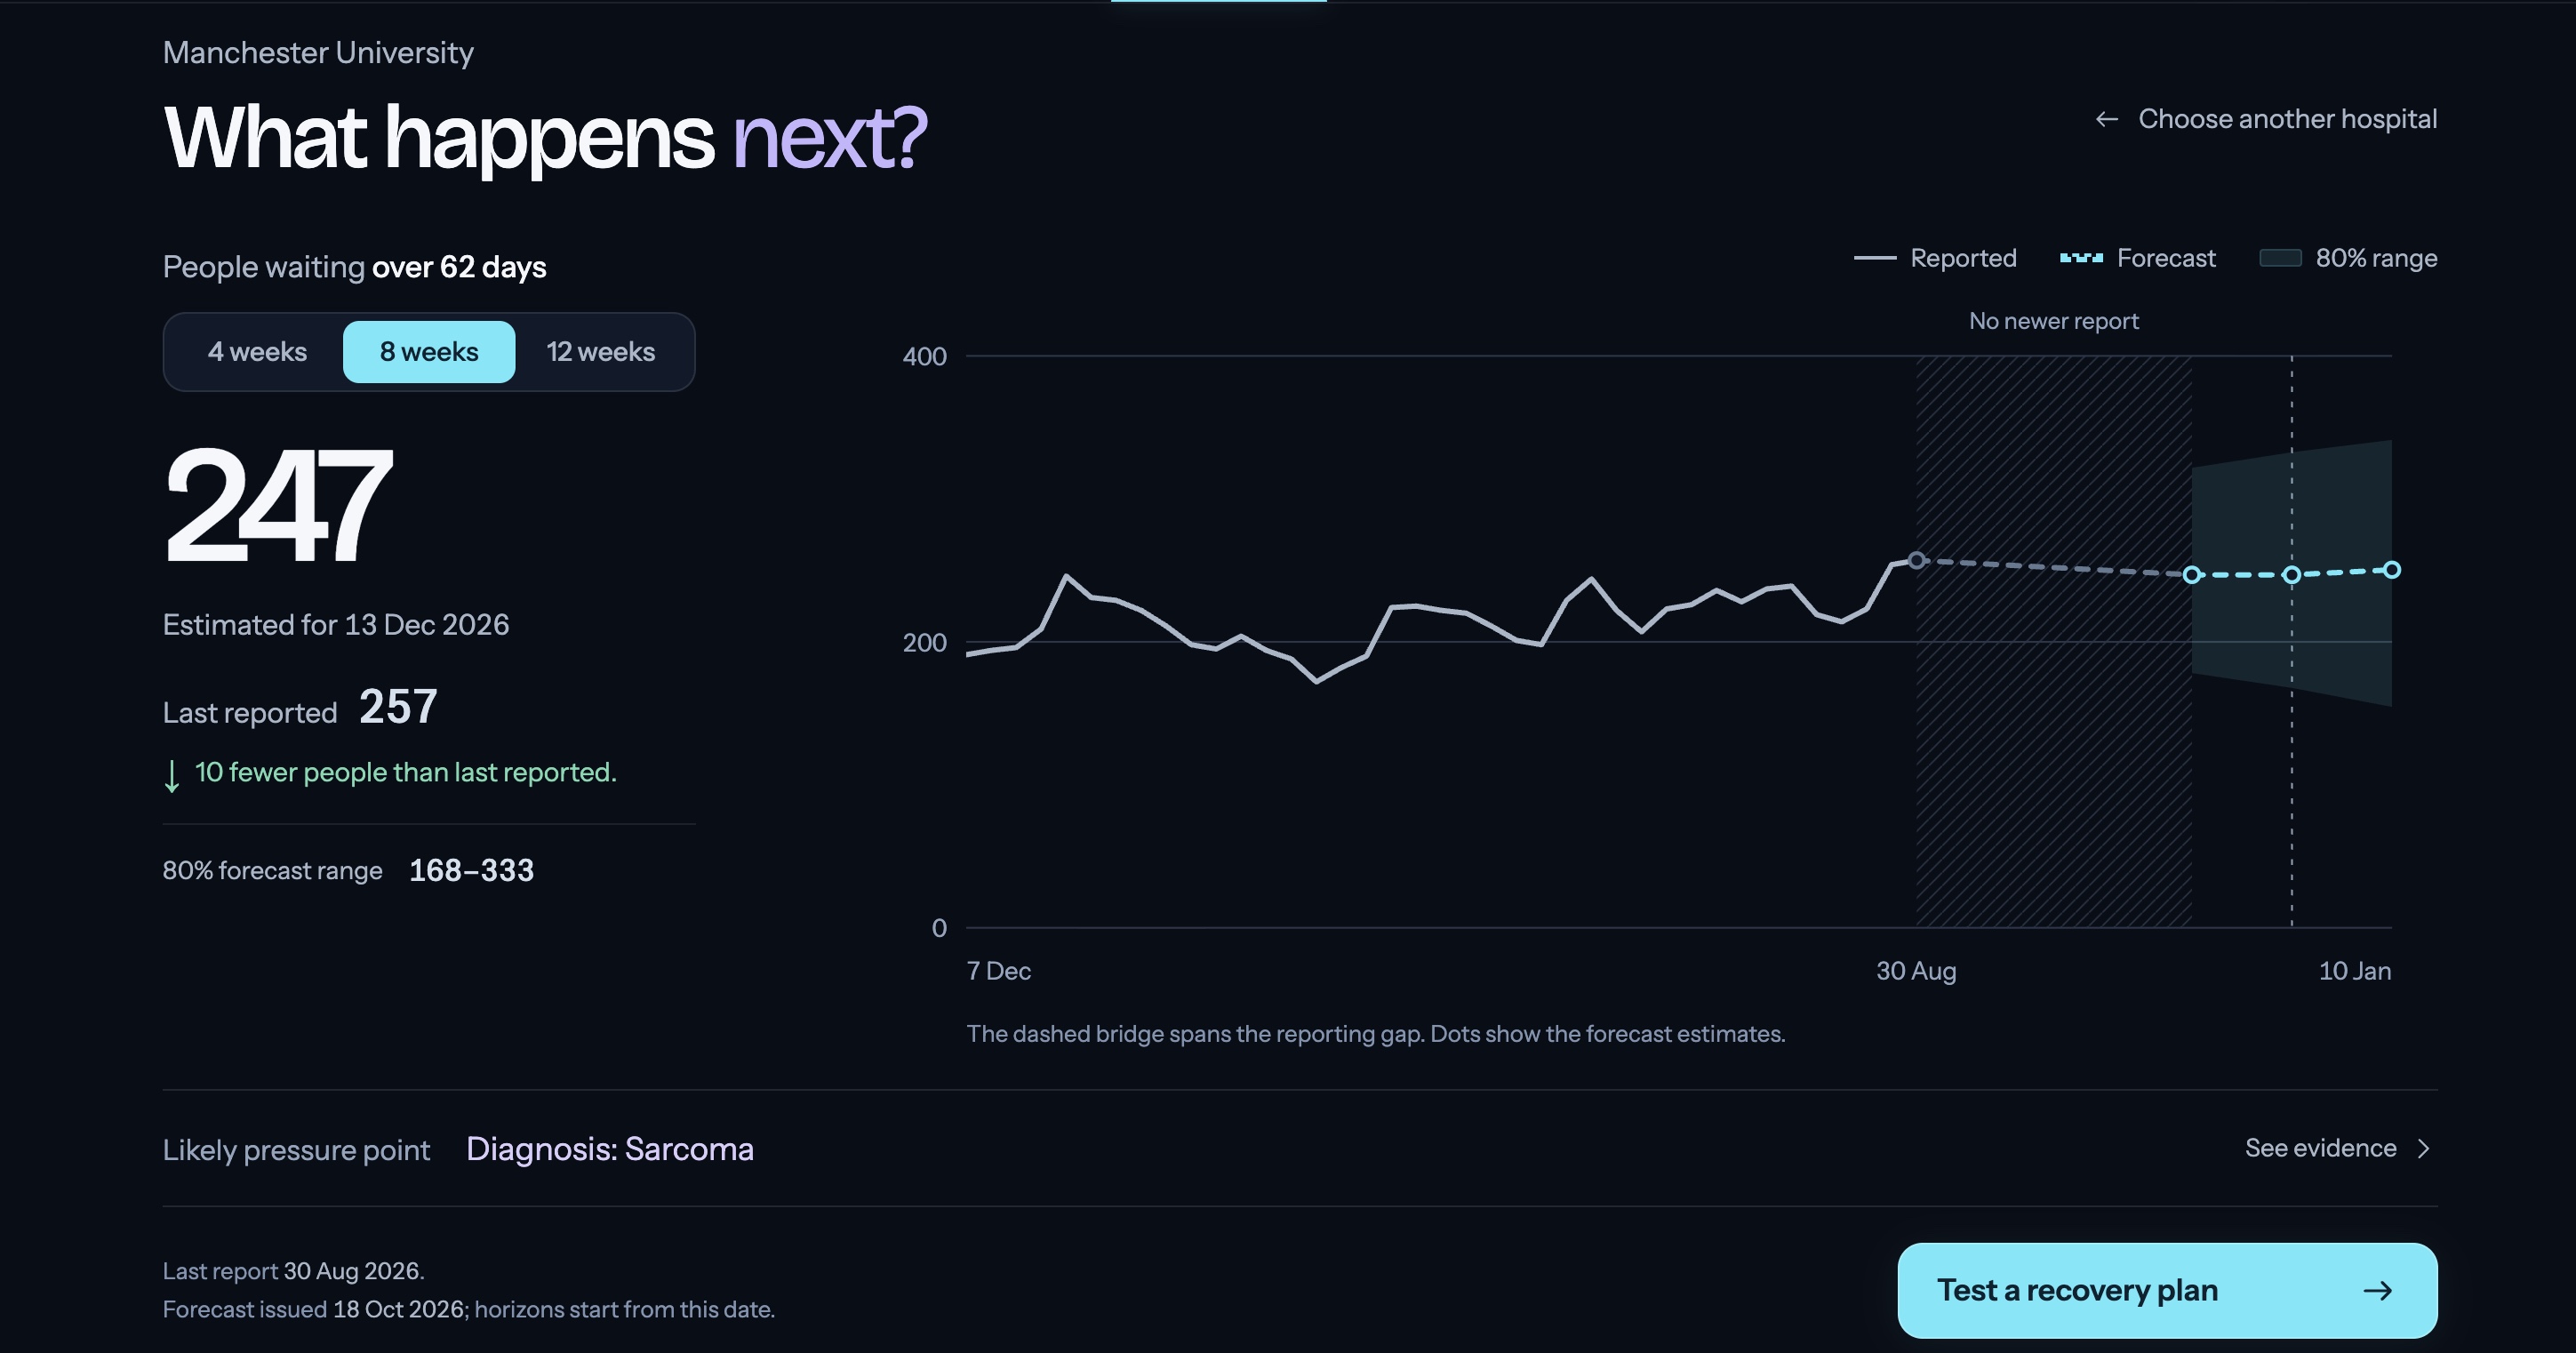
- What happens next? A 12-week forecast of people waiting past day 62, with an 80% range so the uncertainty is visible.
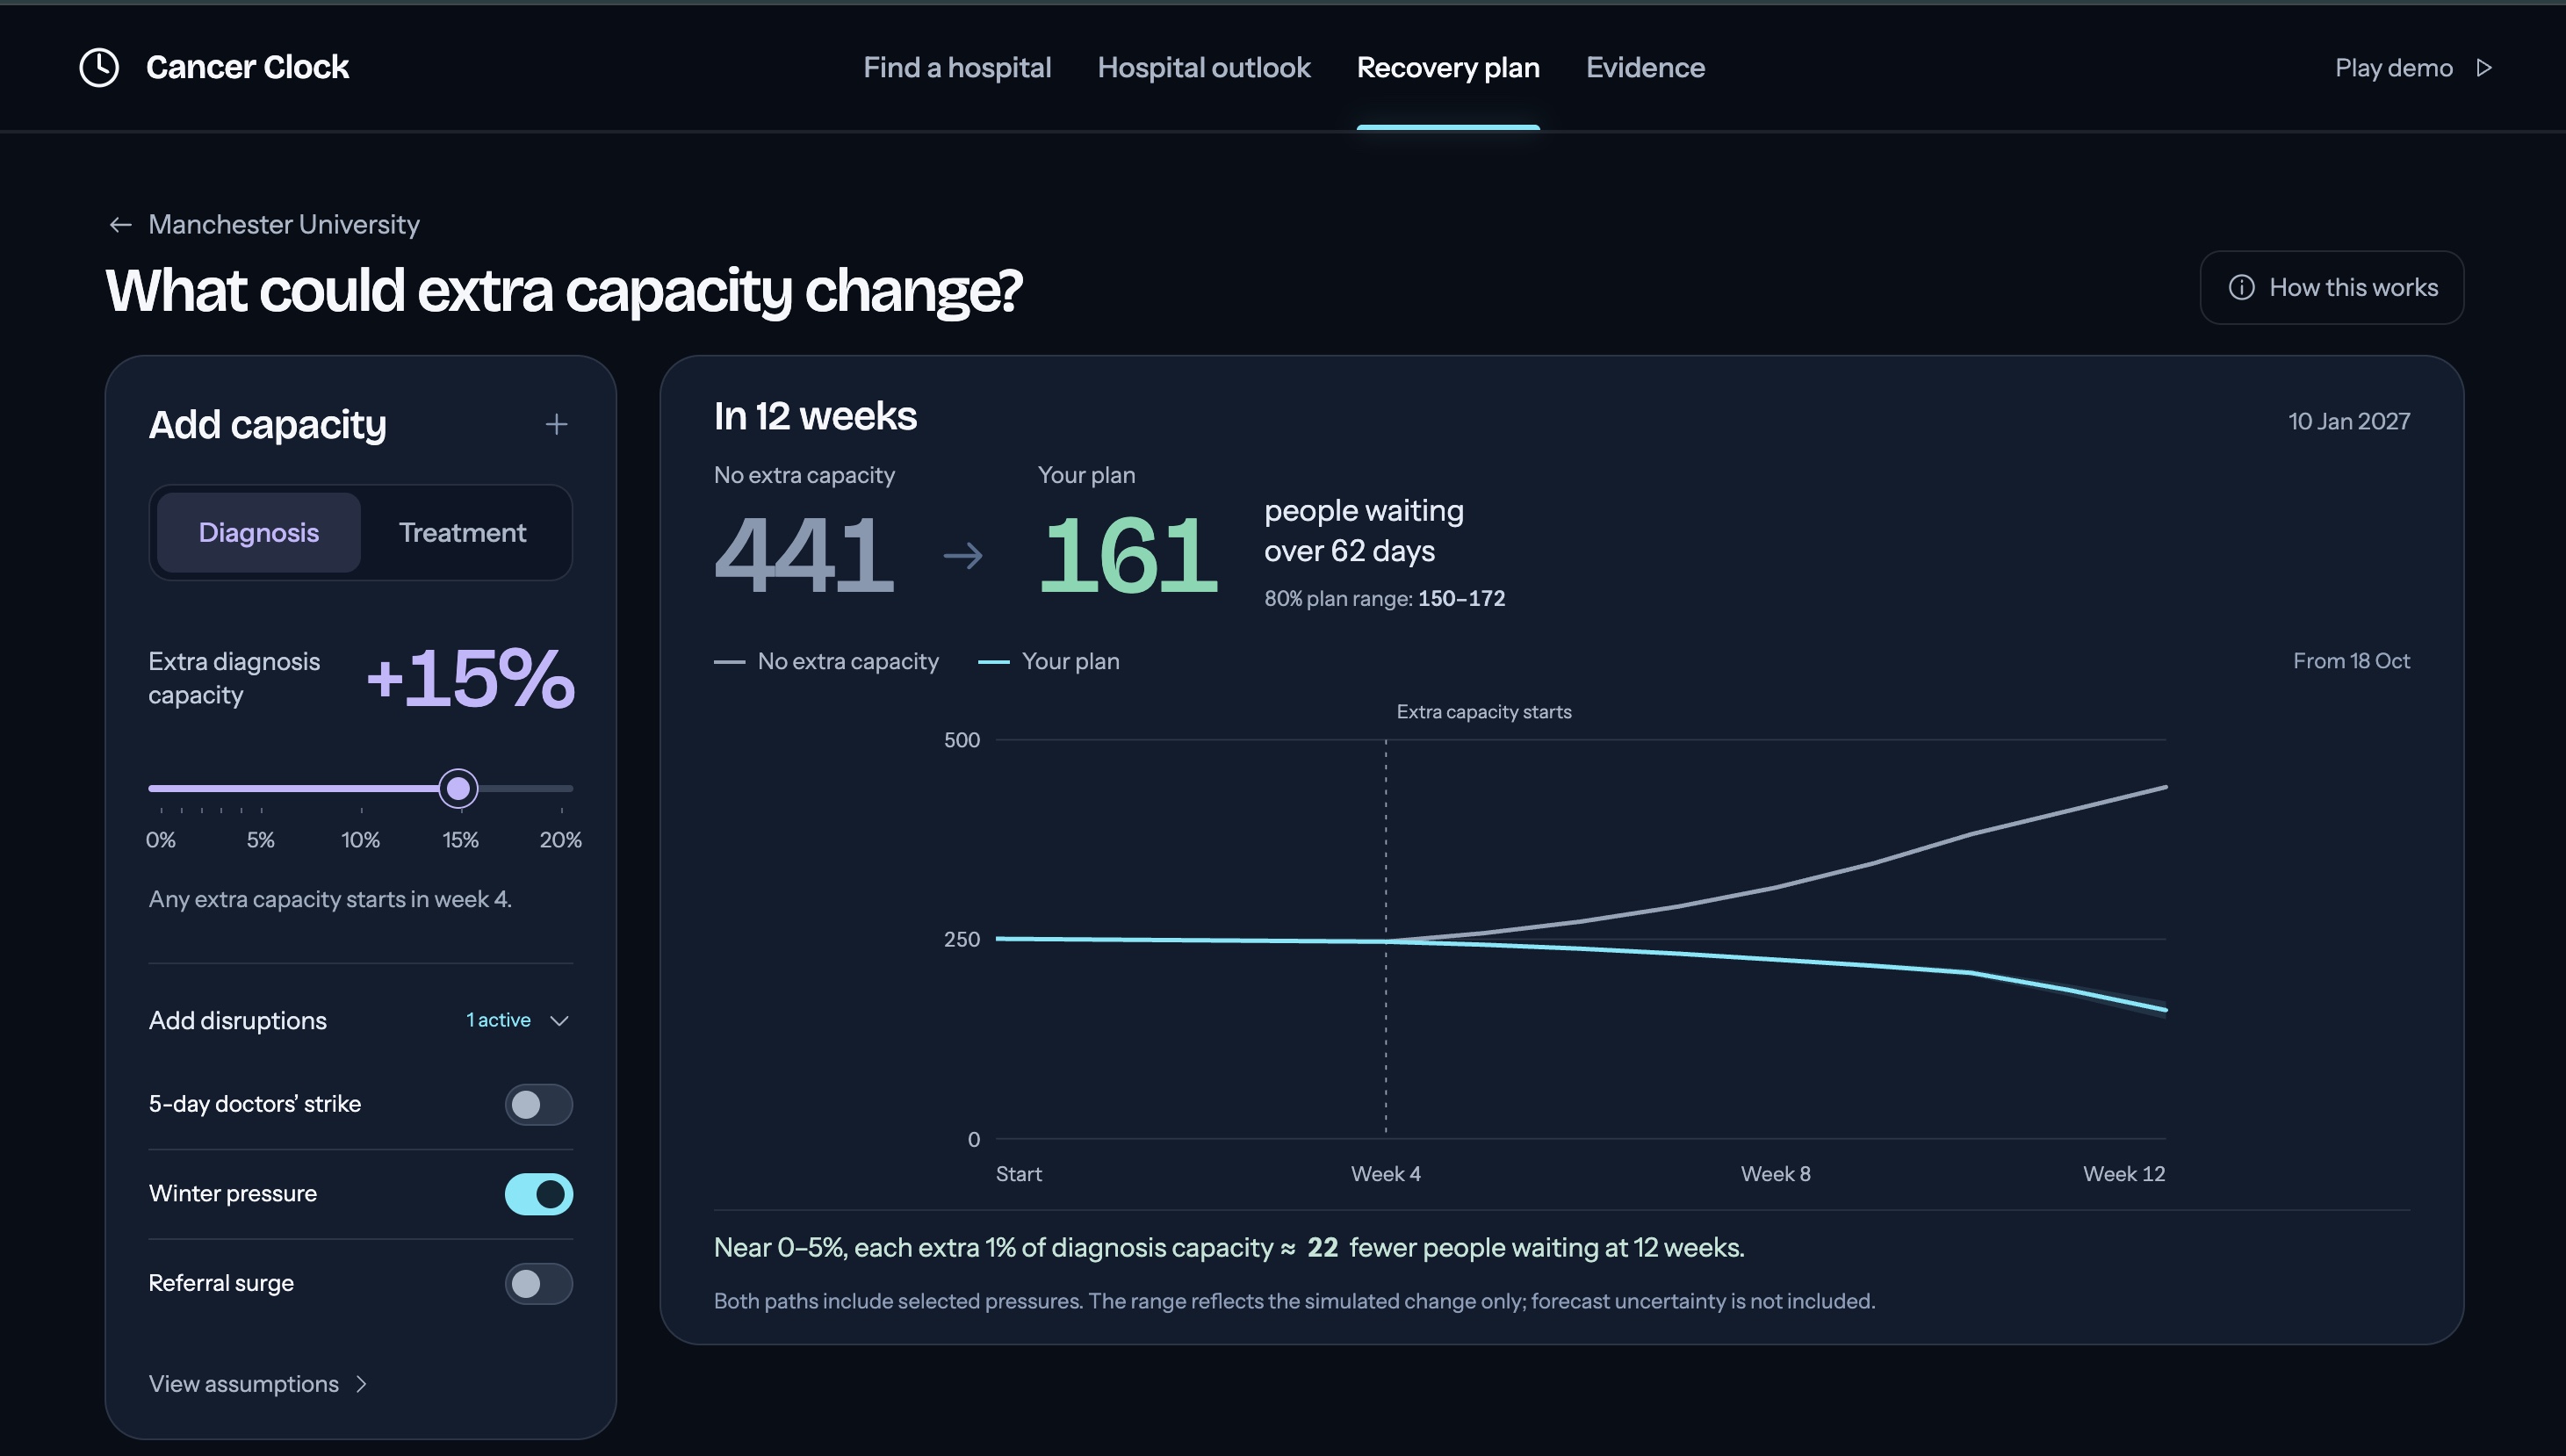
- What would help? A recovery planner. It flags the likely pressure point (diagnosis or treatment) and lets you test extra capacity, strikes, winter pressure or referral surges.
Example: Oxford University Hospitals
- Forecast: about 175 people waiting past day 62 by 10 Jan 2027 (80% range 113–253).
- Pressure point: treatment. Only 61.7% of radiotherapy patients start within 31 days, against 88.7% across England.
- Plan: +10% treatment capacity from week 4 brings that to about 147, roughly 28 fewer people waiting. That's a model estimate, not a guarantee.
How we built it
Data. Three public NHS England datasets (Open Government Licence v3.0):
- the weekly 62-day backlog, per trust;
- monthly cancer waiting times, by cancer type and treatment;
- monthly diagnostic waiting times for scans and scopes.
We cleaned and joined them into one weekly table. Every row records an estimated first-publication date, so the model only ever "sees" data that would have been public at the time. We also stitched together 4 hospital mergers, so the model doesn't learn fake overnight surges.
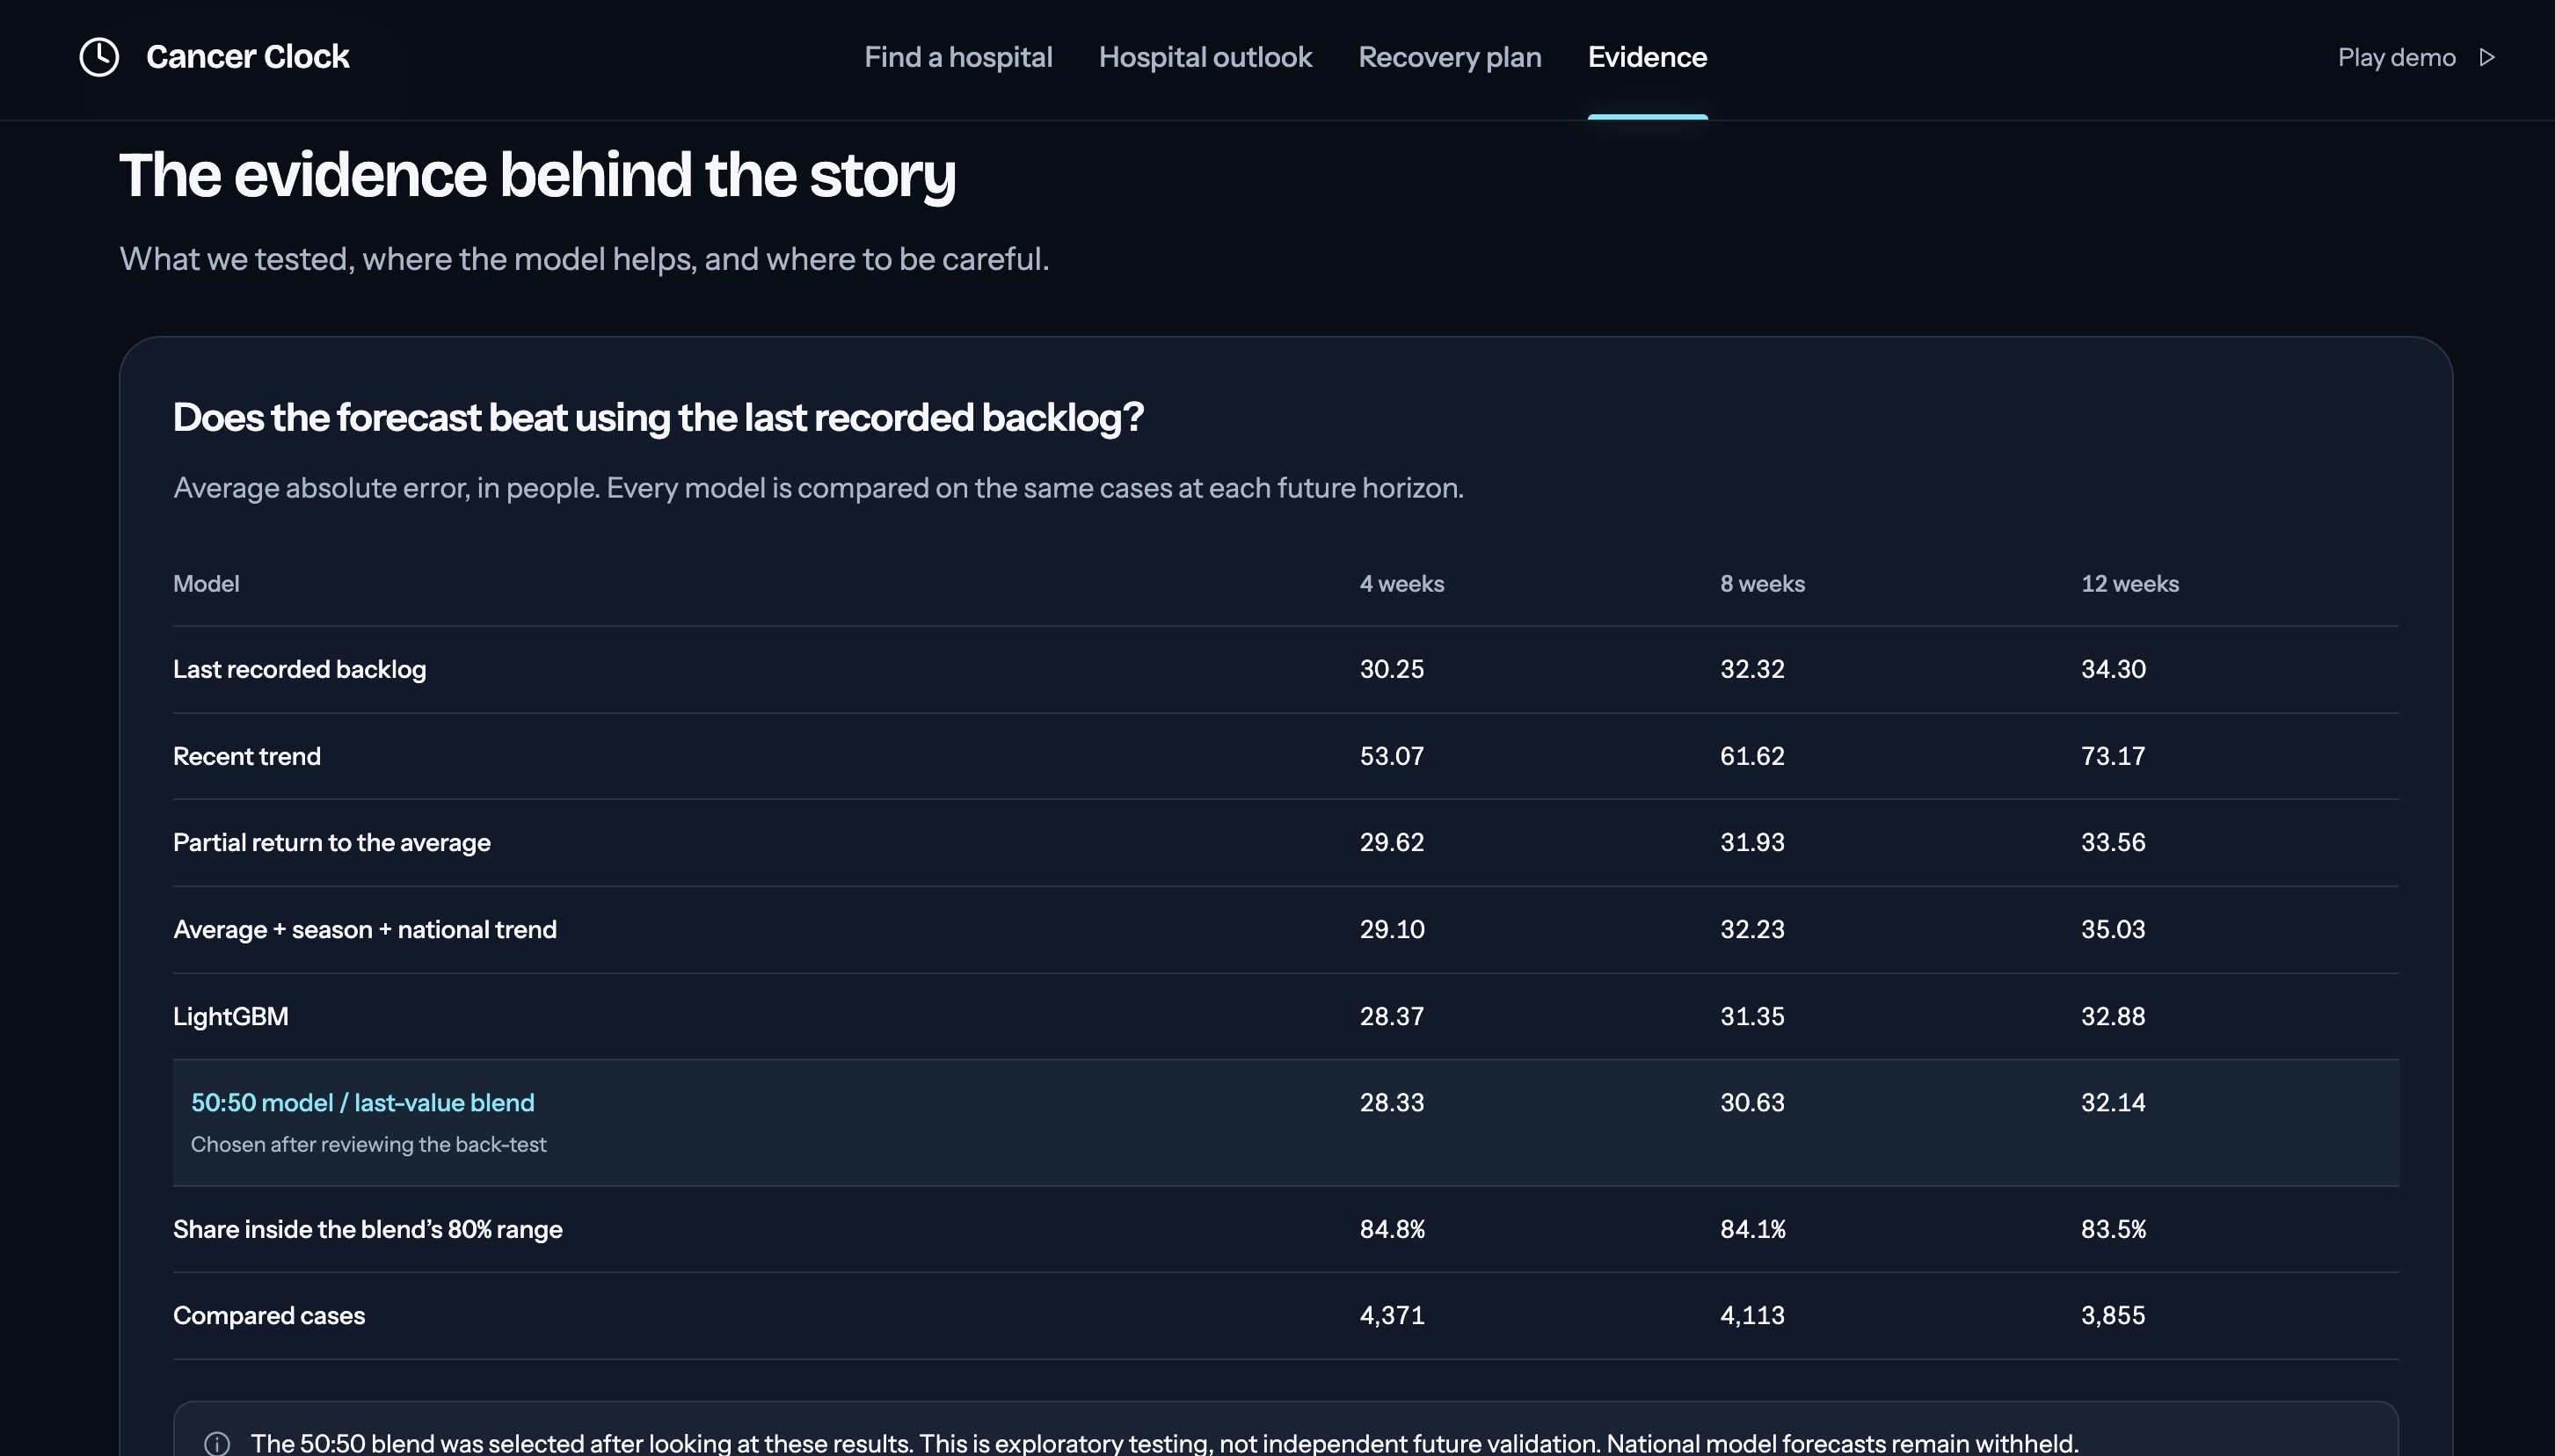
Forecast. A single LightGBM model trained across all trusts on 64 signals: recent backlog and trends, diagnosis and treatment performance, scan queues, the England-wide trend, strike days and seasonality. It predicts the percentage change, so large and small hospitals compare fairly. The final forecast blends the model with the latest reported value:
$$\text{forecast} = 0.5 \times \text{LightGBM} + 0.5 \times \text{latest value}$$
Back-test. We stepped back in time to 35 past dates. Each time we forecast using only data published by then and scored the forecast against what really happened, 12,339 forecasts in total. Cancer Clock beat the "assume nothing changes" benchmark at 4, 8 and 12 weeks (average error 28.3 vs 30.3 people per hospital at 4 weeks). The 80% range caught the real outcome about 84% of the time.
Pressure points. A stage is flagged only if it passes three tests:
- It's worse than England in at least 2 of the last 3 months.
- It's still worse after small samples are pulled towards the average.
- It's at least 5 percentage points behind.
Recovery planner. A two-stage daily queue model (diagnosis, then treatment), tuned to each hospital's history, with 256 Monte Carlo runs per plan. To keep the planner consistent with the outlook, plans use the forecast for the level and the queue model only for the effect of a change:
$$\text{plan} = \text{forecast} - \text{simulated effect} \quad (175 - 28 = 147)$$
App. A Python/FastAPI backend serving a React frontend, with an animated map of England, hospital outlooks, the planner and an evidence page.
Challenges we ran into
- The reporting gap. NHS data is published about 7 weeks after the period it covers. A "12-week" forecast is really looking 19 weeks past the last real data, and back-testing had to respect those delays to be fair.
- Hospital mergers. When two trusts merge, the backlog "doubles" overnight. Without stitching the histories together, the model learned surges that never happened.
- Two models that disagreed. Our first planner's "do nothing" number didn't match the forecast, so the app contradicted itself. Combining the two models (forecast for the level, queue model for the change) fixed it.
- Misleading signals. Oxford has very long routine gastroscopy queues (70% waiting over 6 weeks vs 30% in England), but urgent upper-GI cancer patients there are diagnosed faster than average. Urgent patients are fast-tracked past routine queues, so we use cancer-specific results to find pressure points.
- Not overclaiming. We chose the 50:50 blend after seeing back-test results, so we say so openly. The 8-week improvement isn't statistically proven, and we say that too.
Accomplishments that we're proud of
- An end-to-end tool covering 130 trusts, built entirely on public data.
- A forecast that was honestly back-tested on 12,339 cases and beats a strong benchmark.
- Recovery plans available for 109 trusts. Where the data can't support a plan, the app holds it back rather than guessing.
- Clear limits stated throughout: not a prediction of any individual's wait, and plans compare options rather than guarantee outcomes.
What we learned
- A simple "nothing changes" guess is a surprisingly strong benchmark for hospital queues. Beating it honestly is harder, and more meaningful, than it sounds.
- Getting the data timing right matters as much as the model.
- Showing uncertainty and limitations builds more trust than a confident single number.
- Statistical forecasts and mechanistic simulations are good at different jobs, and work best together.
What's next for Cancer Clock
- Validate on new months as they're published, rather than only on past data.
- Use original historical versions of the data, not later revisions.
- Get clinical review of the pressure-point rules and planner assumptions.
- Model specific treatments (e.g. radiotherapy) separately, rather than the whole treatment stage.
- Pilot with an NHS trust or cancer alliance to see if it helps real planning decisions.
Made by Completa.
Built With
- beautiful-soup
- css
- fastapi
- html
- lightgbm
- machine-learning
- matplotlib
- monte-carlo-simulation
- nhs-england-open-data
- numpy
- openpyxl
- pandas
- pyarrow
- pydantic
- pytest
- python
- react
- scipy
- time-series-forecasting
- typescript
- uvicorn
- vite

Log in or sign up for Devpost to join the conversation.