-
-
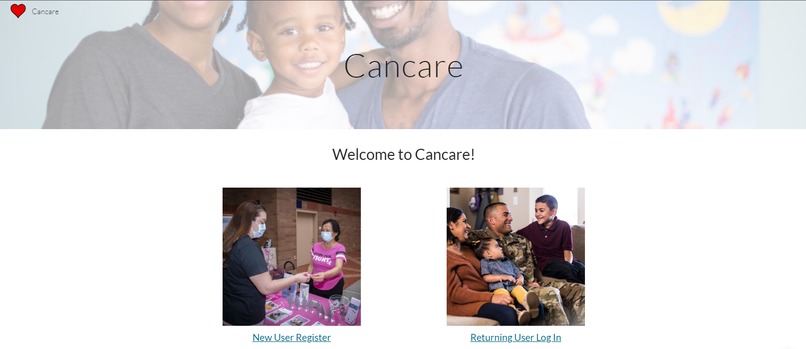
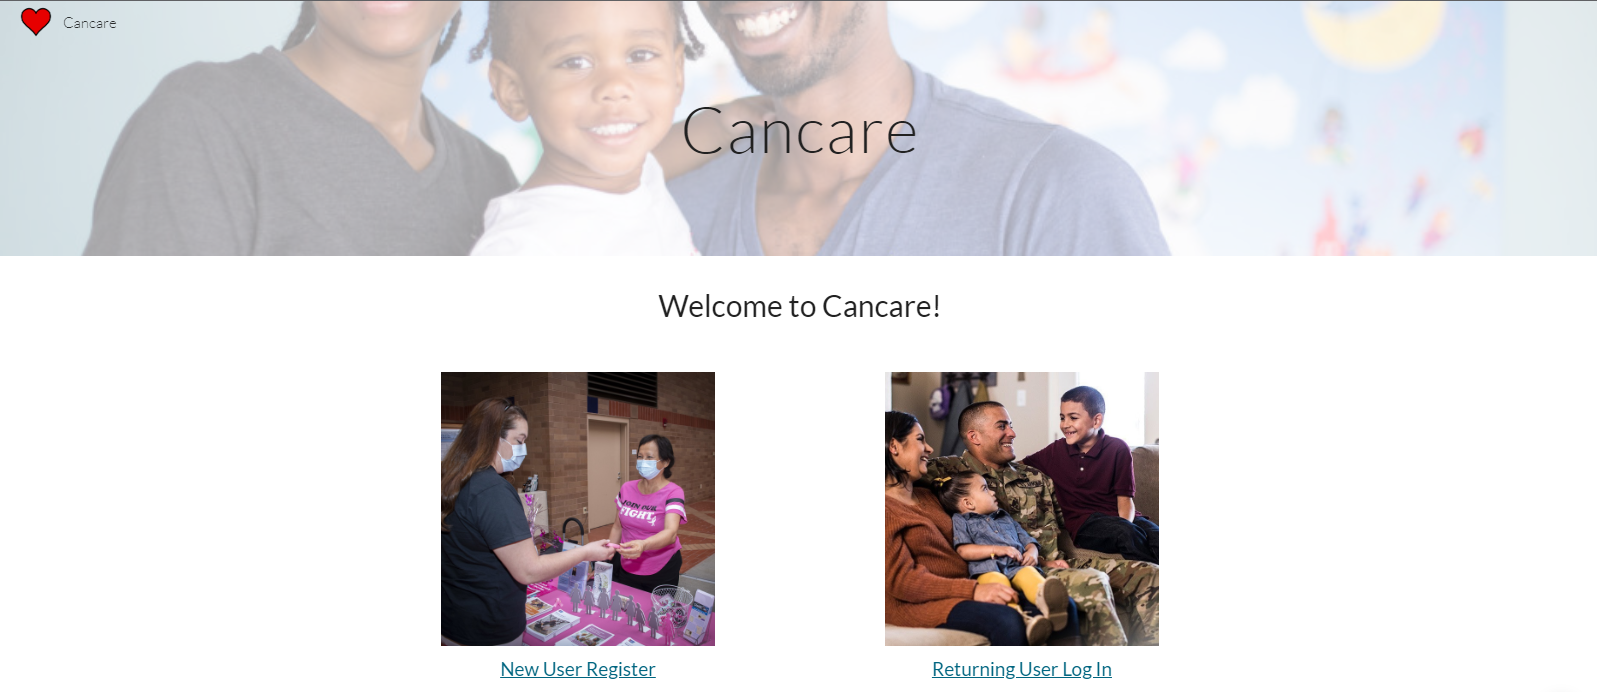
Website front page
-

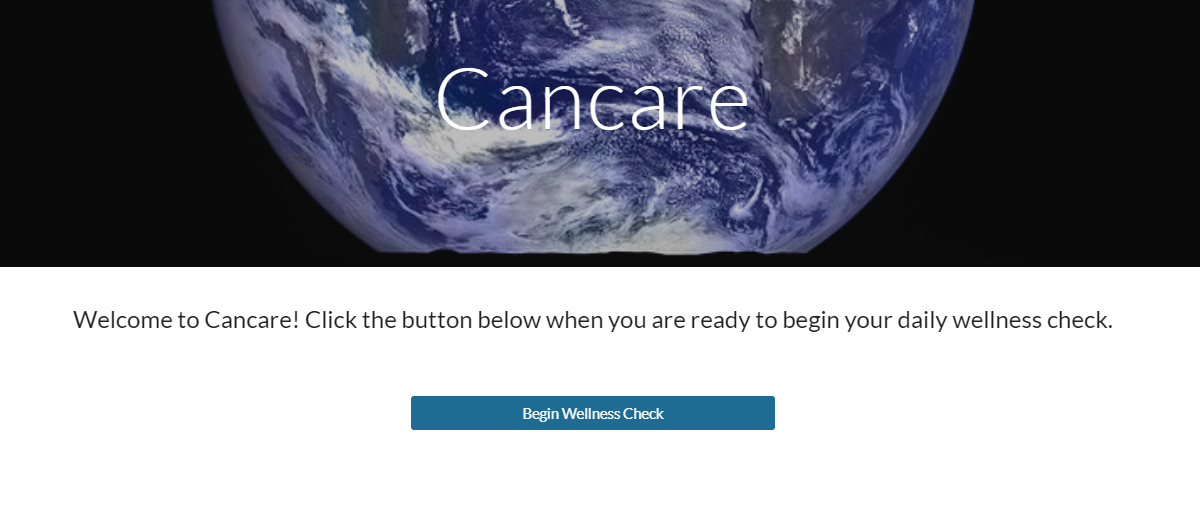
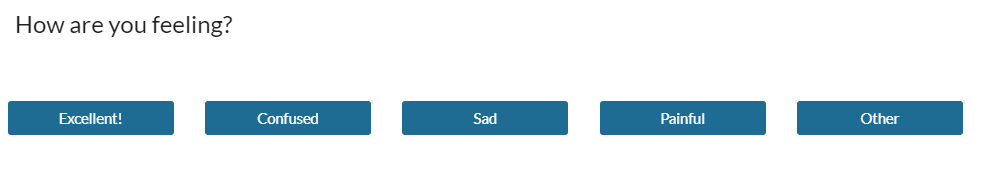
Wellness check input - User home page
-
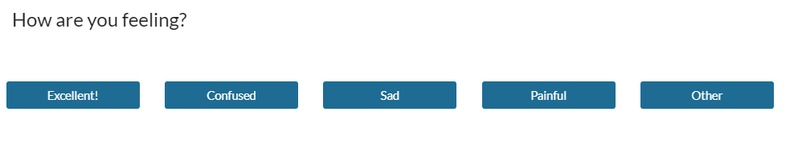
User self-reported emotion
-
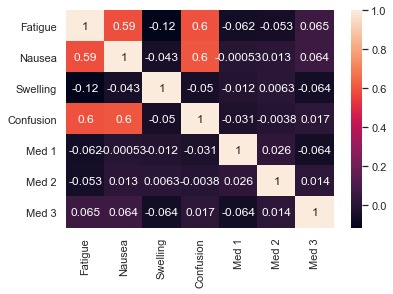
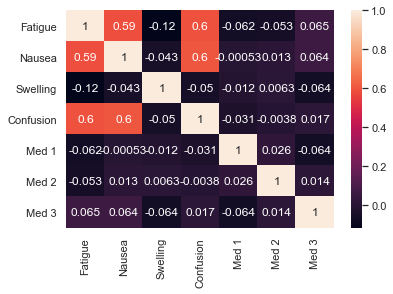
Correlation heatmap between medicines and symptoms, and symptoms and other symptoms
-
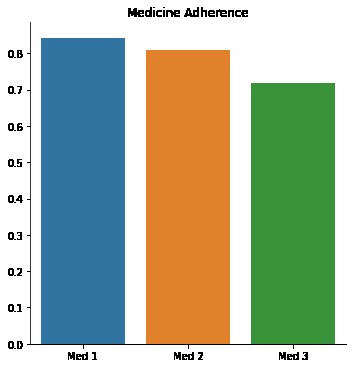
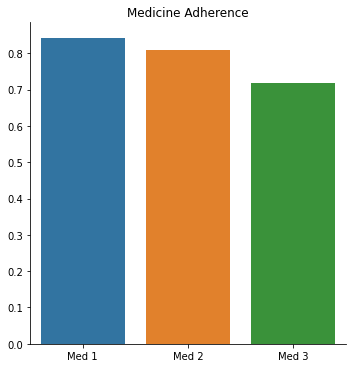
Univariate Analysis - Medicine Adherence
-
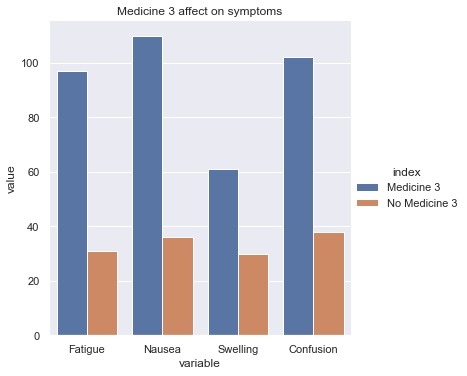
Bivariate Analysis - Missing or taking a medicine and its effect on symptoms experienced
-
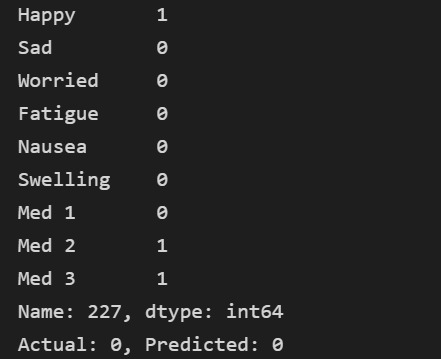
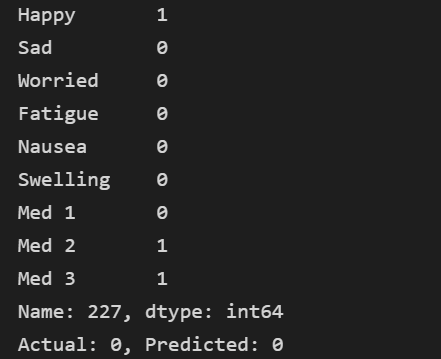
The Logistic Regression model predicting whether the patient will have confusion depending on the medications

Inspiration
Our main inspiration for this was a family friend who was a cancer patient. She would get anxious during doctor visits and would therefore have trouble reporting information about how she feels accurately. When patients meet the doctors, they will have to rely on the patient's memory of the past week and their ability to give detailed inputs on how their mental and physical health was since the last visit. Because many days have passed and the general anxiety of a visit is high, patients tend to give very generic or recent memories. Millions of cancer patients around the globe are suffering from the side effects of their medication. Cancer treatments often escalate the pain patients must endure because of their aggressive nature. Thus, we decided that doctors should be equipped with a mechanism to effectively monitor the side effects and symptoms their patients experience and the patients should have a reliable way to communicate how they are feeling to the doctor.
What it does
This website allows patients to record how they are feeling at various points during the day. The backend analyzes their inputs and correlates them with medications taken and builds a predictive model which can be used by doctors to understand the exact cause of the patient's side effects and emotions and prescribe accordingly. It can also provide descriptive statistics around medication adherence, emotional status, and side effect correlations with medicines. Doctors can use this website to see beyond the statistics of each medication and get a holistic view of how each treatment is affecting the patient's personal quality of life.
How we built it
The front end is built using google sites. The data collected from the easy-to-use front end can be transformed into a pandas data frame. Univariate and bivariate analysis has been done using pandas. Also, a logistic regression model was built using scikit-learn and numpy. Further, a multilayer perception neural network (MLP) has also been developed using pytorch which can predict how the patient will feel after being given certain medications. Seaborn is used for beautiful data visualizations.
Challenges we ran into
Overall, this project certainly had many enormous roadblocks. The primary roadblock was the dataset required to build the statistical and ML models for this project. While we generated a good set of hypotheses, testing these would require weeks of actual user data. Since we could not access this in the 2 days of time provided, we instead generated random mock-up data using Excel with correlations for the computer to train off of. This proved as a proof of concept that after being provided with real user data, our models can be retrained.
Our second challenge was integration. Given the multitude of technologies used, as of now, we have not integrated the backend with the front end. While we originally planned to develop using flutter, we just did not have enough time and experience and after hitting several dead-ends had to start completely anew Saturday night. However, despite this, we decided to persevere and switched our framework to google sites. We now have a fully functional example site along with a fully functional backend too.
Ideally, we would also like to be able to capture human data like blood pressure, steps, or other activity like sleep and use those in our model. As of now, we are relying on self-reported data.
Accomplishments that we're proud of
- The complete backend analytical tool that can provide descriptive, inquisitive, predictive, and prescriptive analysis for doctors to get a complete picture of patient health. The analytical possibilities for this project are nearly endless.
- The dataset we produced in-house for our models to train on
- A user-centric and extremely simplistic user interface which creates very low overhead for patients to self-report information
- Clean and simple visualizations that do not have unnecessary clutter so doctors can effortlessly extract the information they require
- Identifying and providing a solution for a reality millions of cancer patients face around the world
What we learned
We have developed a working understanding of several front-end and back-end technologies that we've never used before, like Flutter, ReactJS, scikit-learn, seaborn, firebase, etc. We also gained an appreciation for the challenges involved in integrating multiple technologies and the need to pick the right instruments for your job. We also learned about the wide variety of symptoms and side effects cancer patients must encounter in their daily lives. It suffices to say that cancer patients are among the bravest and most resilient our world has to offer and any progress to assist them in their journey is fantastic.
What's next for Cancare
Ideally, we want to move back from Google sites to ReactJS or Flutter for more native support on Android and iOS. We think the next step for Cancare is to completely integrate the front-end and back-end along with firebase authentication so we can personally train the algorithm for each patient on their own mobile devices. Next, we hope to connect to APIs of fitness apps on patients' phones or FitBits so we can use measured data about their physical activity. Finally, we can continue to fine-tune our machine-learning algorithms across anonymized user-collected data once we address HIPAA regulations.
Built With
- dart
- excel
- firebase
- google-sites
- html
- jupyter-notebook
- numpy
- pandas
- python
- pytorch
- scikit-learn


Log in or sign up for Devpost to join the conversation.