-

Logo
-
Main Dashboard

Inspiration
Global supply chains do not snap without warning; they fracture slowly. By the moment a retailer’s inventory system flags a stockout, the shelves are already bare and consumer panic has set in. The physical reality of a shortage is merely the final, lagging symptom of a collapse that began days earlier.
We realised that there is a consistent precursor to every major shortage: human anxiety.
Before a shelf is stripped, thousands of people turn to Google to ask, "is baby formula running out?" or "why are there no eggs?" We built Canary to quantify this invisible layer of the global supply chain. Our objective was not simply to visualise search volume, which is often just noise, but to mathematically isolate the velocity of panic. Canary acts as a seismograph for market sentiment, detecting the digital tremors of a shortage 48 to 72 hours before it manifests physically.
What it does
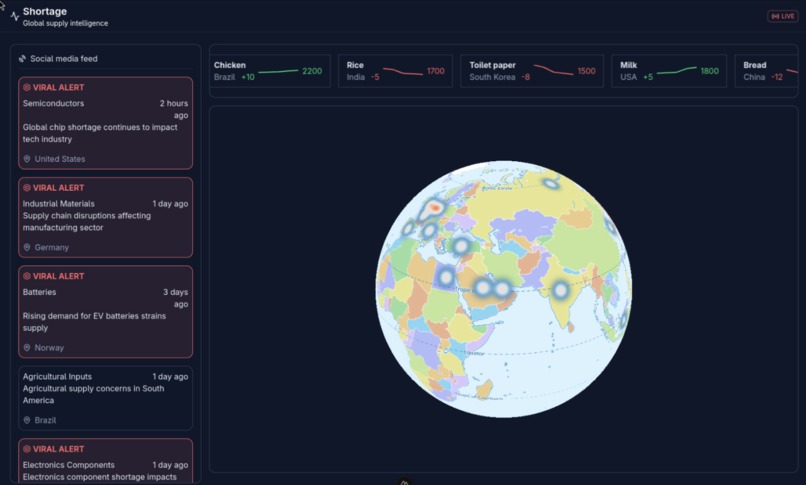
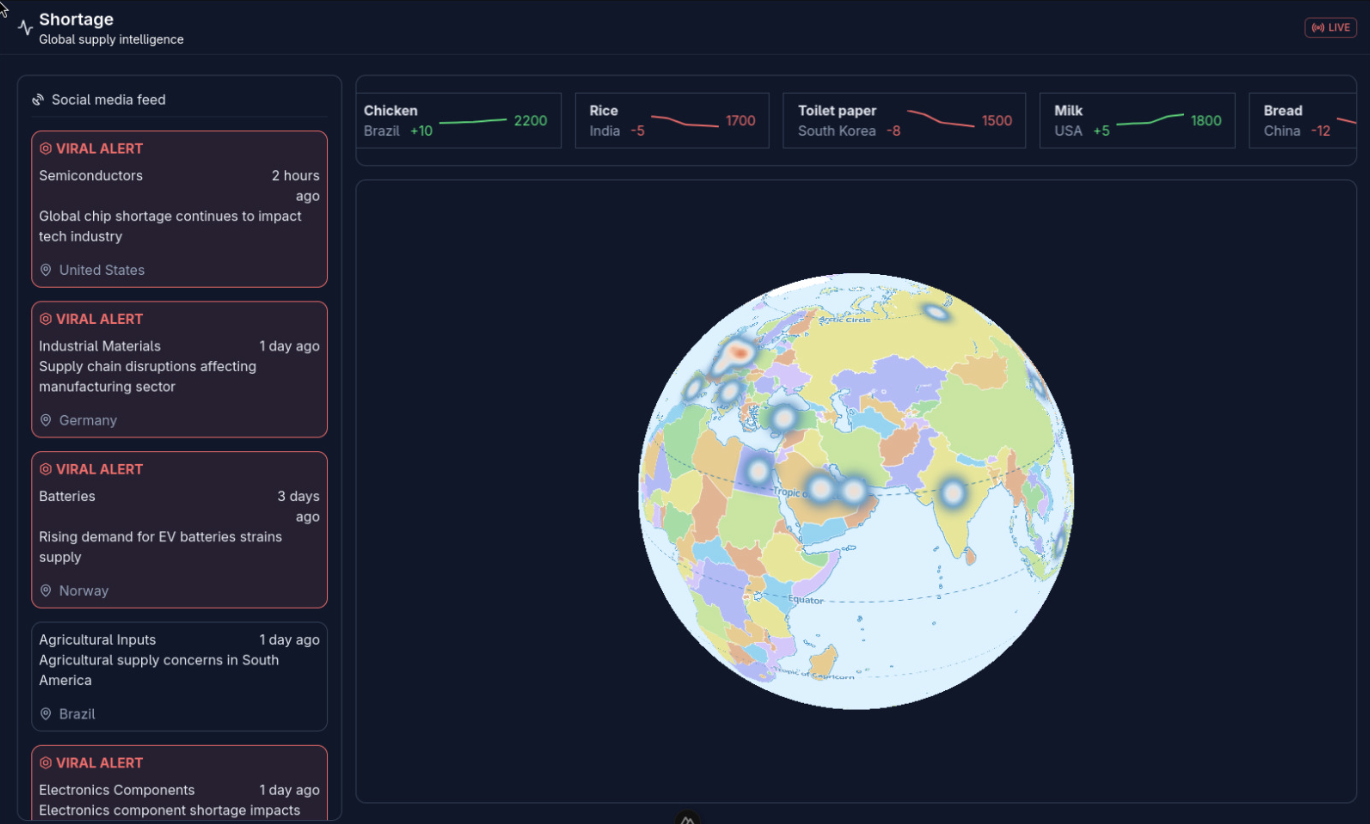
Canary is a real-time early warning system for global supply chain resilience. It ingests high-frequency search and sentiment data to detect anomalies in consumer demand.
Unlike traditional analytics that track what has happened (sales data), Canary tracks what is about to happen. It distinguishes between standard seasonal demand and irrational panic buying by analysing the acceleration of interest. When the system detects a "confirmed" panic streak, it issues alerts to retailers and government bodies, allowing them to ration stock or adjust logistics before the stockpile is depleted.
How we built it
We rejected the industry standard of static dashboards that refresh daily. True supply chain resilience requires a real-time signal processor capable of ingesting global data streams with zero latency.
We engineered the core detection engine in Rust. This was a strategic choice for memory safety and zero-cost abstractions, allowing us to build a pure Unix-style streaming architecture. The system reads live NDJSON records from stdin, updates complex statistical state in-memory, and emits severity alerts to stdout.
Once a signal for potential panic buying has been captured by the Rust engine, the data is sent to a neural network - developed with PyTorch. This model then produces a confidence score representing how likely the signal is to represent the start of a potential panic event.
The Mathematics of Panic
A fundamental flaw in many anomaly detection systems is the assumption of a Normal (Gaussian) distribution. Panic buying is not Normal; it is fat-tailed and explosive. Using standard deviation (Z-scores) would trigger false positives on every minor fluctuation.
Instead, we implemented Robust Statistics. We track the signal baseline using the Median and the Median Absolute Deviation (MAD), which renders the engine resilient to outliers:
$$\text{MAD} = \text{median}(|x_i - \tilde{x}|)$$
We do not merely analyse the raw volume ($y$). The engine computes the physics of the trend in real-time using discrete derivatives to isolate the Acceleration of Anxiety ($\Delta\Delta$).
Velocity ($\Delta$): Is the search volume growing? $$\Delta_t = y_t - y_{t-1}$$
Acceleration ($\Delta\Delta$): Is the panic exploding? $$\Delta\Delta_t = \Delta_t - \Delta_{t-1}$$
The Rust engine calculates a Robust Z-Score for this acceleration. If the acceleration deviates significantly from the baseline volatility, Canary triggers an alert.
$$Z_{score} = \frac{\Delta\Delta_t - \text{median}(\Delta\Delta)}{k \cdot \text{MAD}}$$
Challenges we ran into
The most significant technical hurdle was the "Zero Problem."
Real-world search data is incredibly sparse. For niche items in smaller nations (such as searching for "canned tuna" in the Netherlands), search volume can flatline at zero for hours. Mathematically, when the MAD is 0, any subsequent search volume (even a single query) creates an infinite Z-score (division by zero). This caused early iterations of our model to hallucinate crises during quiet hours.
We solved this by implementing a variance floor within the Rust logic (the mad_floor parameter). This enforces a minimum volatility threshold, effectively instructing the system to ignore micro-fluctuations unless they breach a specific magnitude. This prevents numerical instability while maintaining high sensitivity to genuine spikes.
The neural network uses a hybrid DistilBERT-LSTM architecture to forecast supply-chain volatility. We transform raw social media text posts into 768-dimensional embeddings, fused with engagement metadata to create a multi-channel time series. These sequences are processed by a Stacked LSTM designed to detect non-linear patterns across a seven-day sliding window. To handle the rarity of panic events, we employed Weighted BCE Loss and optimized the pipeline for MPS acceleration, enabling the model to predict "panic peaks" with up to a one week leave time.
Accomplishments that we're proud of
- The Physics of Panic: We successfully modelled human anxiety as a physical force with velocity and acceleration, creating a derivative-based metric that is far more predictive than raw volume.
- High-Fidelity Simulation: We reconstructed the entire 2020 COVID-19 panic timeline (Feb–March) hourly, validating our engine against the real-world timeline of the "toilet paper crisis" across the UK, US, and Italy.
- Rust Architecture: Building a stateful streaming engine that maintains rolling windows and recomputes baselines in real-time without memory leaks or performance degradation.
- High Peformance Model: Backtesting our model on the previously mentioned timeframe, the model was able to predict the shortage a full week before the first mainstream media outlet picked up the story.
What we learned
- Rust is the superior tool for data engineering. The strict type system forced us to handle edge cases, such as
Option<NaiveDate>for baseline rebuilds, that Python would have allowed to pass until runtime failure. - Smoothing is a delicate balance. We utilised an EWMA (Exponentially Weighted Moving Average) with an alpha of 0.30. This proved to be the optimal trade-off: reactive enough to catch a flash crash, but robust enough to ignore transient data glitches.
- Digital signals precede physical reality. Our backtesting confirms a consistent latency where search intensity peaks 24 to 72 hours before confirmed news reports of shortages. The data speaks before the market does.
What's next for Canary
We intend to bridge the gap between digital signals and physical logistics. The next phase involves integrating Live Retailer APIs to correlate our "anxiety index" with actual stock levels. This would allow Canary to not only predict when a shortage will occur but automatically trigger supply orders to the affected regions, closing the loop between prediction and prevention.

Log in or sign up for Devpost to join the conversation.