Our Inspiration
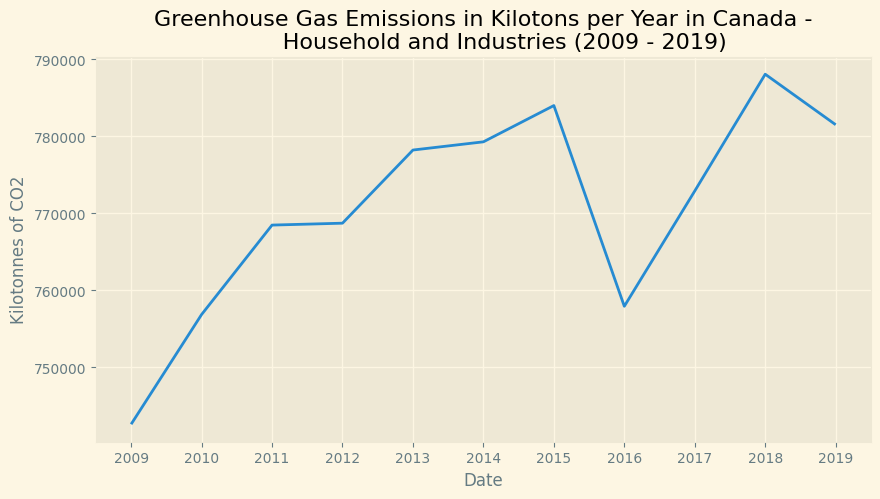
Looking at the amount of CO2 emitted by Canadian citizens, we realized that bigger companies, especially in the Energy Industries, were doing most of the polluting, compared to the whole country.
STORY!
Too often individual Canadians are put as the sole responsible for the country's greenhouse gas emissions, but is it right? The figures highlighting the country's emissions often do so by capita, while including the emissions produced by some of the most damaging industries, ultimately hiding the true culprits behind Canada's population.
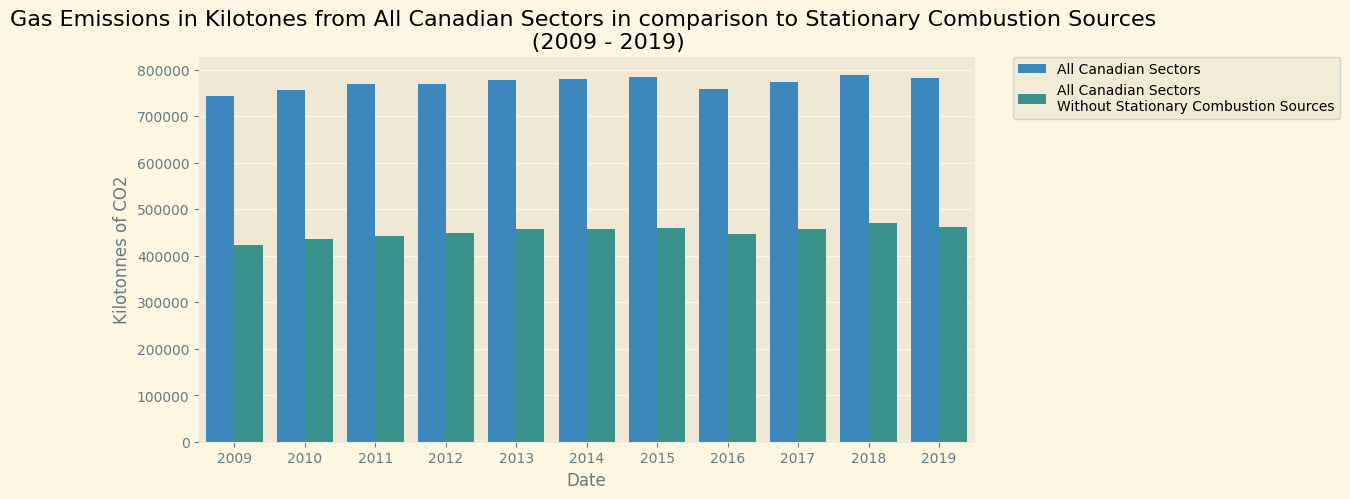
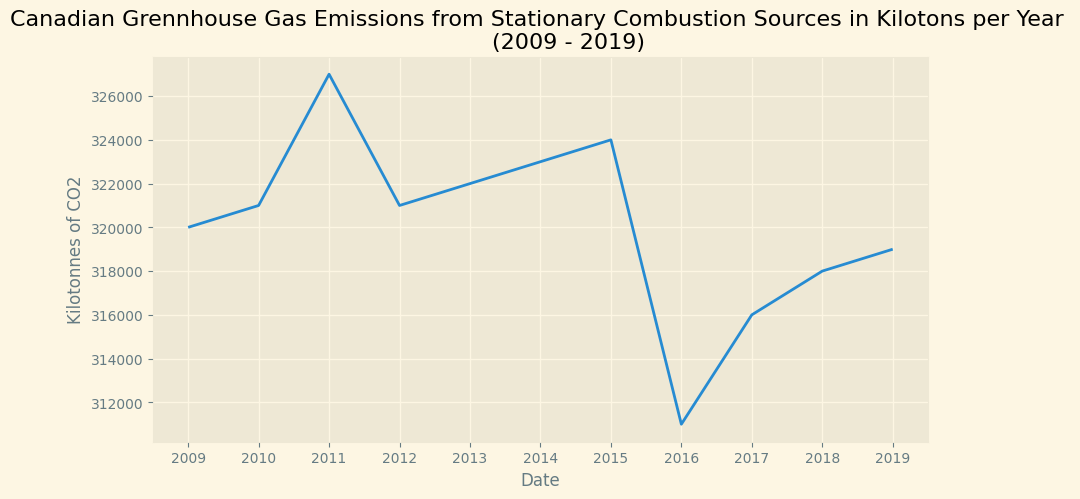
By highlighting the impact of specific industries, we are able to see who is really to blame. Under consideration of the data, we urge Canadians to focus their efforts on putting pressure on the most harmful industries in society. By subtracting the outputs of the most notoriously polluting industries, we were able to identify the actual impact of individual behaviors, and where efforts should be focused.
We hope to spark conversation about the importance of holding industries responsible for their impact on the environment and the need for government regulation to regulate them. Citizens should be calling for stricter laws and for companies to be held accountable for their emissions.
While individual actions are still important in reducing emissions, the data highlight the need for a more holistic approach to tackling Canada's emissions problem. Real progress can be made towards a cleaner and more sustainable future by focusing on the most harmful industries.
Behind the story: Our Data Analysis
What are your data sources?
NATIONAL INVENTORY REPORT 1990 –2019: GREENHOUSE GAS SOURCES AND SINKS IN CANADA
https://publications.gc.ca/collections/collection_2021/eccc/En81-4-2019-3-eng.pdf
Physical flow accounts for greenhouse gas emissions
Oil Prices - Price per barrel of WCS oil in US dollars.
https://economicdashboard.alberta.ca/oilprice
What did you do with the data?
We took all the data as CSV files and reformatted it using panda's library from python to create tables with the right information and label. We then used the library seaborn, which comes from matplotlib, to draw and edit graphs from our formatted data.
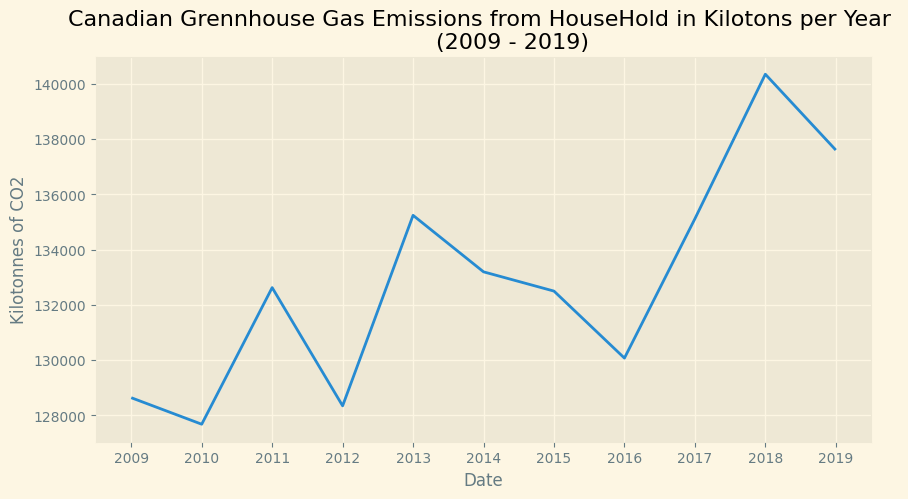
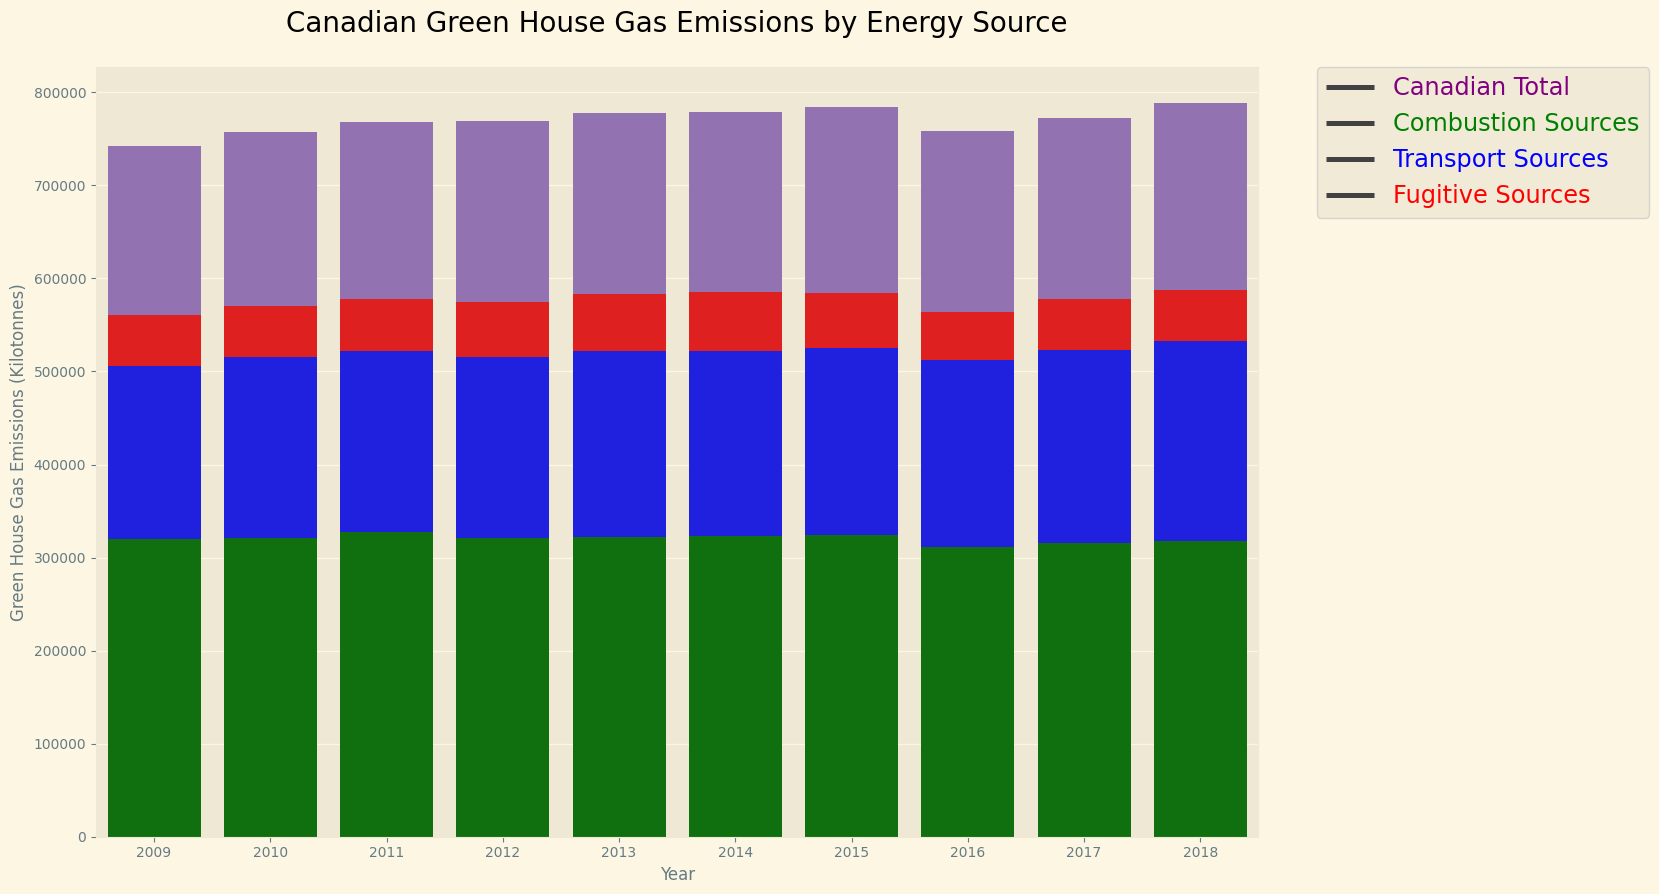
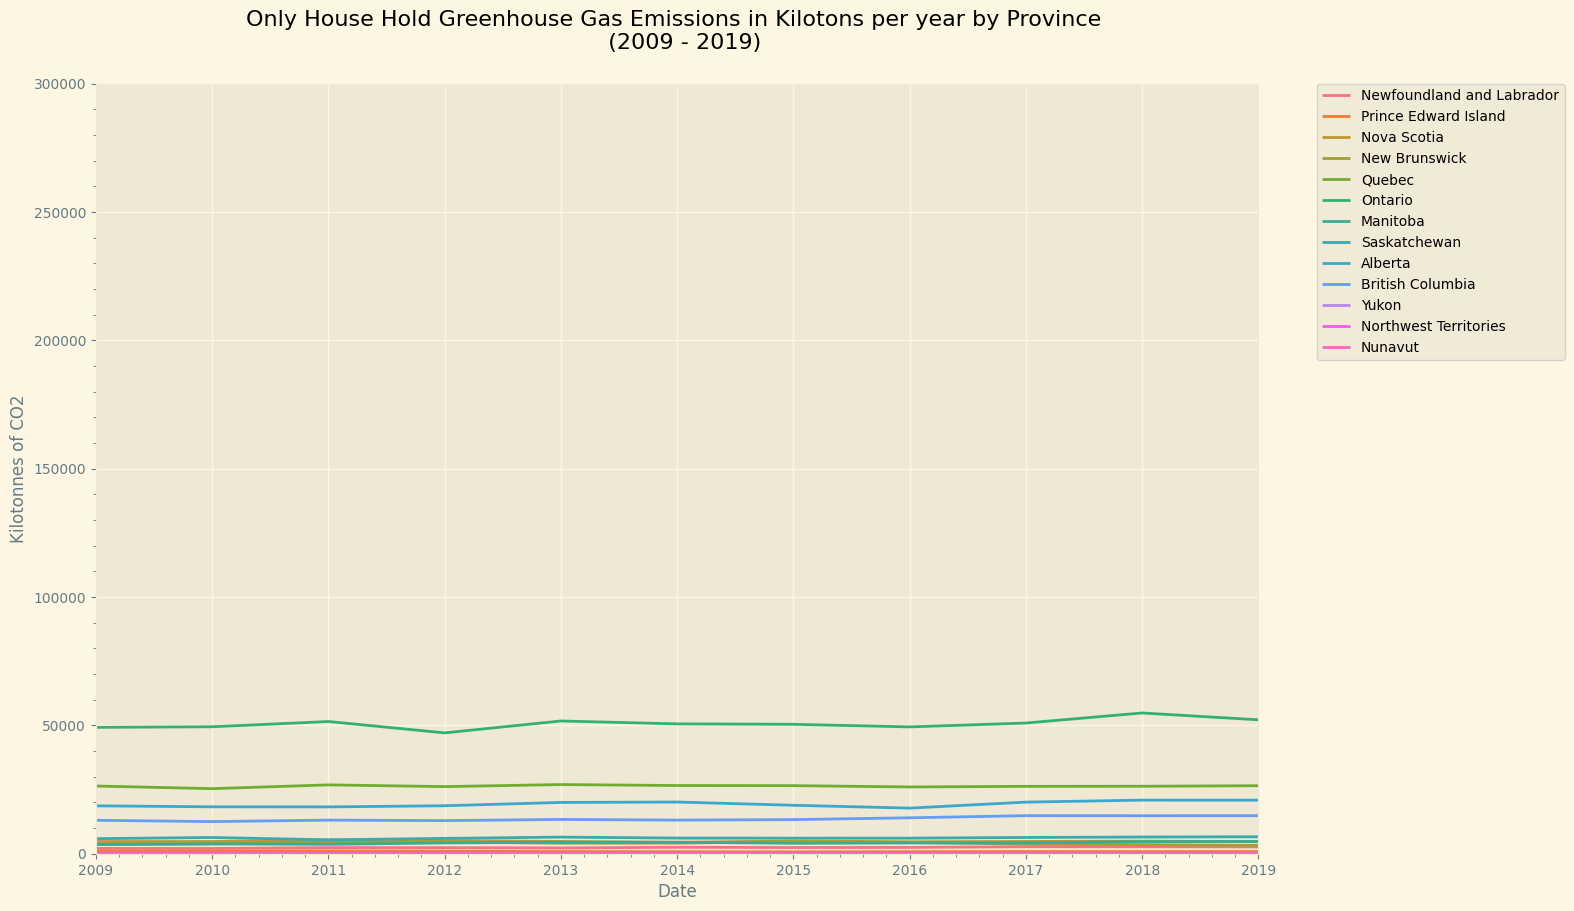
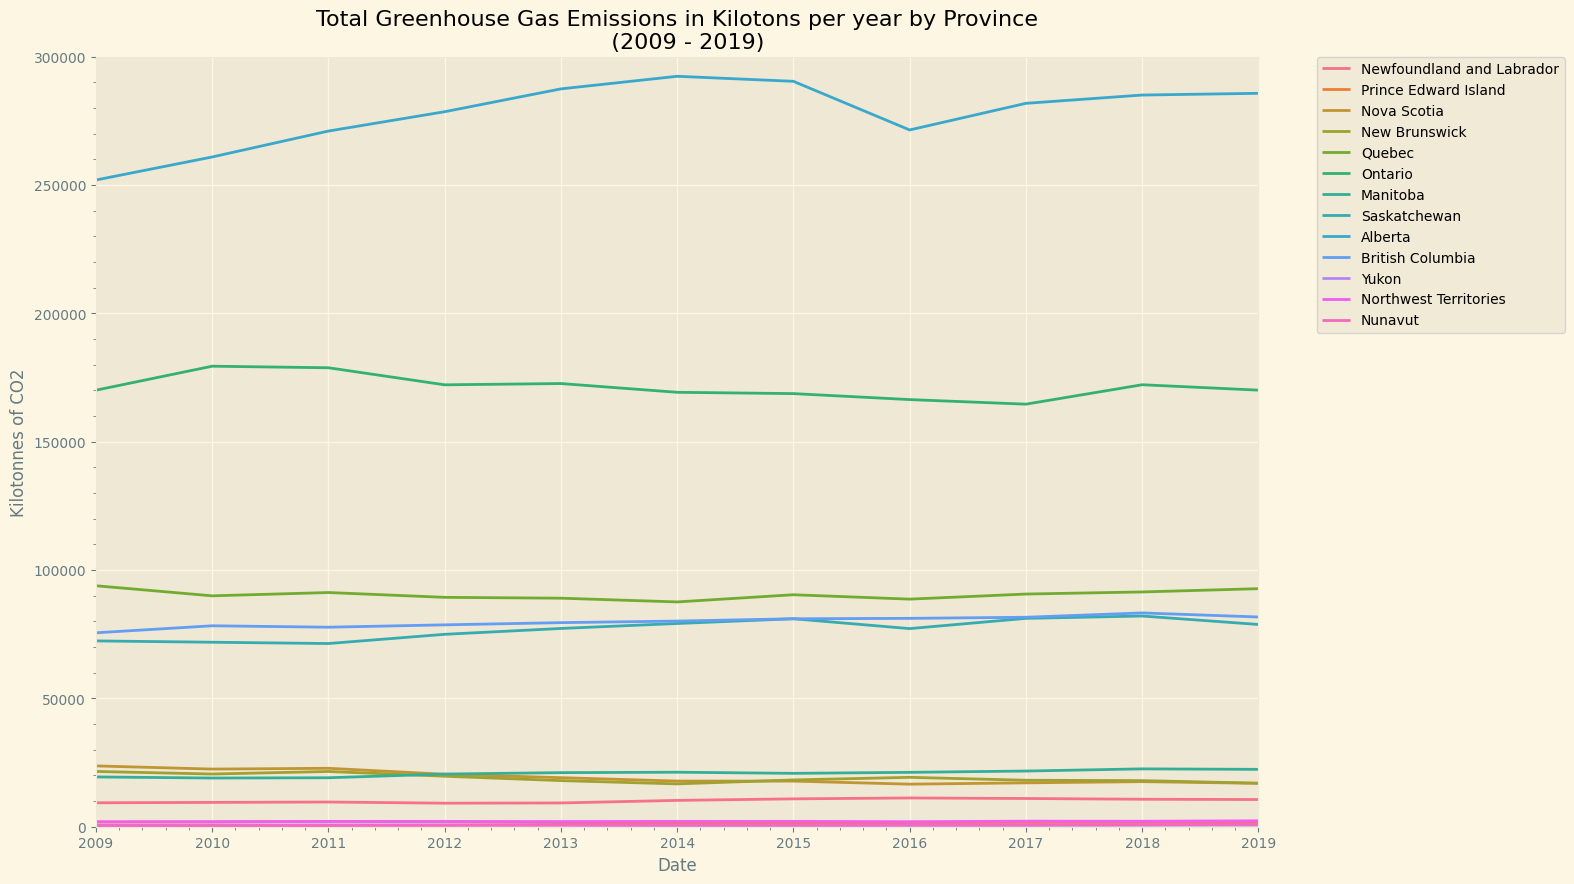
We focused on the difference between the total emitted from the industries and the total emitted from households (in Canada and each province) and compared the different results.
We also got data from the different industry sectors and compared each of them, stressing the inequalities between the different emitters and how a few of them are responsible for most of the emissions.
OPTIONAL: What we learned:
Technically speaking we learned:
- How to use pandas, seaborn, and matplotlib.pyplot python libraries.
- Project and time management skills.
- Using google collabs, especially for merge conflicts.
Regarding Carbon Emissions.
- Data on CO2 Emission can be deceiving at first glance
- A few industries are responsible for most of the emissions in Canada
- Alberta is the biggest emitter of CO2 in Canada.
Built With
- pandas
- powerpoint
- python
- seaborn


Log in or sign up for Devpost to join the conversation.