-
Climate of canada's various Regions

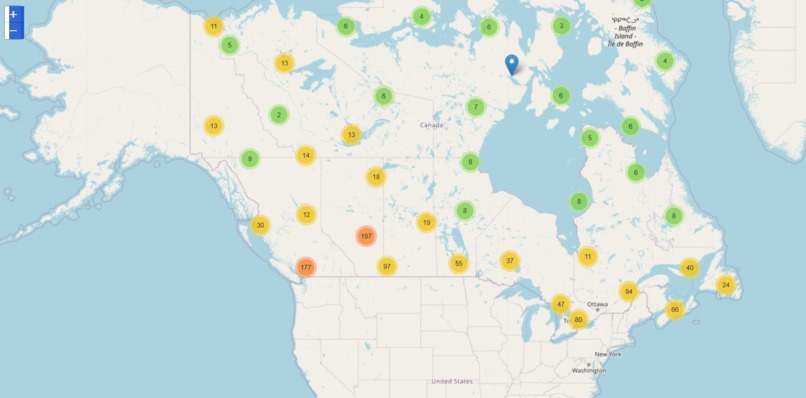
What it does - The data visualization project uses the folium library to create an interactive map. Each weather station is represented by a marker on the map, and clicking on a marker displays a popup with information such as the station name, maximum temperature (Tx), minimum temperature (Tn), and precipitation (P). The use of Marker Clusters enhances the visualization, especially in regions with multiple weather stations.
How I built it - The project uses Python and leverages the capabilities of the panda's library for data manipulation, Geo pandas for handling geographic data, and folium for creating interactive maps. The process involves loading the climate data from the provided CSV file, creating a Geodata Frame to handle spatial data, and then using folium to visualize the data on an interactive map.
Challenges I ran into - One of the challenges encountered was ensuring a clear and informative visualization. Adjustments were made to the plot size, color map, and font size to address crowding and overlapping issues. Additionally, incorporating interactivity and saving the map as an image required the use of external libraries such as selenium and Pillow.
Accomplishments that I'm proud of - I successfully created an interactive map that allows users to explore climate data for different Canadian regions. The inclusion of Marker Clusters and the ability to save the map as both an interactive HTML file and a static image contribute to a versatile and user-friendly visualization.
What I learned - Through this project, we learned about the integration of various Python libraries for handling and visualizing geographic and climate data. Working with folium for interactive mapping, dealing with spatial data using Geo pandas, and overcoming challenges related to visualization enhanced our skills in data science and visualization.
What's next for Canada Climate-2023 - The current visualization provides a snapshot of climate data for 2023. Moving forward, enhancements could include the incorporation of additional variables, temporal analysis, and the development of more advanced visualizations to gain deeper insights into Canadian climate patterns. Further collaboration and exploration of emerging technologies in data visualization may also be considered for future iterations of the project.
Built With
- folium
- geopandas
- html
- markercluster
- pandas:

Log in or sign up for Devpost to join the conversation.