-
Campus_Energy_360_System_Design
-
Campus_Energy_360_Financial_Model
Inspiration - Every university CFO faces the same dilemma: energy costs keep climbing, infrastructure keeps aging, and the capital budget never stretches far enough. The question is never whether to invest in energy efficiency — it is where to invest first, how much to commit to each initiative, and how to prove the return to leadership before a single dollar is spent.
What struck me most about this challenge was not the technical complexity, it was the strategic complexity. A $12M budget sounds significant until you realize it has to cover dozens of buildings, competing priorities, short-term operational needs, and long-term sustainability commitments simultaneously. Most universities approach this with gut instinct and vendor proposals. Very few approach it the way a portfolio manager would with a structured scoring framework, a rigorous cost-benefit model, and a phased roadmap that balances risk against return.
My background as a Senior Business Analyst at Angel One, India's largest fintech trading platform, gave me a specific lens for this problem. In financial services, we never allocate capital without first scoring the risk, quantifying the return, and stress-testing the assumptions. Campus energy investment deserves exactly the same discipline.
"What if every campus building had a financial health score the way every borrower has a credit score, so that capital flows automatically to where it creates the most value?"
That question became CampusEnergy360. My time at Syracuse University's iSchool, home to the Smart Grid Research Center backed by over $1.1M in federal research funding on campus energy analytics, reinforced that this is not a new idea — it is simply an idea that has never been packaged into a decision-ready business tool.
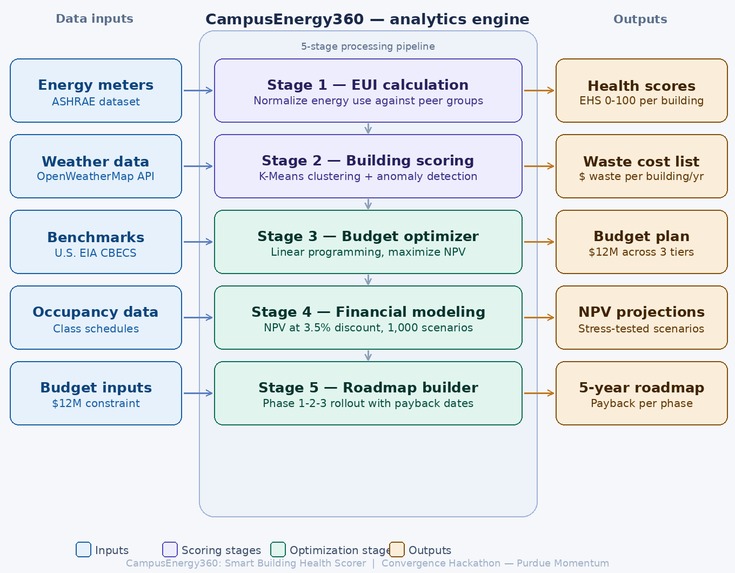
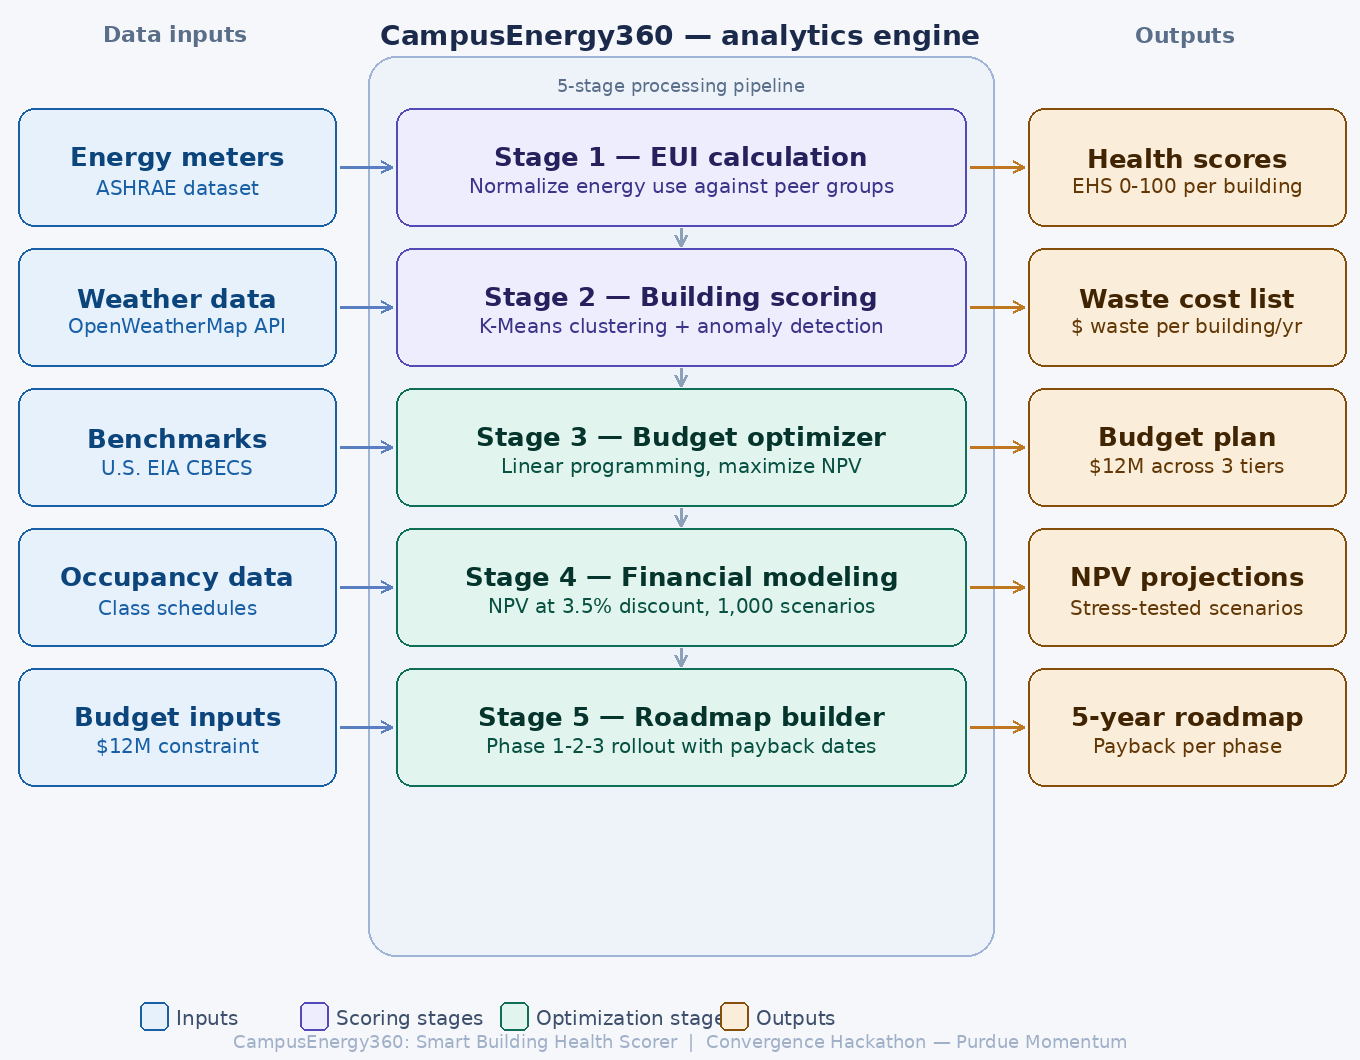
What it does - CampusEnergy360 is a strategic energy investment platform built around one core business problem: how do you allocate a fixed capital budget across dozens of campus buildings to maximize financial return and operational impact?
The platform delivers four things a university leadership team can act on immediately:
A Building Health Score (0–100) for every facility Every building is evaluated against its peers and assigned a score reflecting how efficiently it uses energy relative to what it should be using. Think of it as a credit score for buildings a single number that summarizes dozens of underlying signals and tells a decision-maker exactly where to focus attention first.
A prioritized list of inefficiencies with dollar values attached Rather than presenting a list of problems, the platform quantifies each inefficiency in annual dollar terms, turning vague observations like "this building uses too much energy" into precise business statements like "this building is wasting $187,000 per year against its peer benchmark."
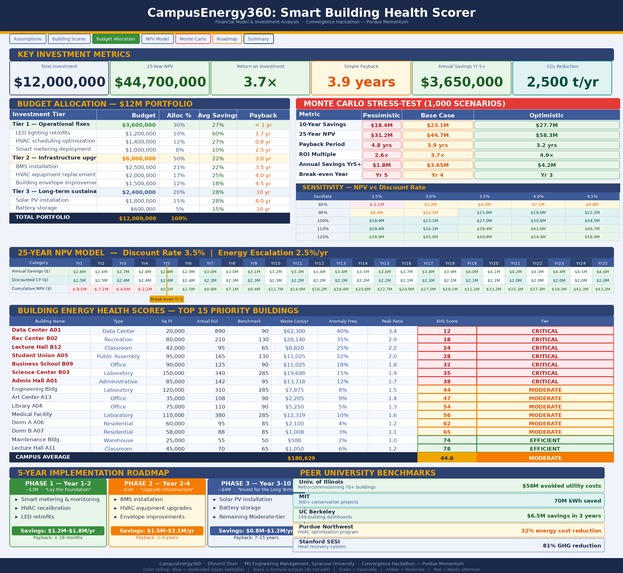
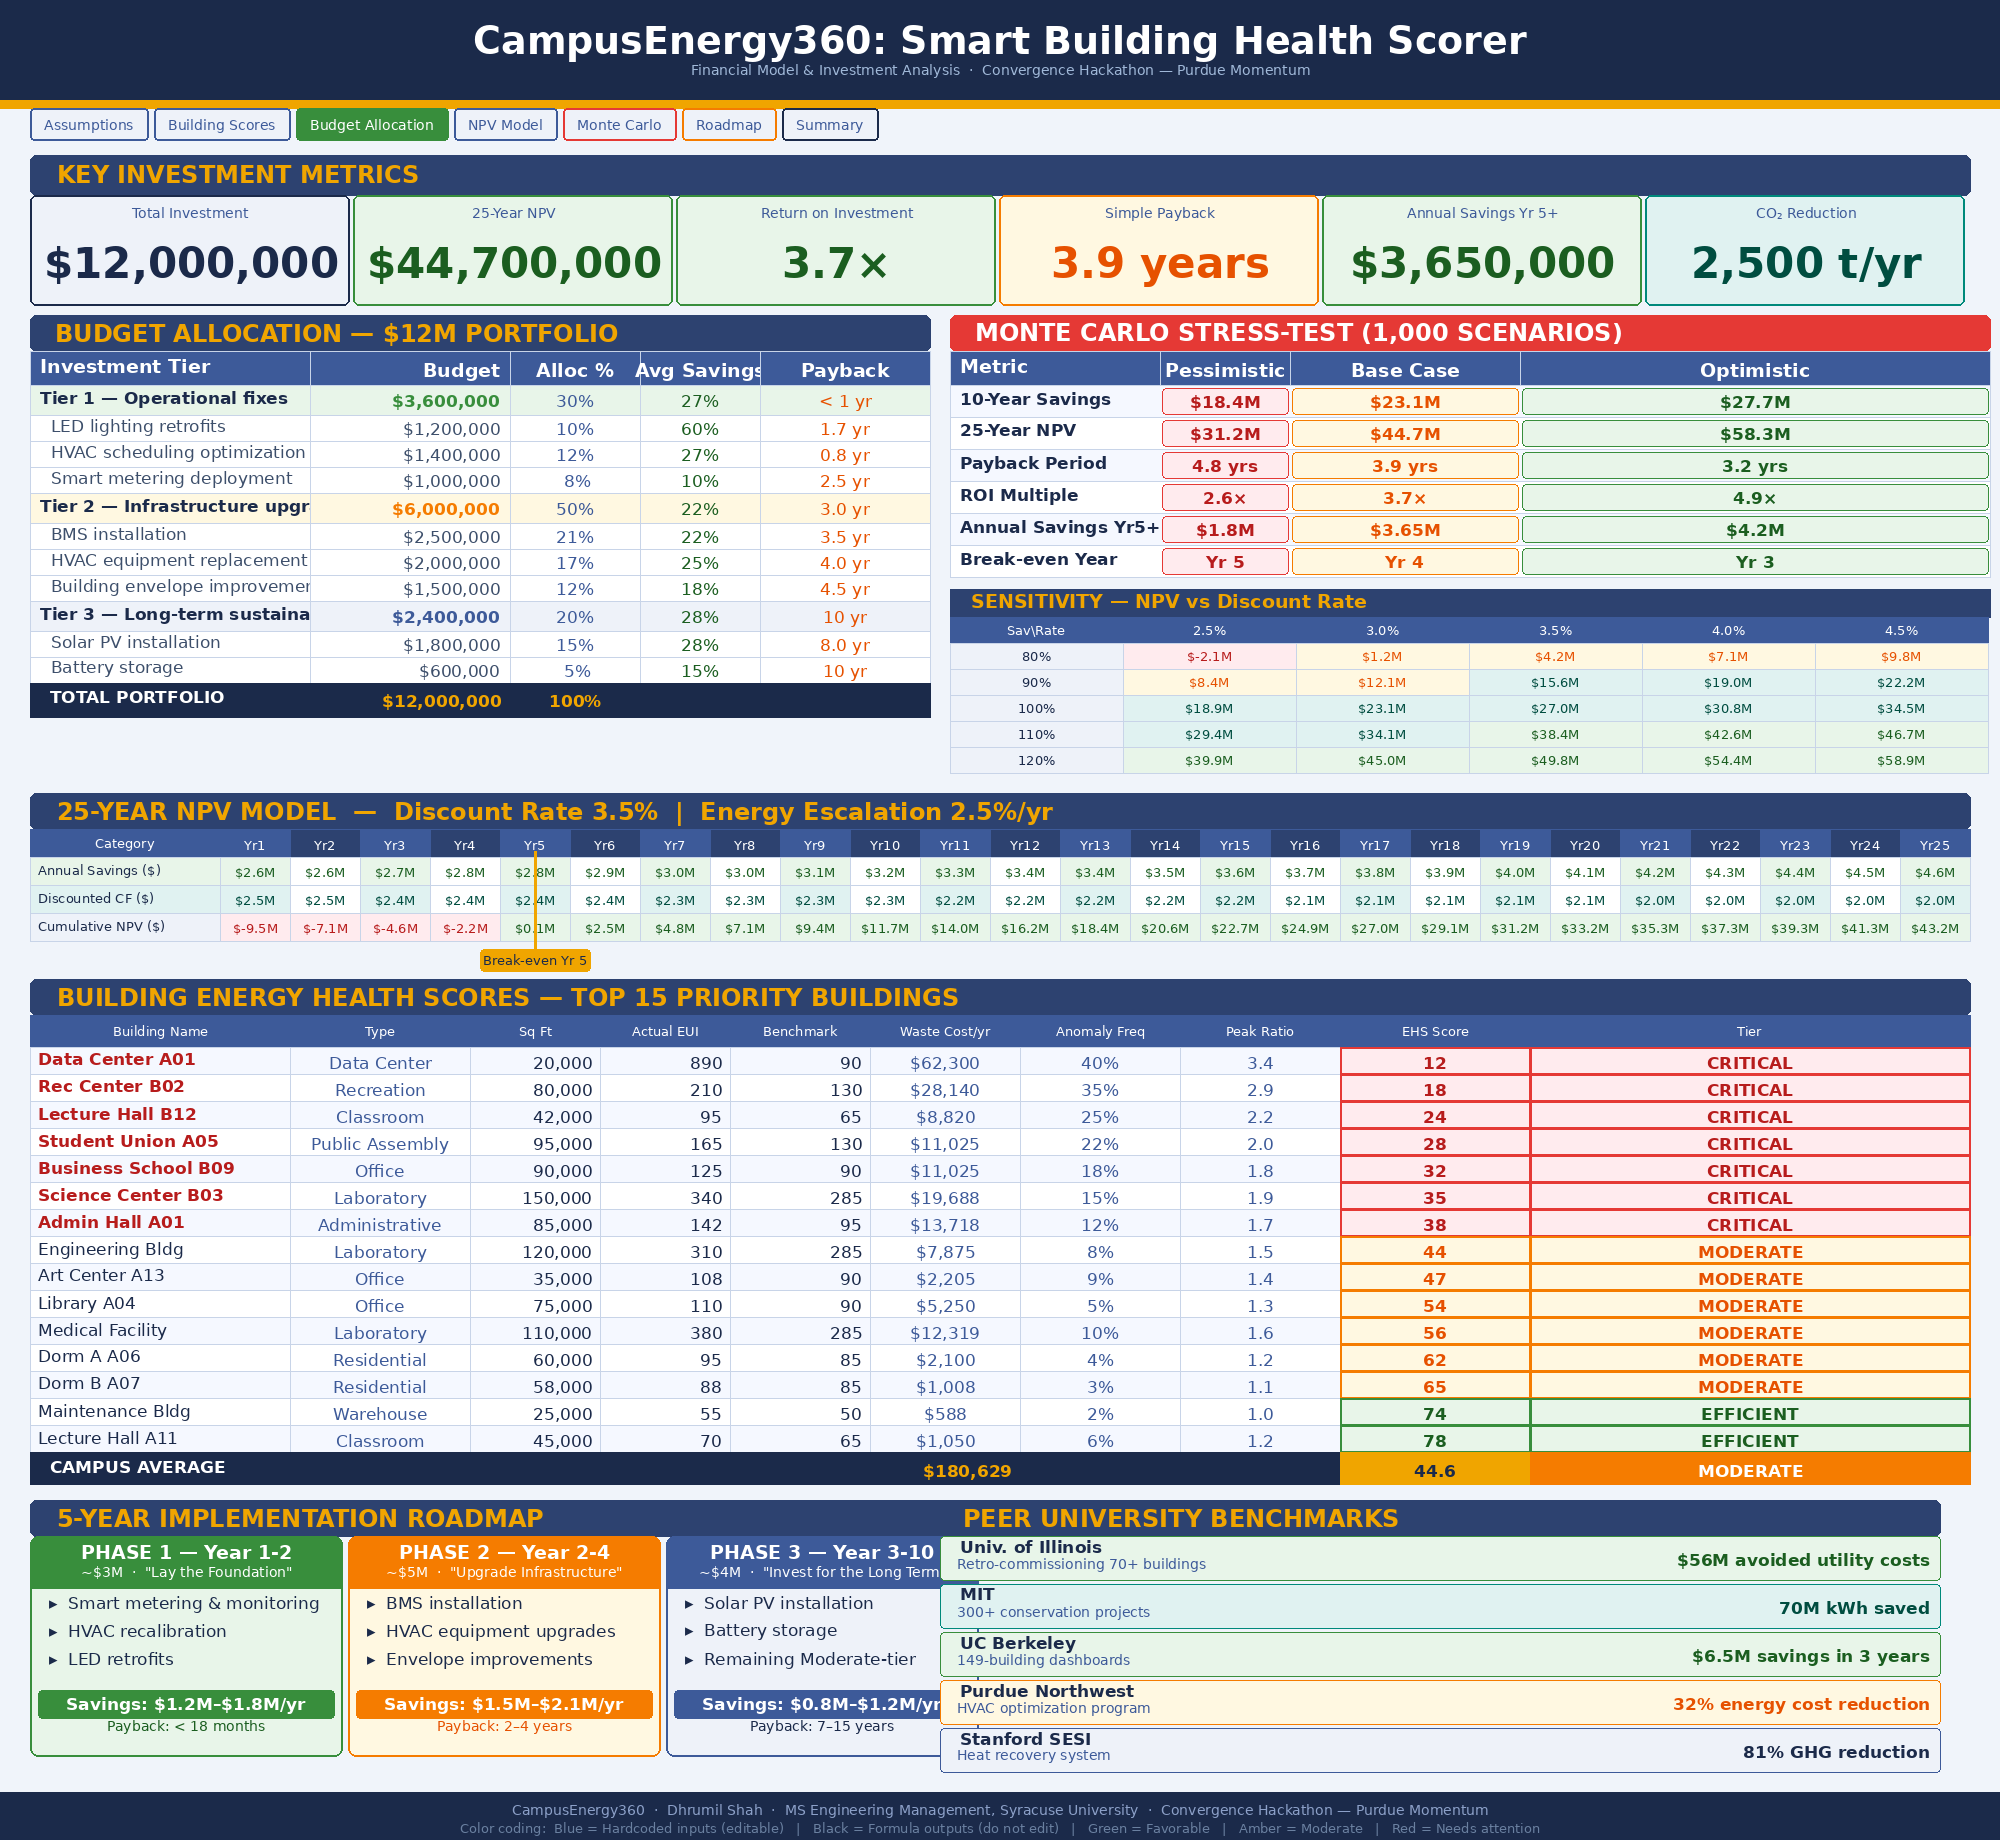
An optimized $12M capital allocation plan A structured budget model distributes the $12M across three investment tiers quick operational fixes, infrastructure upgrades, and long-term renewable investments, maximizing total Net Present Value over 25 years while ensuring the portfolio is balanced between short-term payback and long-term sustainability commitments.
A phased 5-year implementation roadmap Every recommendation comes with a projected payback period, annual savings figure, and implementation priority, giving facilities leadership a boardroom-ready investment proposal, not just a list of ideas.
How we built it - The entire approach was built around one discipline: treating campus energy as a portfolio of financial assets, each with a measurable cost, a measurable return, and a risk profile that can be stress-tested.
Step 1 — Establishing the Baseline: What Should Each Building Be Spending? The first challenge in any cost-reduction strategy is knowing what "normal" looks like. You cannot identify waste without a credible benchmark.
We established benchmarks by category, classroom buildings, research facilities, administrative offices, residence halls, recreational facilities, using nationally recognized U.S. government standards. Each building's actual energy spend is then measured against its category benchmark to produce a relative efficiency gap, expressed in both energy units and annual dollars. Efficiency Gap ($)=(Actual Spend−Benchmark Spend)×Annual Operating Days\text{Efficiency Gap (\$)} = (\text{Actual Spend} - \text{Benchmark Spend}) \times \text{Annual Operating Days}Efficiency Gap ($)=(Actual Spend−Benchmark Spend)×Annual Operating Days This immediately answers the CFO's first question: "Which buildings are costing us the most relative to what they should cost?"
Step 2 — Scoring Every Building: The Energy Health Score Rather than presenting leadership with a 200-row spreadsheet of raw numbers, we synthesize the analysis into a single Energy Health Score (EHS) from 0 to 100: EHS=100−(w1⋅Efficiency Gap+w2⋅Waste Frequency+w3⋅Peak Cost Ratio)×100\text{EHS} = 100 - \left( w_1 \cdot \text{Efficiency Gap} + w_2 \cdot \text{Waste Frequency} + w_3 \cdot \text{Peak Cost Ratio} \right) \times 100EHS=100−(w1⋅Efficiency Gap+w2⋅Waste Frequency+w3⋅Peak Cost Ratio)×100 Where the three components are weighted as follows:
w1=0.50w_1 = 0.50 w1=0.50 — How far the building's costs are from its peer benchmark (the largest driver)
w2=0.30w_2 = 0.30 w2=0.30 — How often the building shows patterns consistent with known waste categories
w3=0.20w_3 = 0.20 w3=0.20 — How much the building contributes to peak demand charges on the utility bill
A score of 0–40 signals a building in the Critical tier an immediate priority for intervention. 41–65 is Moderate — a candidate for the second phase of investment. 66–100 is Efficient, maintain and monitor. This scoring framework gives leadership a language for prioritization that is immediately intuitive: fix the lowest-scoring buildings first, the same way a bank prioritizes its highest-risk loans.
Step 3 — Building the $12M Investment Portfolio With every building scored and ranked, the next question is: "How do we spend $12M to get the best return?"
The budget model then solves for the allocation that maximizes total Net Present Value across all three tiers over a 25-year horizon, subject to three constraints that reflect real university priorities: Maximize ∑NPVi⋅xiacross all investments\text{Maximize } \sum NPV_i \cdot x_i \quad \text{across all investments}Maximize ∑NPVi⋅xiacross all investments Subject to: Total spend≤$12M\text{Subject to: Total spend} \leq \$12\text{M}Subject to: Total spend≤$12M Tier 1 allocation≥30%(ensuring near-term operational impact)\text{Tier 1 allocation} \geq 30\% \quad \text{(ensuring near-term operational impact)}Tier 1 allocation≥30%(ensuring near-term operational impact) Tier 3 allocation≥20%(ensuring long-term sustainability commitment)\text{Tier 3 allocation} \geq 20\% \quad \text{(ensuring long-term sustainability commitment)}Tier 3 allocation≥20%(ensuring long-term sustainability commitment) NPV for each investment is calculated at a 3.5% discount rate consistent with public sector infrastructure investment standards — over a 25-year useful life: NPV=∑t=125Annual Savingst(1.035)t−Upfront Investment CostNPV = \sum_{t=1}^{25} \frac{\text{Annual Savings}_t}{(1.035)^t} - \text{Upfront Investment Cost}NPV=t=1∑25(1.035)tAnnual Savingst−Upfront Investment Cost
Step 4 — Stress-Testing the Financial Case No responsible investment proposal presents a single-point return estimate. Energy prices fluctuate. Savings realization varies. Construction costs change. We stress-tested the financial model by running 1,000 budget scenarios with energy prices and savings rates varying by ±20%, producing a range of outcomes rather than a single number: NPVrange=[NPVpessimistic, NPVexpected, NPVoptimistic]\text{NPV}{range} = [NPV{pessimistic},\ NPV_{expected},\ NPV_{optimistic}]NPVrange=[NPVpessimistic, NPVexpected, NPVoptimistic] This transforms the recommendation from "we expect to save $X" into "we are highly confident savings will fall between $X and $Y, with an expected value of $Z" — the kind of language a CFO trusts.
Step 5 — Generating the Roadmap The final output is a phased 5-year implementation roadmap that sequences investments by financial return, operational feasibility, and strategic priority:
Year 1–2 (~$3M): Operational fixes and smart monitoring across all Critical-tier buildings highest ROI, lowest disruption, fastest payback Year 2–4 (~$5M): Infrastructure upgrades in Critical and Moderate-tier buildings, building on the monitoring foundation established in Phase 1 Year 3–10 (~$4M): Long-term renewable investments solar, storage, and envelope improvements in the highest-potential facilities
Every phase comes with projected cumulative savings, carbon reduction estimates, and a break-even date clearly stated for leadership review.
Challenges we ran into -
Benchmarking Without Oversimplifying The temptation in any scoring model is to compare everything on the same scale. But a chemistry research building legitimately spends far more energy per square foot than a lecture hall, not because it is inefficient, but because it runs specialized equipment around the clock. Applying a single benchmark to all building types would have flagged research facilities as wasteful when they are operating exactly as designed. The solution was building category-specific benchmarks so every score reflects genuine inefficiency relative to comparable peers, not just raw consumption.
The Short-Term vs. Long-Term Tension Left unconstrained, a pure financial optimizer concentrates nearly all $12M in Tier 1 operational fixes because the payback is fastest and the ROI is highest. This is the financially rational answer. But it leaves zero investment in the long-term sustainability infrastructure that university leadership, accreditation bodies, and students increasingly demand. Resolving this tension required building explicit minimum allocation floors into the model, forcing the portfolio to reflect institutional values alongside financial return, exactly as a responsible ESG investment framework would.
Making Uncertainty Visible Without Undermining Confidence Early drafts of the financial model presented a single projected savings number. Leadership teams distrust single-point estimates because they know real-world results vary. But presenting a wide uncertainty range without context can undermine confidence in the entire proposal. The solution was the stress-testing framework — which shows that even under pessimistic assumptions, the investment case holds, and under expected assumptions, the returns are compelling. Uncertainty becomes a strength of the analysis rather than a weakness.
Translating Analysis Into a Decision-Ready Proposal The gap between a rigorous financial analysis and a boardroom-ready investment proposal is wider than it looks. Raw numbers, even accurate ones, do not persuade. They need to be structured as a narrative: here is the problem, here is the cost of inaction, here is the recommended portfolio, here is the expected return, here is the phased plan. Structuring all of the analysis outputs into a coherent strategic proposal with a clear ask, clear sequencing, and clear accountability, was as challenging as the analysis itself.
Accomplishments that we're proud of -
1) Developed a building scoring framework that makes complex energy data immediately actionable for non-technical decision-makers a CFO, a Board of Trustees, or a sustainability committee can understand the priority ranking in under a minute.
2) Built a $12M capital allocation model that balances competing financial and strategic objectives simultaneously short-term payback, long-term sustainability, and operational continuity, rather than optimizing for one goal at the expense of others.
3) Grounded every cost benchmark and savings projection in real university case studies with documented outcomes: the University of Illinois ($56M in avoided utility costs), MIT (70M kWh saved across 300+ projects), UC Berkeley ($6.5M in savings from accountability dashboards alone), and Purdue Northwest (32% energy cost reduction from operational improvements).
4) Produced a proposal credible enough to present to a real university CFO — with stress-tested financials, a phased implementation roadmap, clear payback timelines, and a frank discussion of risks and constraints.
5) Demonstrated that the highest-ROI energy investments are almost never the most visible ones. Solar panels win press releases. Operational fixes recalibrating controls, adjusting schedules, eliminating waste in systems already installed win financial audits. The model makes that case with data.
6) Successfully applied a fintech portfolio management discipline to an infrastructure investment problem in a way that neither a pure engineer nor a pure finance professional would have approached it the interdisciplinary framing is the core differentiator.
What we learned - Capital allocation is capital allocation, regardless of the asset class. The discipline of scoring risk, quantifying return, diversifying across investment tiers, and stress-testing assumptions applies equally to a trading portfolio and a campus energy investment plan. The domain vocabulary is different; the analytical framework is identical.
The highest-return energy strategy is almost always the least glamorous one. Retro-commissioning fixing what is already installed rather than buying new equipment, consistently delivers 20–30% energy savings with payback periods under one year. The University of Illinois generated $56M in avoided costs from this approach alone. Most institutions overlook it in favor of visible capital projects because it does not generate a ribbon-cutting moment. The financial model makes the case for boring, high-return fundamentals over exciting, low-return announcements.
Data visibility is the prerequisite for everything else. A university cannot prioritize its worst-performing buildings if it cannot see building-level consumption data. The monitoring and metering investment in Phase 1 is not just an operational improvement, it is the information infrastructure that makes every subsequent investment decision more defensible and more accurate. You cannot manage what you cannot measure.
Constraints are the most valuable part of the problem. An unconstrained $12M budget with no operational requirements and no competing objectives has a trivially simple solution. The real intellectual value of this challenge lives in the constraints the fixed budget, the aging infrastructure, the operational continuity requirements, the short-term vs. long-term tension. Every interesting strategic recommendation emerged from working within those boundaries, not around them.
The best financial analysis tells a story. Numbers alone do not move organizations. The payback period means nothing without the context of what inaction costs. The ROI projection means nothing without the stress-test that shows it holds under adverse conditions. Structuring analysis as a narrative, with a clear problem, a credible recommendation, and an honest accounting of risk, is as important a skill as the analysis itself.
What's next for CampusEnergy360: Smart Building Health Scorer - Immediate Next Steps (0–6 months)
Pilot the scoring framework at a real university campus — ideally with 10–15 buildings — to validate that the EHS scores correlate with actual utility bill performance and calibrate the benchmark weights empirically. Real-world validation transforms this from a compelling model into a credible business case for broader adoption. Develop a department-level cost accountability dashboard modeled on UC Berkeley's charge-back program, which generated $6.5M in savings primarily through financial accountability rather than capital investment. When departments see their own energy costs reported monthly against a benchmark, behavioral change follows without a single infrastructure upgrade. Expand the financial model to incorporate federal incentive programs — specifically Inflation Reduction Act tax credits, DOE Better Buildings Challenge grants, and utility rebate programs — which can materially improve the ROI of Tier 2 and Tier 3 investments and have not been fully modeled in the current version.
Medium-Term Growth (6–18 months) Build a vendor procurement framework that uses the scored building list to generate competitive RFPs for energy service companies (ESCOs), specifying performance-based contracts that tie vendor payment to verified savings rather than equipment installation. Performance contracting eliminates upfront capital risk and aligns vendor incentives with institutional outcomes. Develop a Board-ready annual energy investment report that presents the portfolio's financial performance actual savings vs. projected, payback progress, NPV realization in the same format as an investment portfolio review. Energy infrastructure should be reported with the same financial discipline as any other institutional asset.
Long-Term Vision (18 months+) Scale to a multi-university SaaS platform, the scoring and budget optimization framework is campus-agnostic and applies equally to any university system, municipal building portfolio, or large commercial real estate operator. The addressable market extends well beyond higher education. Incorporate carbon accounting as a parallel financial metric alongside dollar savings, calculating cost per ton of CO₂e avoided for every investment and enabling universities to report progress toward net-zero commitments with the same rigor they apply to financial reporting.
Eventually integrate with demand response markets, positioning campus buildings as active grid participants rather than passive consumers, generating revenue from load flexibility during peak grid events and turning the energy infrastructure from a cost center into a partial revenue generator.
Built With
- financialmodelling
- microsoftexcel
- powerpoint
- systemdesign

Log in or sign up for Devpost to join the conversation.