-

Data Bazaar - The Dunes
-
Camelitics Add-On


Inspiration
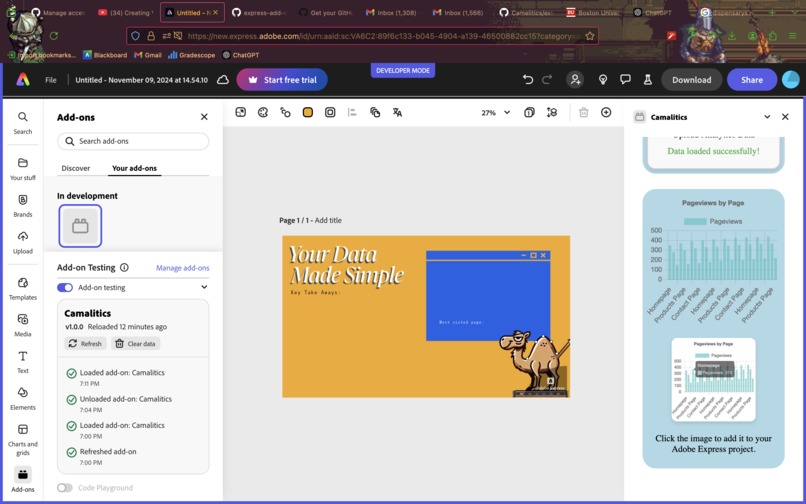
We aimed to create a user-friendly tool to simplify data visualization for marketers and designers, utilizing Google Analytics data into engaging, presentation-ready visuals.
What it does
Camelitics allows users to upload JSON data from Google Analytics and generate interactive, professional charts that can be dragged and dropped into Adobe Express projects.
How we built it
We developed Camelitics using Node.js and integrated Spectrum Web Components for responsive design.
Challenges we ran into
Aligning the interactive charts with Adobe Express's drag-and-drop functionality and ensuring responsive design was very difficult and required significant troubleshooting and integration efforts.
Accomplishments that we're proud of
We successfully built an intuitive, visually appealing tool that allows users to interact directly with their data.
What we learned
We gained valuable experience in integrating data visualization into creative platforms, handling JSON data, and optimizing responsive design.
What's next for Camelitics
We plan to expand data upload options, add more customization for charts, and add more statistical methods for the provided JSON data.
Built With
- adobe-express
- javascript
- mui
- next.js
- styled-components


Log in or sign up for Devpost to join the conversation.