-
-
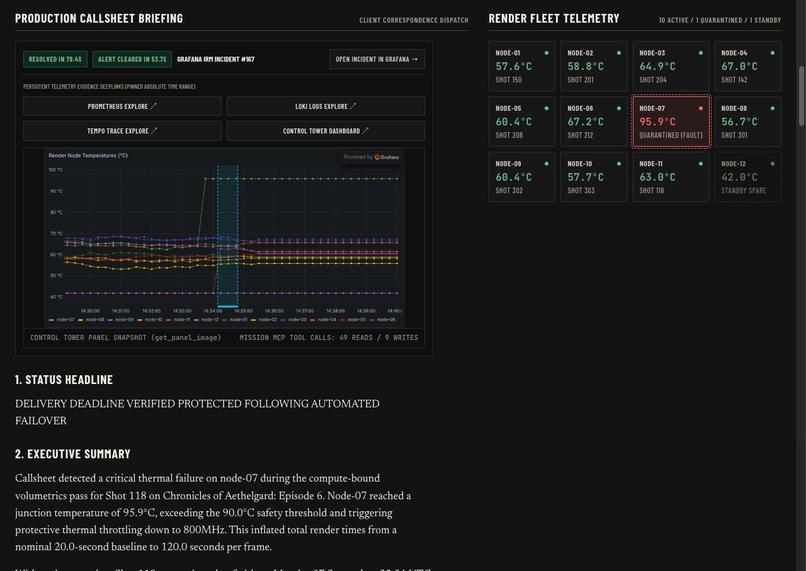
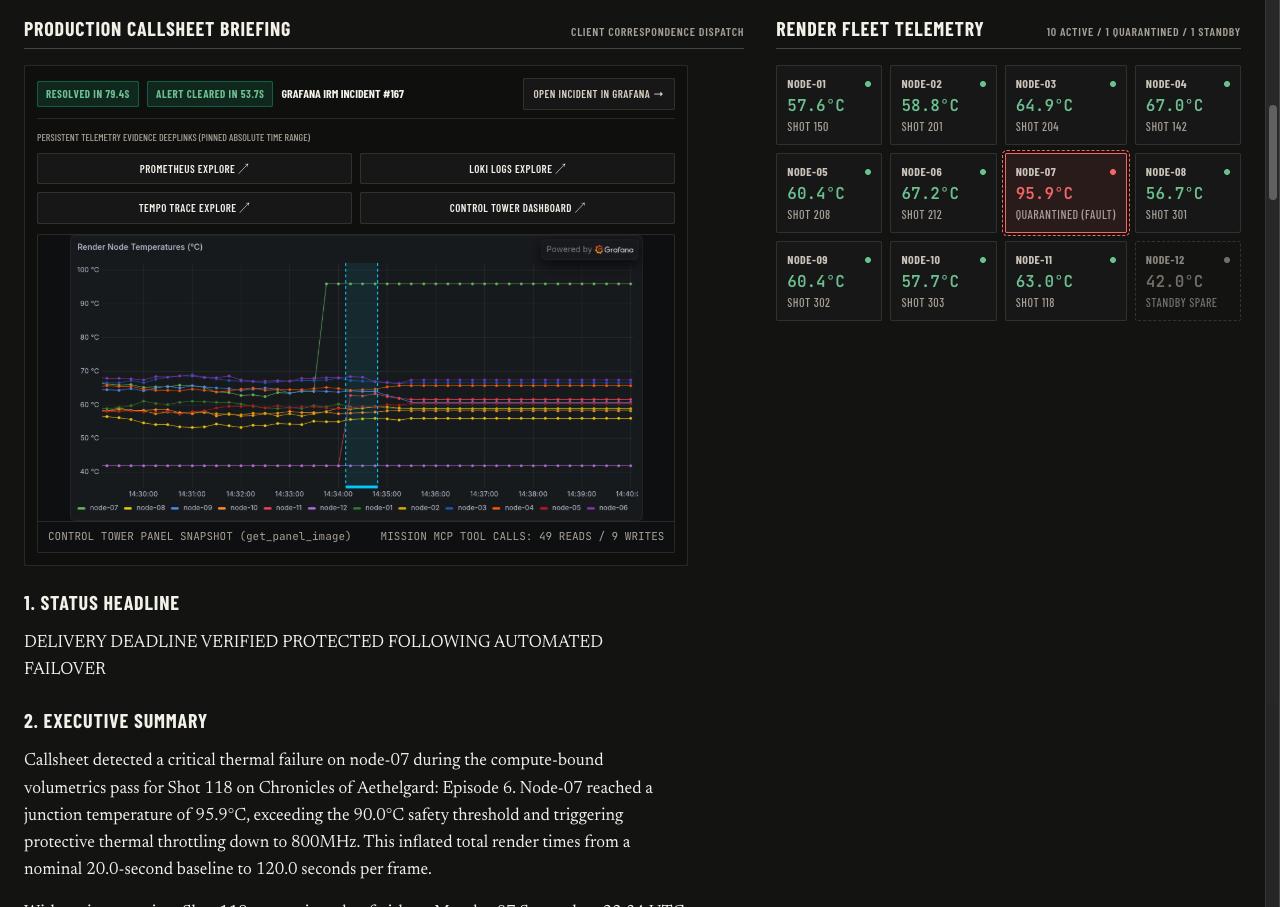
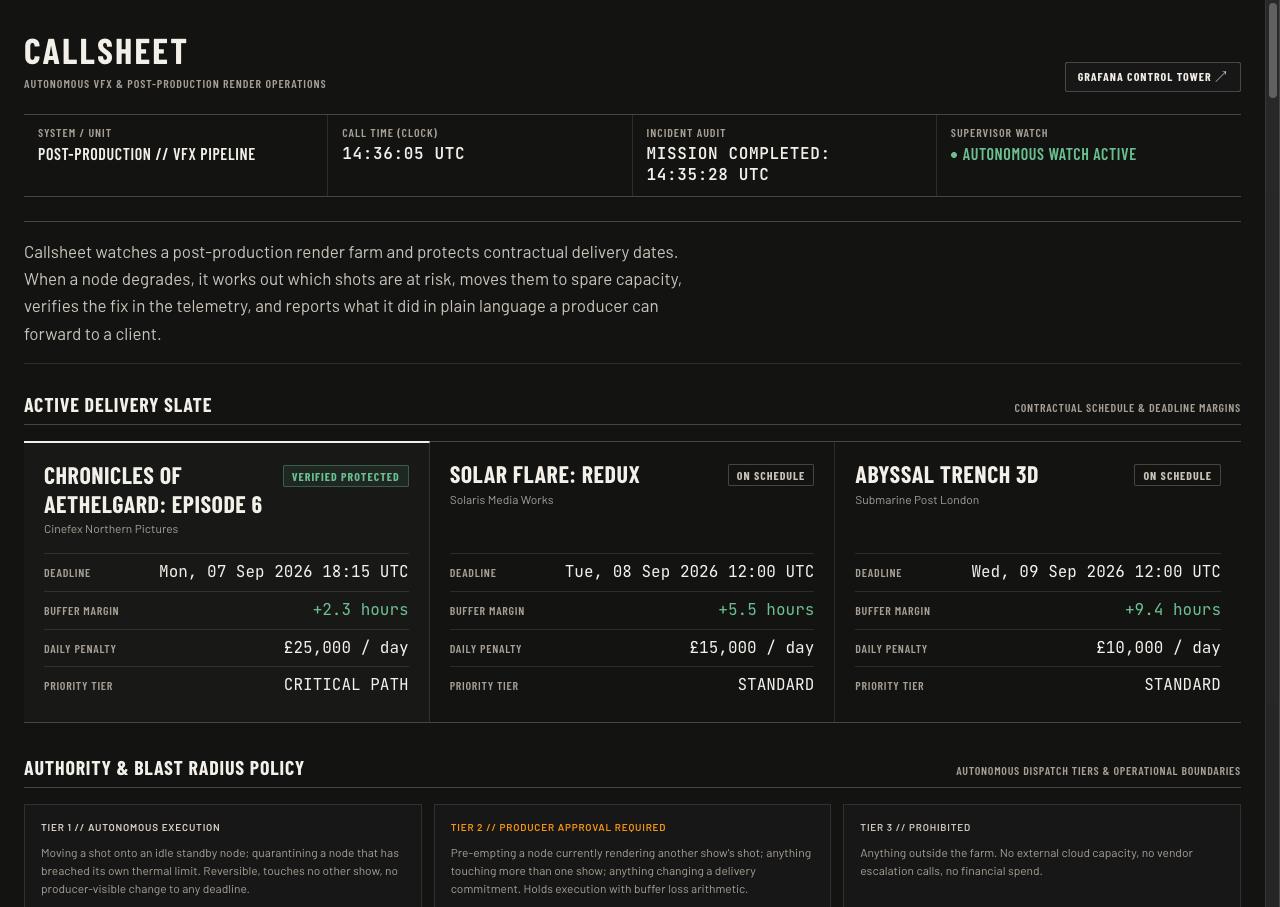
Resolved incident card, deeplinks, panel image with the annotation band, fleet with node-07 quarantined
-
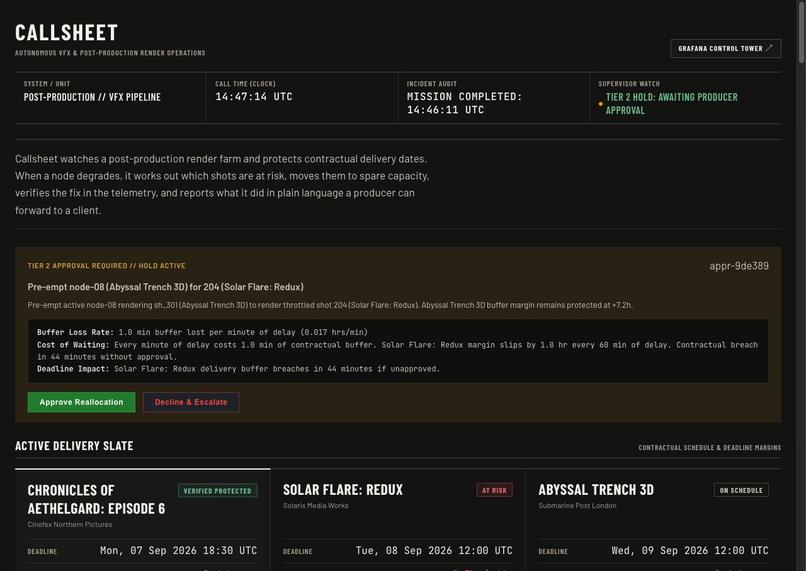
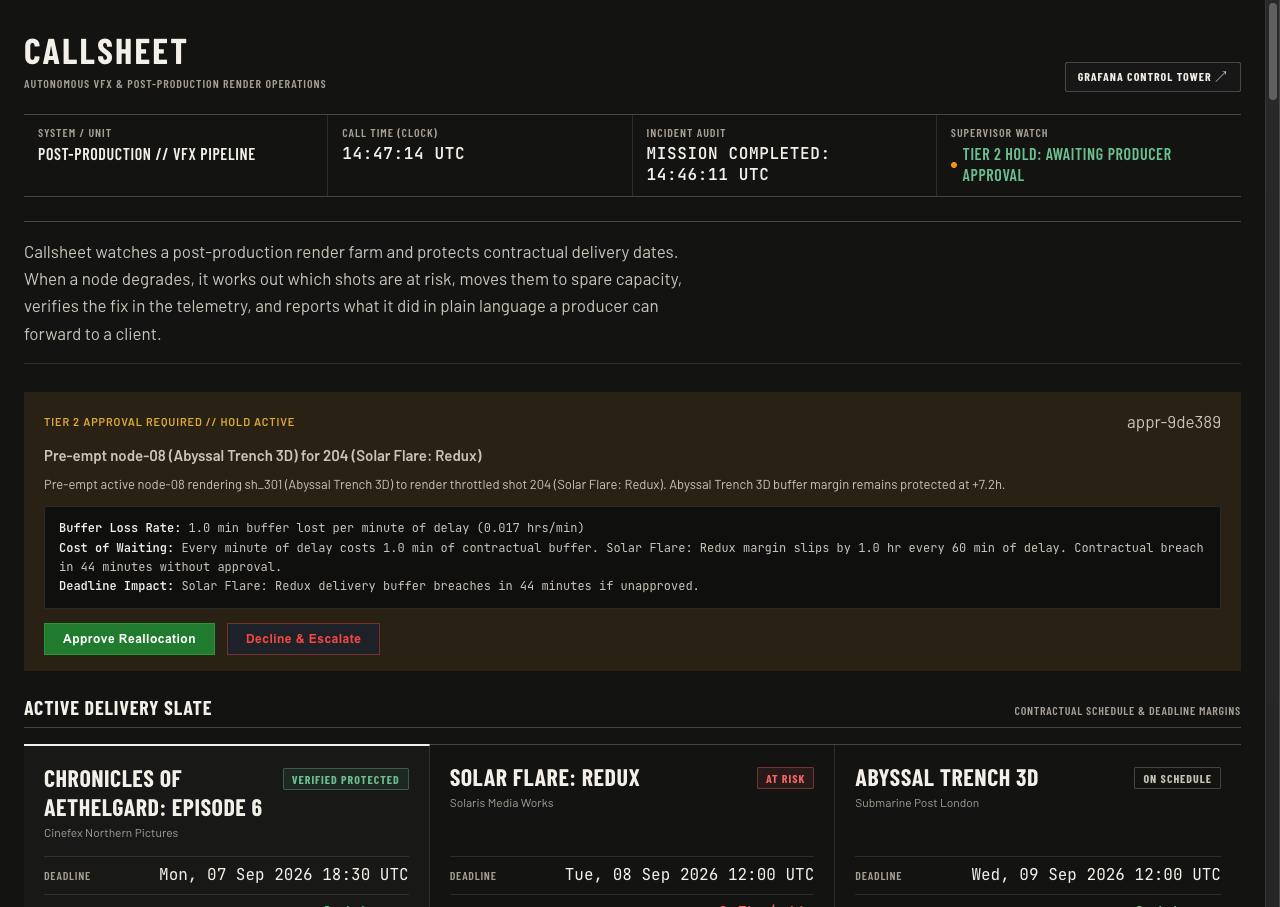
The Tier 2 hold with cost-of-waiting arithmetic and Solar Flare at risk
-
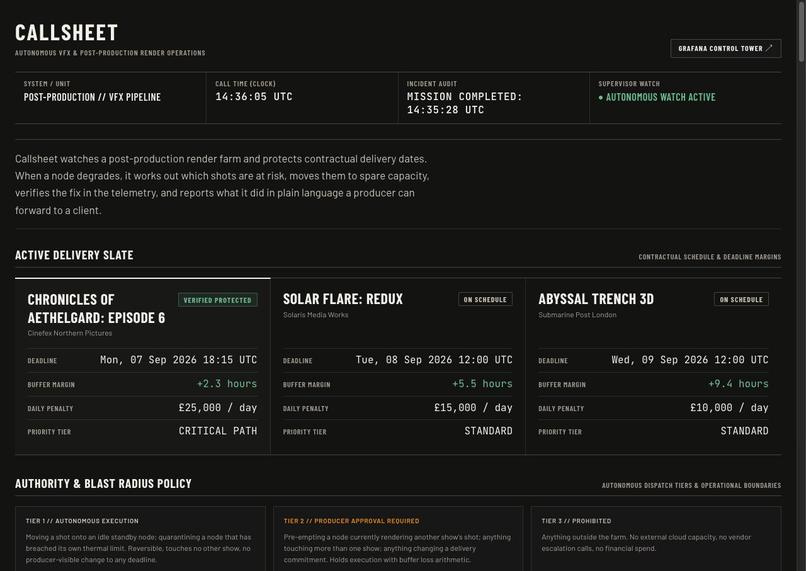
The call sheet: slate with live margins and the blast radius policy
-
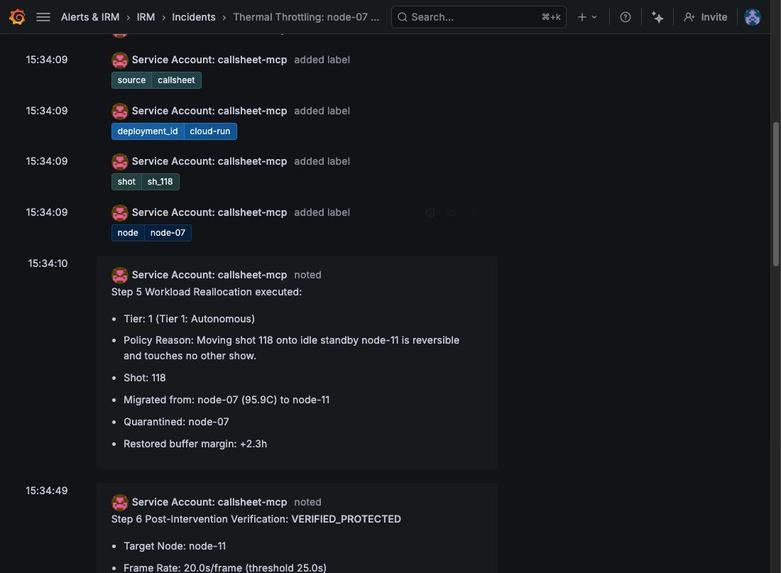
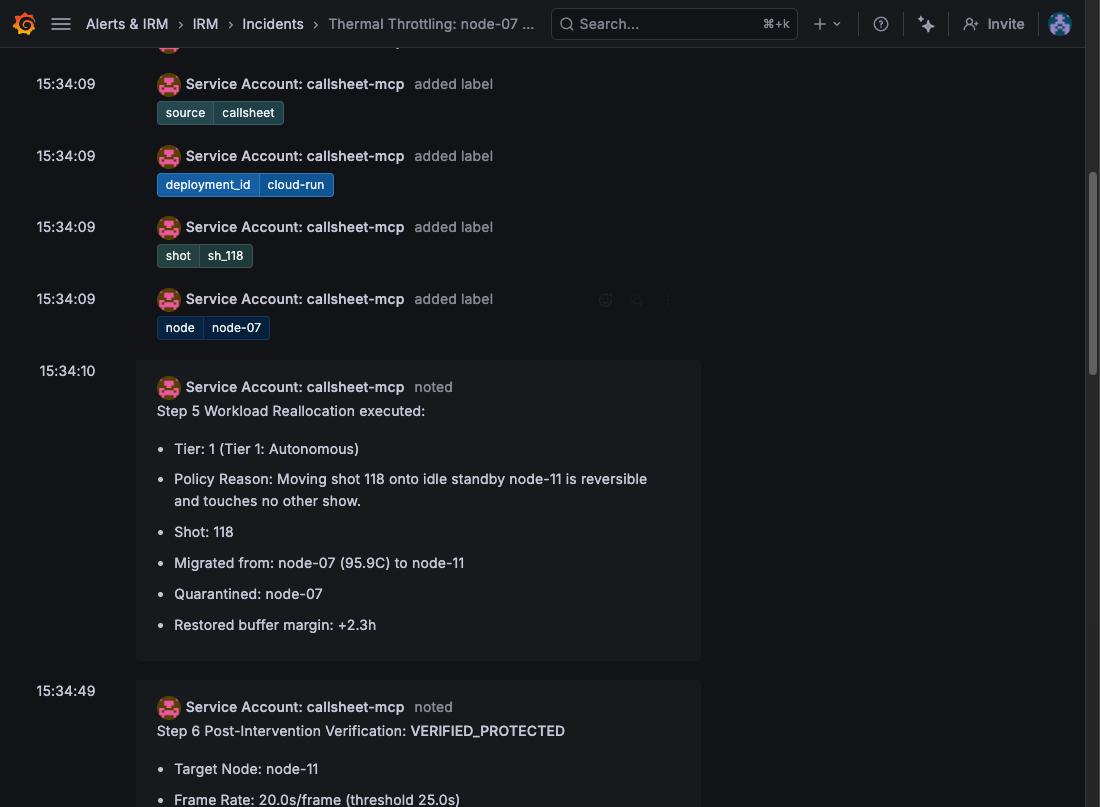
Grafana IRM activity written by the service account: labels, Step 5, Step 6
-
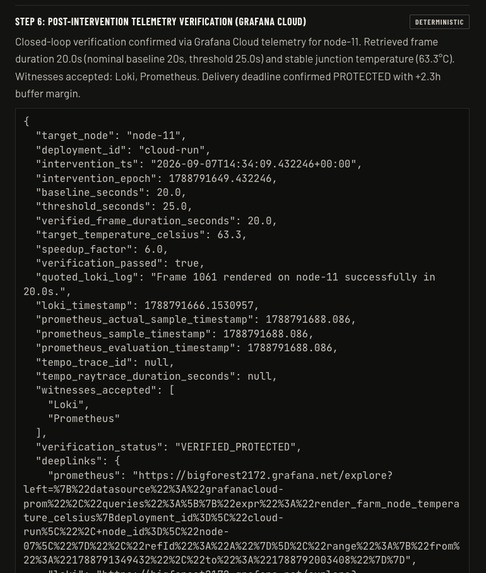
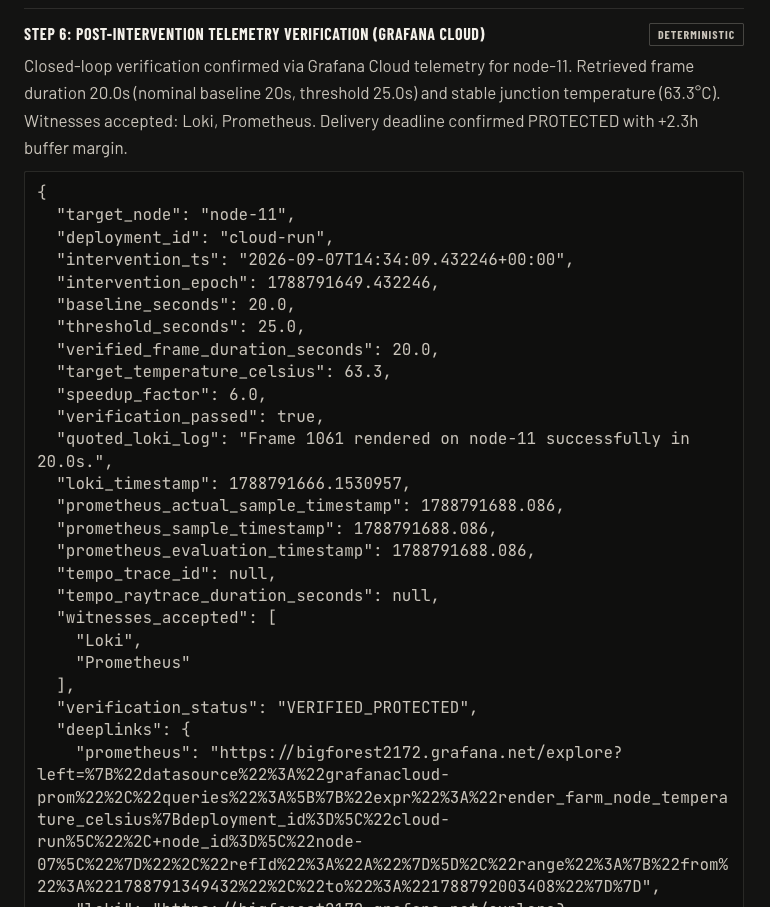
The Step 6 evidence block with timestamps and witnesses
-
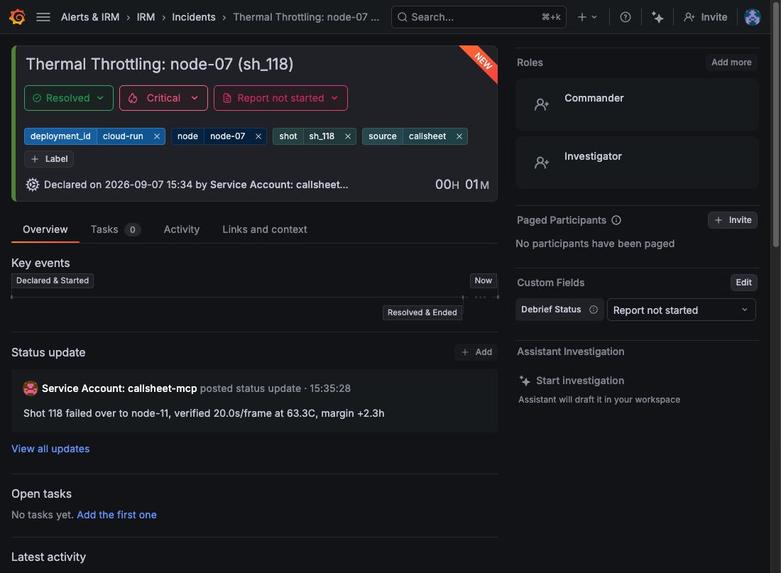
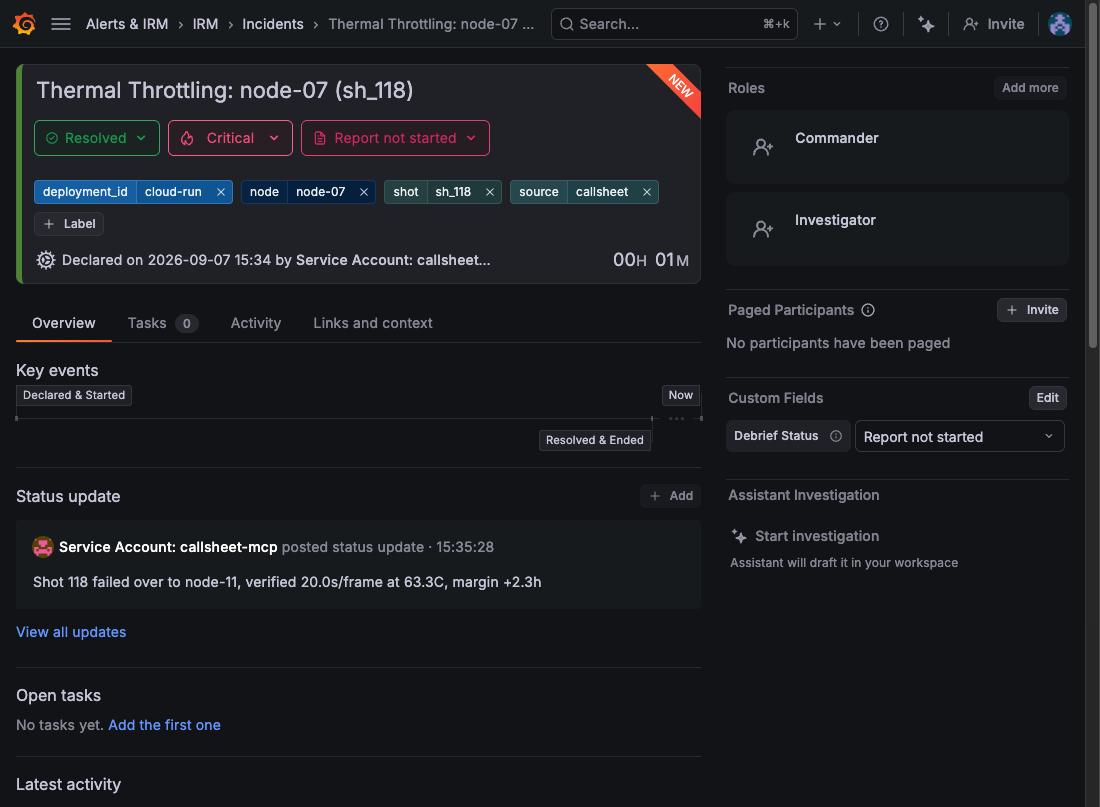
Incident 167 resolved in IRM with the status update
Callsheet: Autonomous Operations Agent for Post-Production Delivery Producers
Testing Instructions:
Live: https://callsheet-746874807798.us-central1.run.app (health: /api/health, scenarios: /demo)
Public Grafana dashboard: https://bigforest2172.grafana.net/public-dashboards/a9028daf791643b8899a10531f6b31dd
Walkthrough: JUDGING.md in the repo
What it does
Elena Vance is the delivery producer at Cinefex Northern Pictures, an independent visual effects house in Manchester. Her team delivers final visual effects shots for episodic streaming television. Right now, Elena is managing the delivery of Chronicles of Aethelgard: Episode 6, facing a contractual delivery deadline later that afternoon. If her team misses that delivery, the client contract triggers an immediate penalty clause of £25,000 per day. Elena is the user persona I designed Callsheet around rather than a real customer.
When a render blade degrades at two in the morning, conventional observability alerts the infrastructure engineer with raw metrics: junction temperatures and clock frequencies. That engineer rarely understands shot dependencies, client commitments, or penalty clauses. I built Callsheet for Elena and the studio crews who answer for delivery dates.
Callsheet watches the render farm through Grafana Cloud over the Model Context Protocol, and Grafana is what wakes it. A Grafana alert rule fires when a node is over its thermal limit with a shot allocated. Callsheet reads that alert through MCP, investigates across Prometheus, Loki and Tempo, asks Gemini for the root cause, and works out the delivery deficit with plain arithmetic. It opens an incident in Grafana IRM, acts within a stated blast radius (a shot moved to an idle standby node, the hot node quarantined), and then proves the action worked by reading the standby node's telemetry back from Grafana: a frame log line, a temperature sample and a trace, all timestamped after the move, all inside stated limits. Only then does it annotate the dashboard, watch its own alert clear, write Elena a briefing she can forward to the client, and resolve the incident. If the only way to save a deadline is to take a node from another show, it stops and asks a producer, with the cost of waiting counting down on screen. If verification fails, it rolls the shot back and tries the next standby before it escalates.
Features and functionality
- Grafana raises the alarm, not a poll. Callsheet provisions its own Grafana Alerting rule through MCP and wakes only when Grafana reports it firing. Every mission records the alert instance that started it. Without Grafana, Callsheet would be a post-mortem tool that tells you why you missed the deadline after the money is already lost.
- Three-signal investigation over MCP. Prometheus for the thermal breach, Loki for the down-clock and frame lines, Tempo for the inflated raytrace span, correlated on the same node and window.
- A stated blast radius with a human in the loop where it matters. Tier 1 executes on its own: move a shot onto an idle standby, quarantine a node over its limit. Tier 2 holds for producer approval: pre-empt a node rendering another show, or anything that touches more than one show. Tier 3 is never: nothing outside the farm, no spend. The policy is printed on the producer page, in the README and in every incident.
- Verification that can fail. After the move, Callsheet polls Grafana for up to 150 seconds for evidence from the standby node timestamped after the intervention. It passes only if the retrieved frame duration is within 1.25 times the stated baseline and the temperature is below 90 degrees, with Loki and Prometheus required and Tempo accepted when it lands. No evidence means inconclusive, never a guess. Failed evidence means rollback to the next standby, then escalation.
- Writes back to Grafana, not just reads. Incident opened, worked and resolved last with a summary in Grafana IRM; an annotation region on the dashboard from action to proof; deeplinks pinned to the incident's absolute time window; a rendered panel image in the briefing; the alert observed clearing. Thirteen MCP tools across ten of the server's tool categories, seven of them writes, listed in the README.
- Deterministic decisions, generative prose. Thresholds, arithmetic, tier classification, failover, verification and rollback are Python. Gemini writes the root cause and the producer briefing. If Gemini returns nothing the mission stops and says so.
- A producer's interface, not an engineer's. The page is designed like a call sheet: the delivery slate with live margins, the fleet, the approval card when one is needed, the briefing, and the evidence trail underneath for anyone who wants to check.
- Provably live.
/api/healthreports the runtime, the MCP transport, a live reachability probe, the alert rule state, the model, the last mission and its trigger, the cycle clock, and a stall detector. There is no replay mode.
Technologies used
- Google Agent Development Kit (ADK):
google.adk.tools.mcp_tool.McpToolsetwithStreamableHTTPConnectionParamsmanages the MCP session, headers and tool calls to the Grafana MCP server. - Vertex AI Gemini: Gemini 3.8 Flash through the Google GenAI SDK on the Vertex AI global endpoint, for root-cause synthesis and the producer briefing.
- Grafana Cloud: Prometheus, Loki and Tempo for telemetry; Grafana Alerting for the trigger; Grafana IRM for incidents; dashboard annotations, deeplinks and panel rendering.
- Model Context Protocol: the official
grafana/mcp-grafanaserver, v1.2.0, self-hosted as a sidecar in the Cloud Run container in streamable HTTP mode with a service account token, so the agent runs headless. - Google Cloud Run: instance-based billing with CPU always allocated so the background loop keeps running between requests; built and deployed with Cloud Build.
- Python 3.12: FastAPI, asyncio, and the OpenTelemetry SDK exporting metrics, logs and traces over OTLP.
Other data sources used
- Production scheduling metadata from the farm scheduler: which shot is on which node, contractual deadlines, frames remaining, baseline frame rates, priorities and penalty amounts. In a studio this would be the render queue manager. Every telemetry value that drives a decision comes from Grafana; the scheduler supplies the production context around it.
Findings and learnings
What the render farm is and is not
There is no actual render farm behind this; the machines are simulated. But the metrics, logs and trace spans they emit are genuine OpenTelemetry sent to a real Grafana Cloud stack through an OTLP gateway, and the agent reads them back the same way it would read real hardware. The fault on the source node is never cleared by remediation, so verification can never pass by construction: node-07 stays hot after quarantine on purpose. To move Callsheet onto physical infrastructure, the telemetry emitter and the scheduler adapter change and the agent does not.
The first verification step passed by construction, and I nearly shipped it
My first step 6 read back the standby node's telemetry, but when Loki had nothing yet it fell back to a synthesised log line in exactly the format the emitter uses, and the frame rate was assigned from the baseline constant rather than parsed from anything. It looked verified on screen and it was not. I rewrote it to fail closed: poll for evidence timestamped after the intervention, parse the duration out of the retrieved line, require two witnesses, accept a third, and report inconclusive when nothing arrives. Then I found the simulator pinning the frame counter so the same frame number repeated in Loki every twenty seconds, which the deeplink I was handing judges pointed straight at. The lesson I keep coming back to: the report is not the evidence. Read the code path and open the query.
Alert semantics matter more than alert speed
My first alert rule fired on temperature alone, which meant it stayed firing for the rest of the cycle after a quarantine, because the node is still hot. The agent was resolving incidents while its own alert stayed red. The fix was semantic: alert on a node that is over its limit and has a shot allocated, which is the actionable condition, so quarantine clears it and the loop reads correctly in Grafana: alert fires, agent acts, alert clears, incident resolved. Separately, I configured the rule group at 10 seconds and measured evaluations landing exactly on the minute; Grafana Cloud evaluates this group every 60 seconds on my stack regardless. I documented the observed floor rather than the configured value.
The event loop was the bottleneck, not the model
On Cloud Run the farm's five second tick was arriving every sixteen seconds and the health endpoint took over four seconds to answer. The OpenTelemetry simple processors were exporting every span and log record synchronously on the event loop, one HTTPS round trip each. Switching to the batch processors, removing a forced metric flush from the tick, and feeding the simulator wall-clock deltas took the tick to 5.00 seconds at two milliseconds of work and health to under 200 milliseconds. Verification time dropped from about a hundred seconds to under fifty.
Loki labels versus structured metadata
A deeplink I generated used my own attributes in the stream selector and returned nothing when a judge would have clicked it. On Grafana Cloud, OTLP attributes outside the default indexed set land in structured metadata, not labels, so they belong in a label filter after the selector. Every generated query is now fetched with the service account before it is written into an incident.
The Vertex AI regional endpoint observation
Gemini 3.x calls failed with HTTP 404 on the us-central1 regional endpoint in my project, which reads like a permissions problem rather than routing. Moving the client to location="global" resolved it. The observation stayed in my notes because it can mislead anyone bringing up a new Gemini model on Vertex AI.
Cloud Run CPU allocation and instance lifecycle
min-instances=1 was not enough to keep a background loop alive. Under request-based billing, "CPU is only allocated during request processing", and the documentation warns that "Idle instances, including those kept warm using minimum instances, can be shut down at any time." Instance-based billing with CPU always allocated fixed the loop. Instances are still replaced from time to time, so mission history and pending approvals live in memory and a replacement starts a fresh cycle, which the health endpoint reports as scenario_primed_by: instance_start. A stale-alert guard I added later deadlocked the loop for five hours across one such replacement; I removed the guard and added a stall detector that shows on the page and in health.
Grafana Cloud ingestion boundaries
Prometheus rejects samples that arrive behind the newest sample for a series by more than the out-of-order window, and Loki rejects log lines older than the stream head by more than its ceiling. That ruled out backfilling history, so every incident runs in real wall-clock time, and the farm resets on a six hour cycle to keep everything inside the windows.
What Callsheet cannot do
It cannot repair hardware or clear a thermal fault. It infers throttling from temperature, clock rate and frame duration, not from sensors it does not have. It assumes standby nodes already have storage mounted and assets reachable. It cannot manufacture capacity: if no standby remains and no pre-emption is approved, it escalates. It cannot renegotiate a delivery date; its job is to protect the schedule before the deadline lapses and to tell the producer the truth about whether it did.

Log in or sign up for Devpost to join the conversation.