-
-
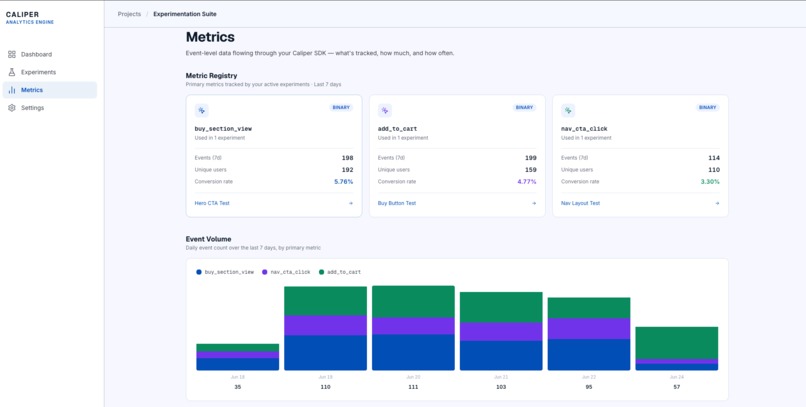
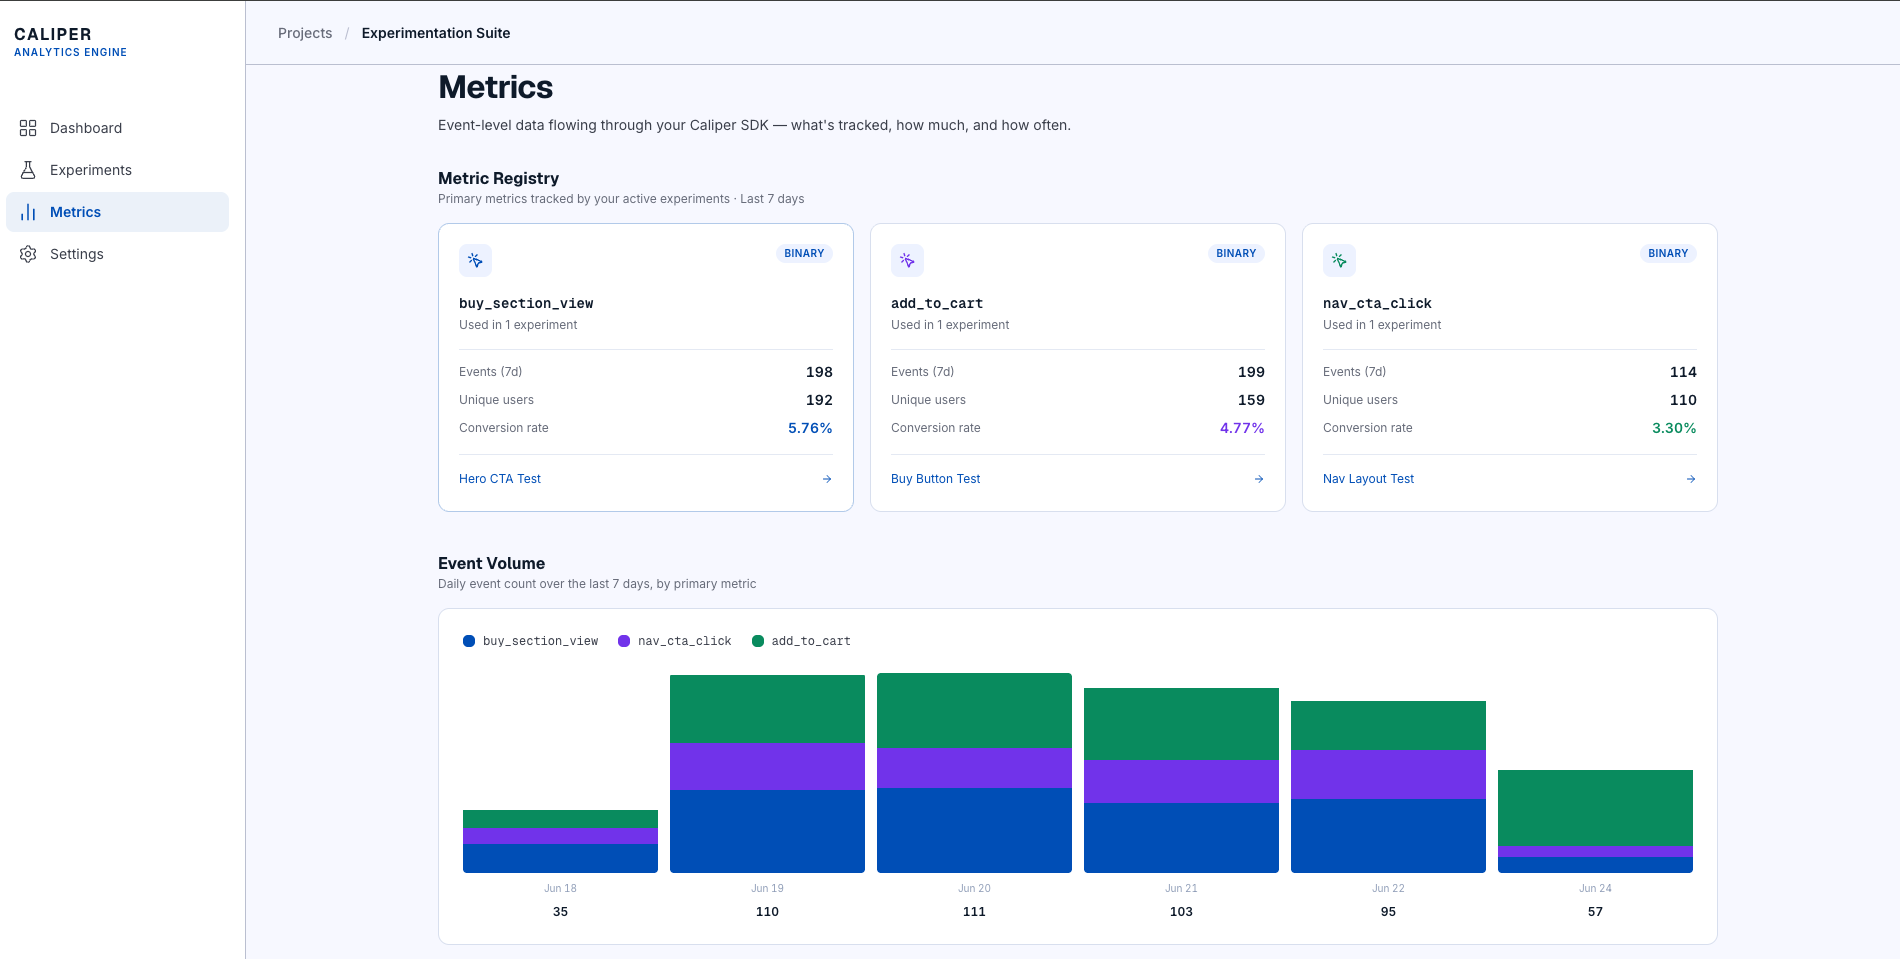
Metric Registry with per-metric event count, unique users, conversion rate — plus stacked event volume by primary metric.
-
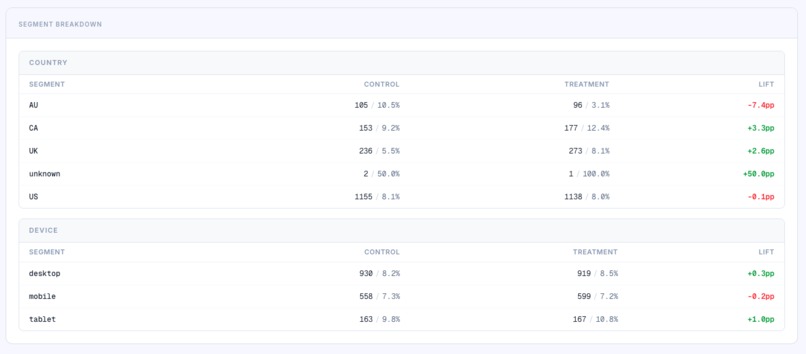
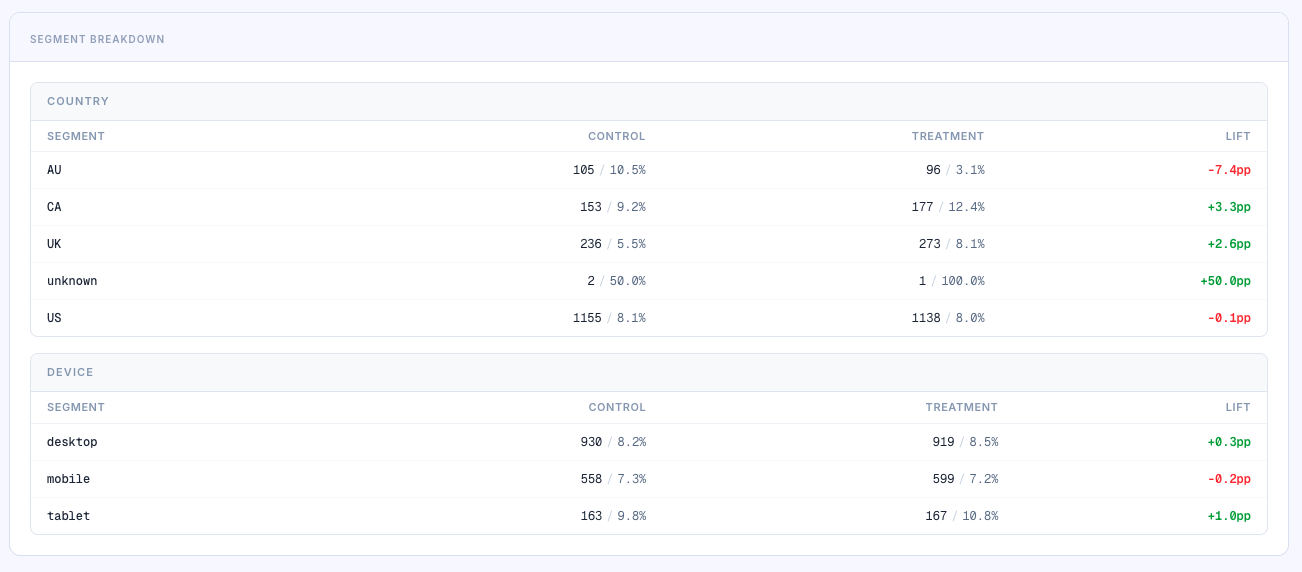
Segment-level lift table by country and device — refreshed every 15 minutes by a containerized dbt Lambda via EventBridge cron.
-
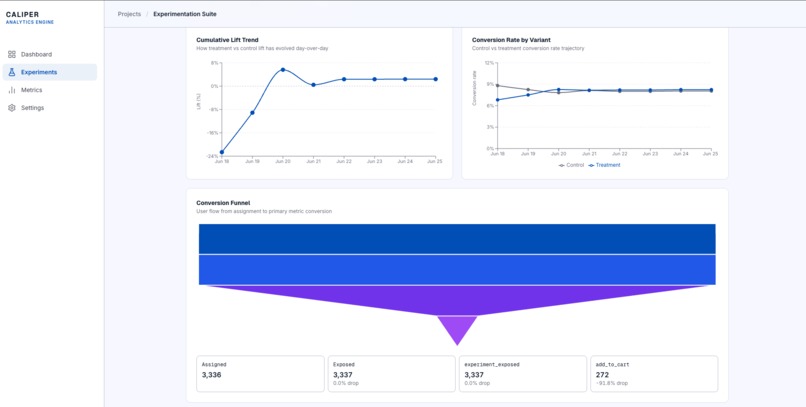
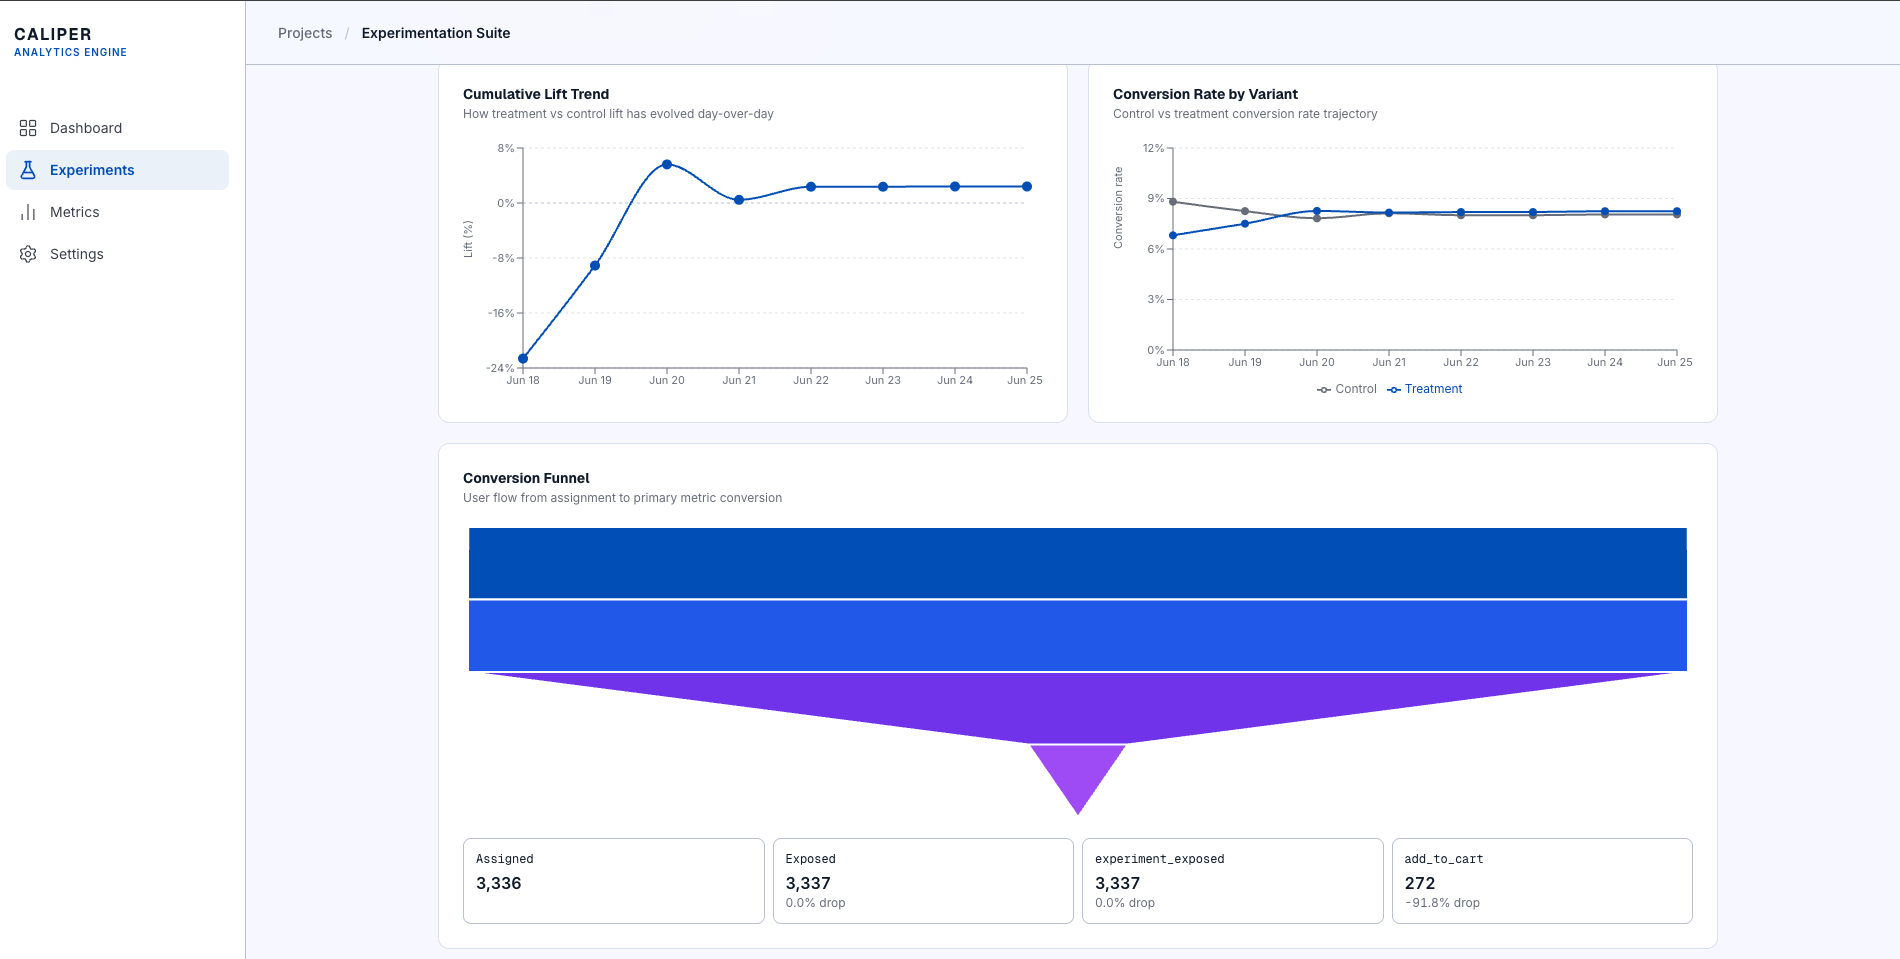
Cumulative Lift Trend, Conversion Rate by Variant, and Funnel charts — all live from Aurora PostgreSQL via Recharts.
-
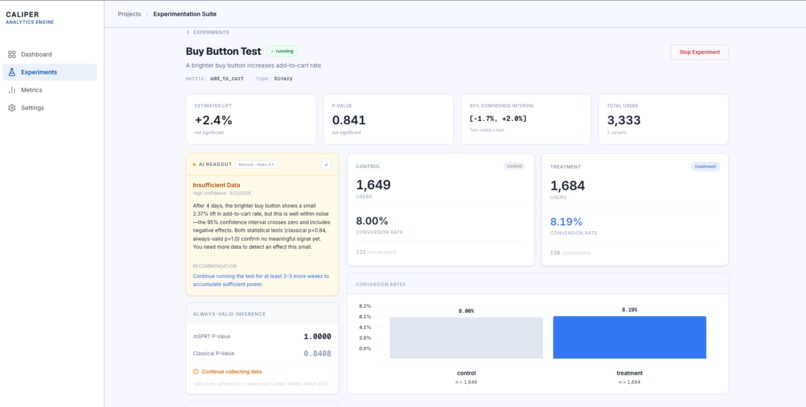
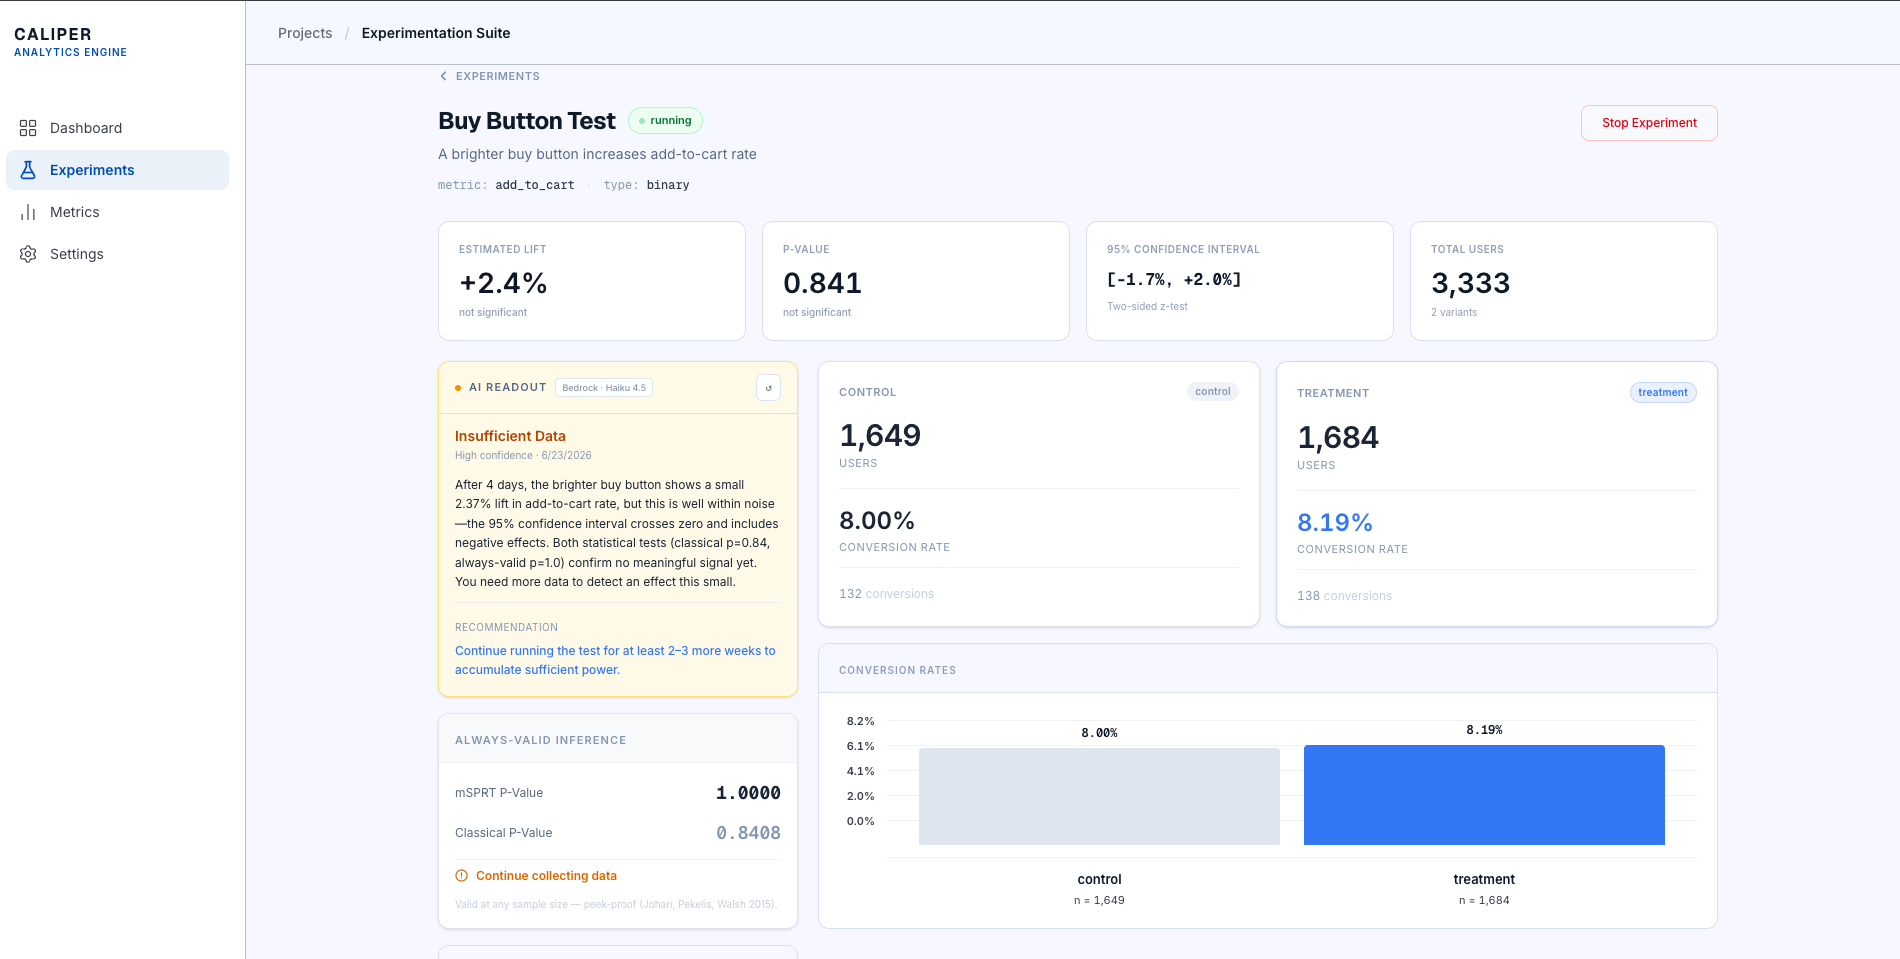
Experiment detail with Bedrock-generated readout — flags the classical vs always-valid p-value divergence as peeking risk.
-
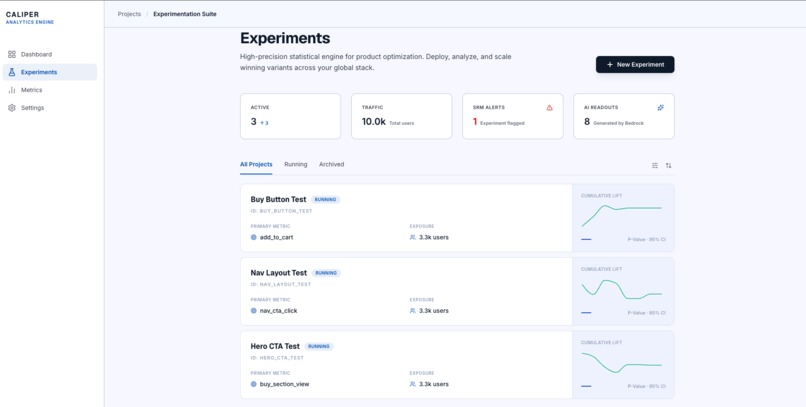
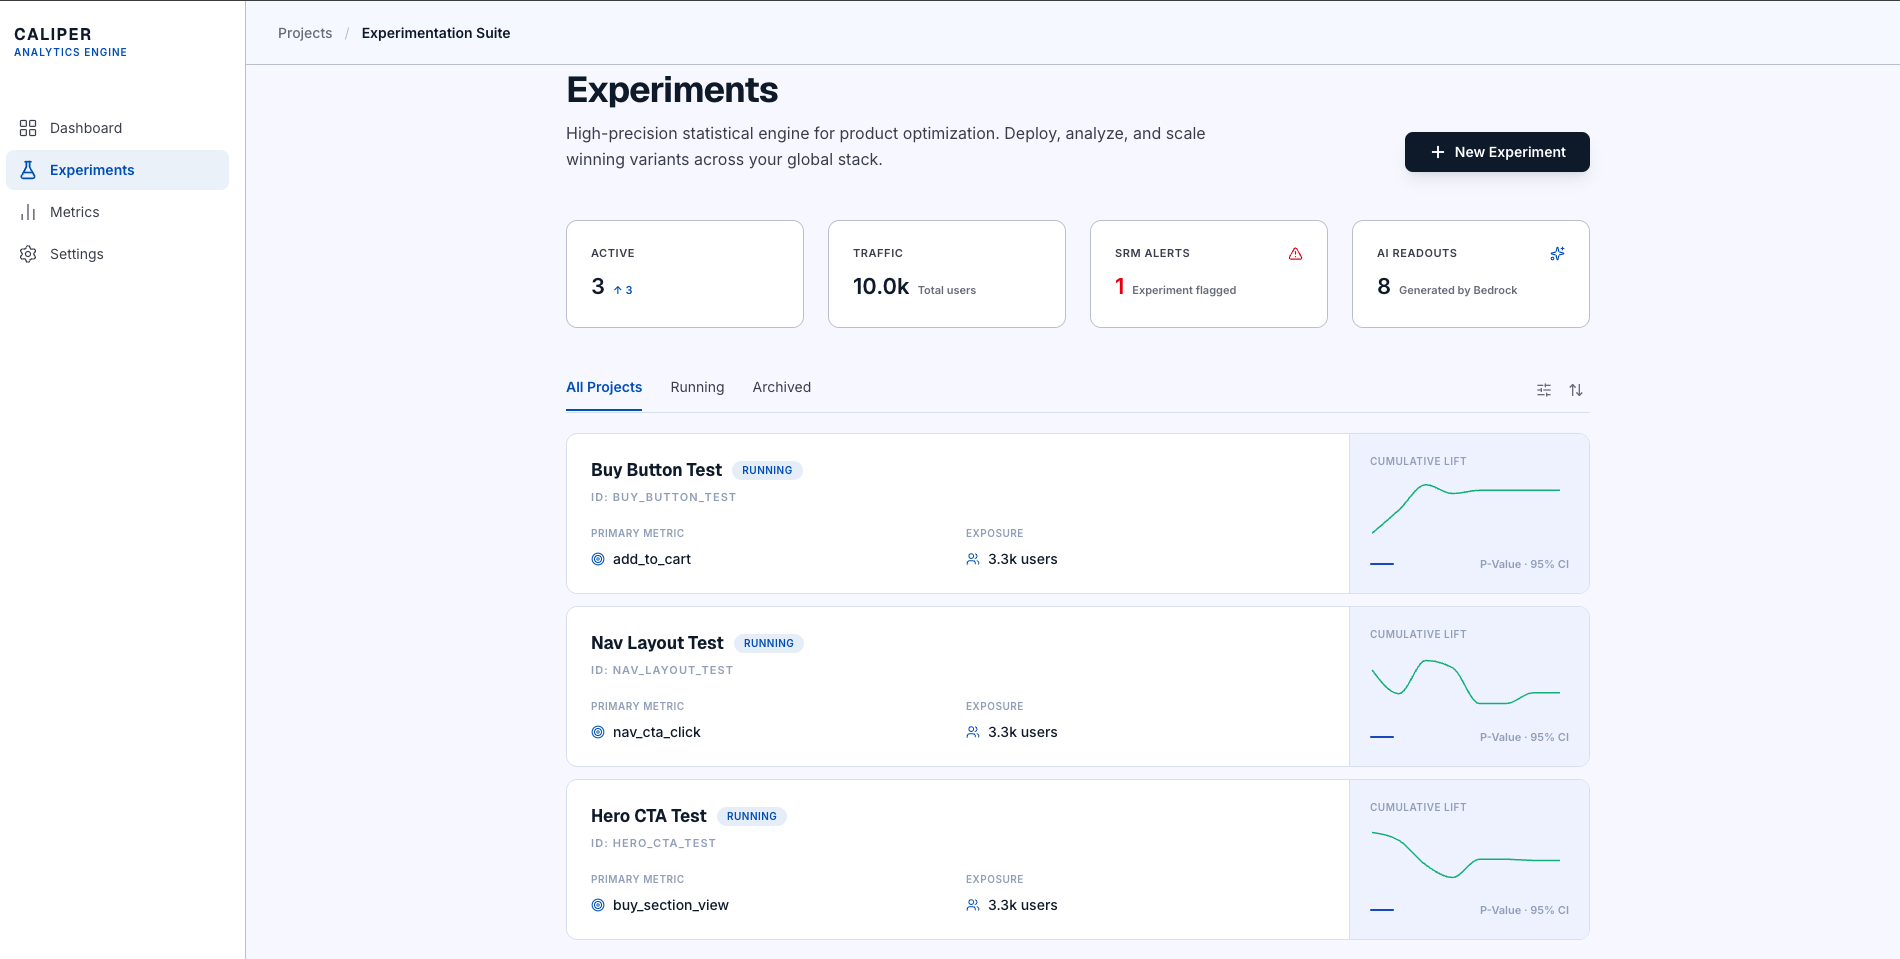
Experiments inventory with cumulative-lift sparklines, primary metric, exposure count, and live SRM alert badge.
-
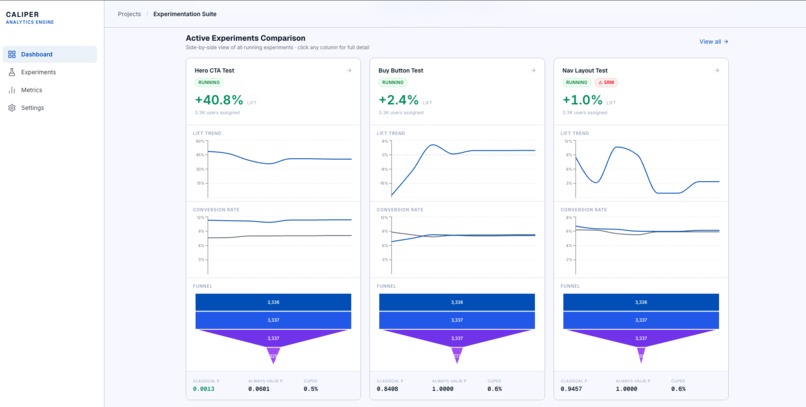
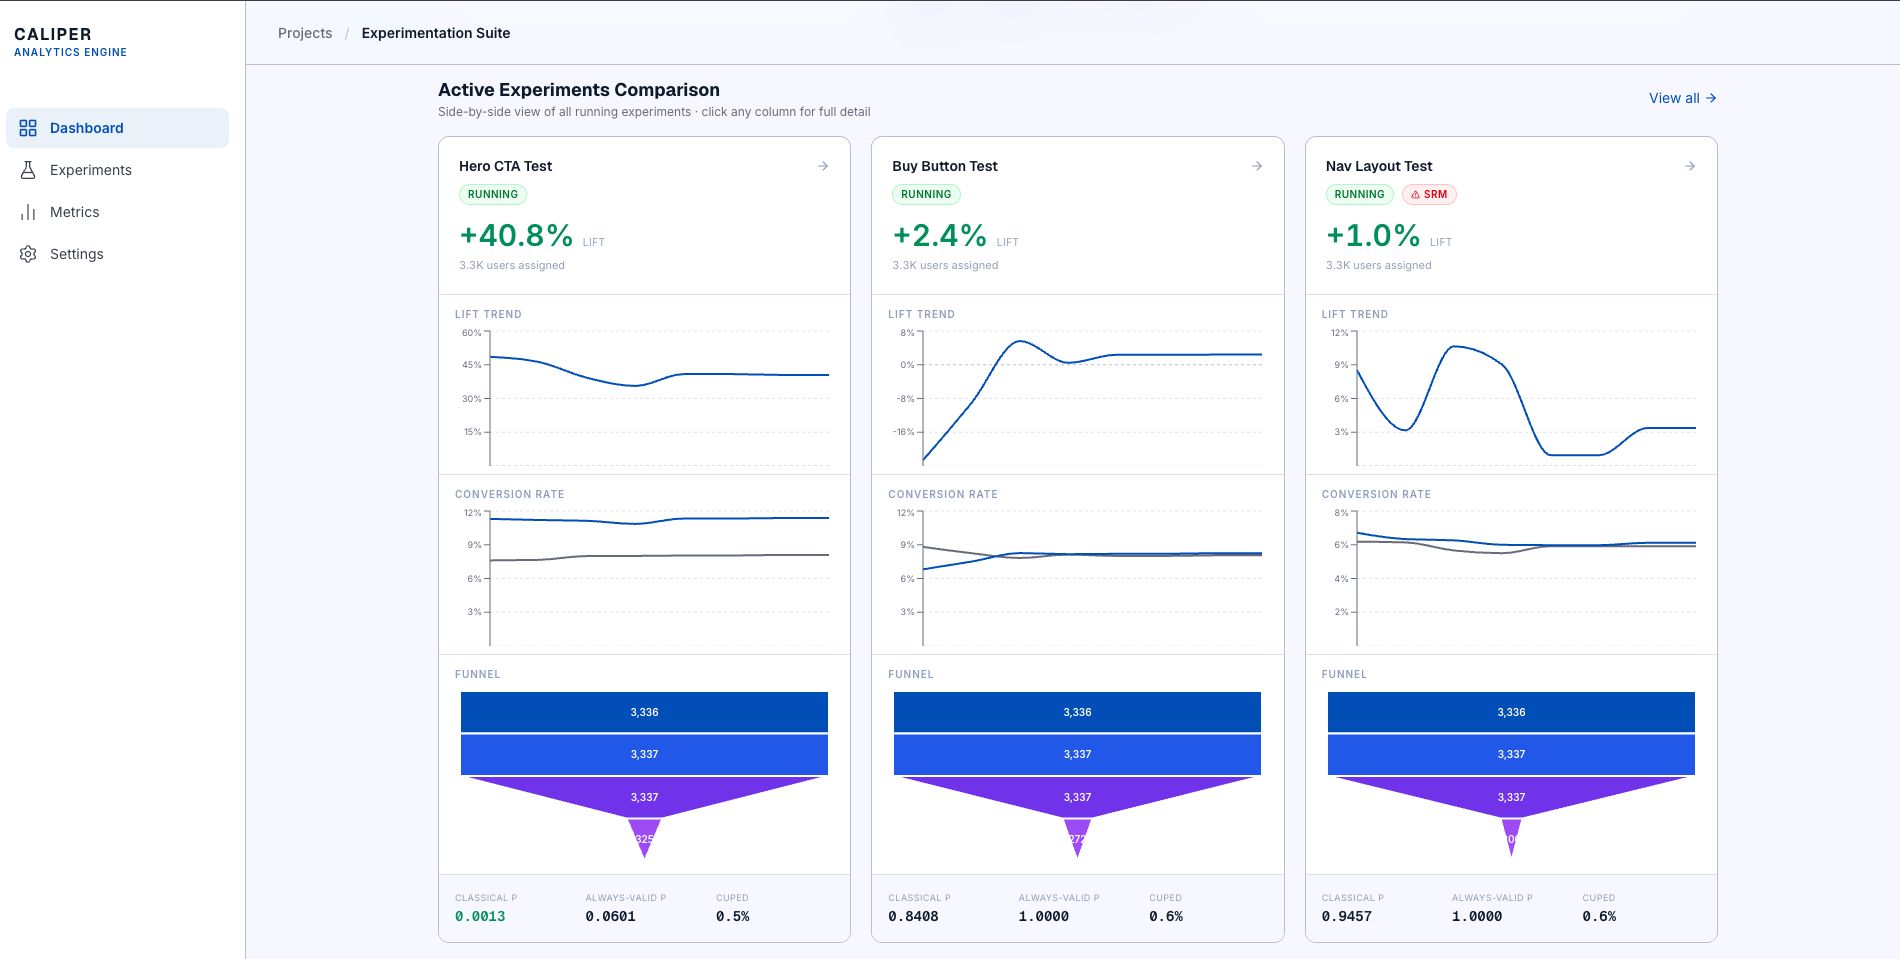
Side-by-side comparison of all running experiments — Lift Trend, Conversion Rate, and Funnel charts per experiment.
-
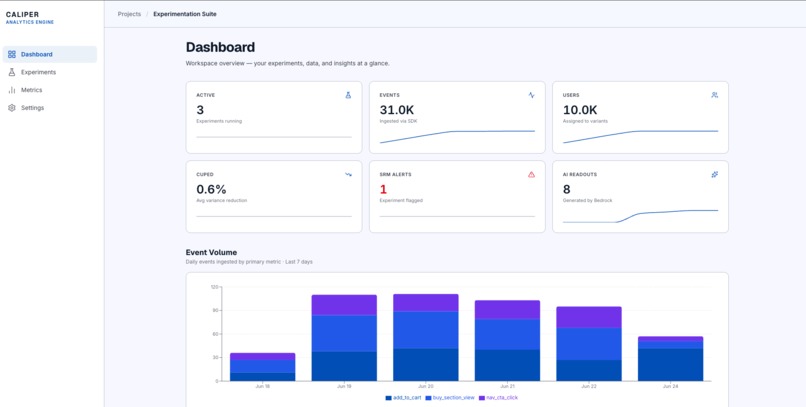
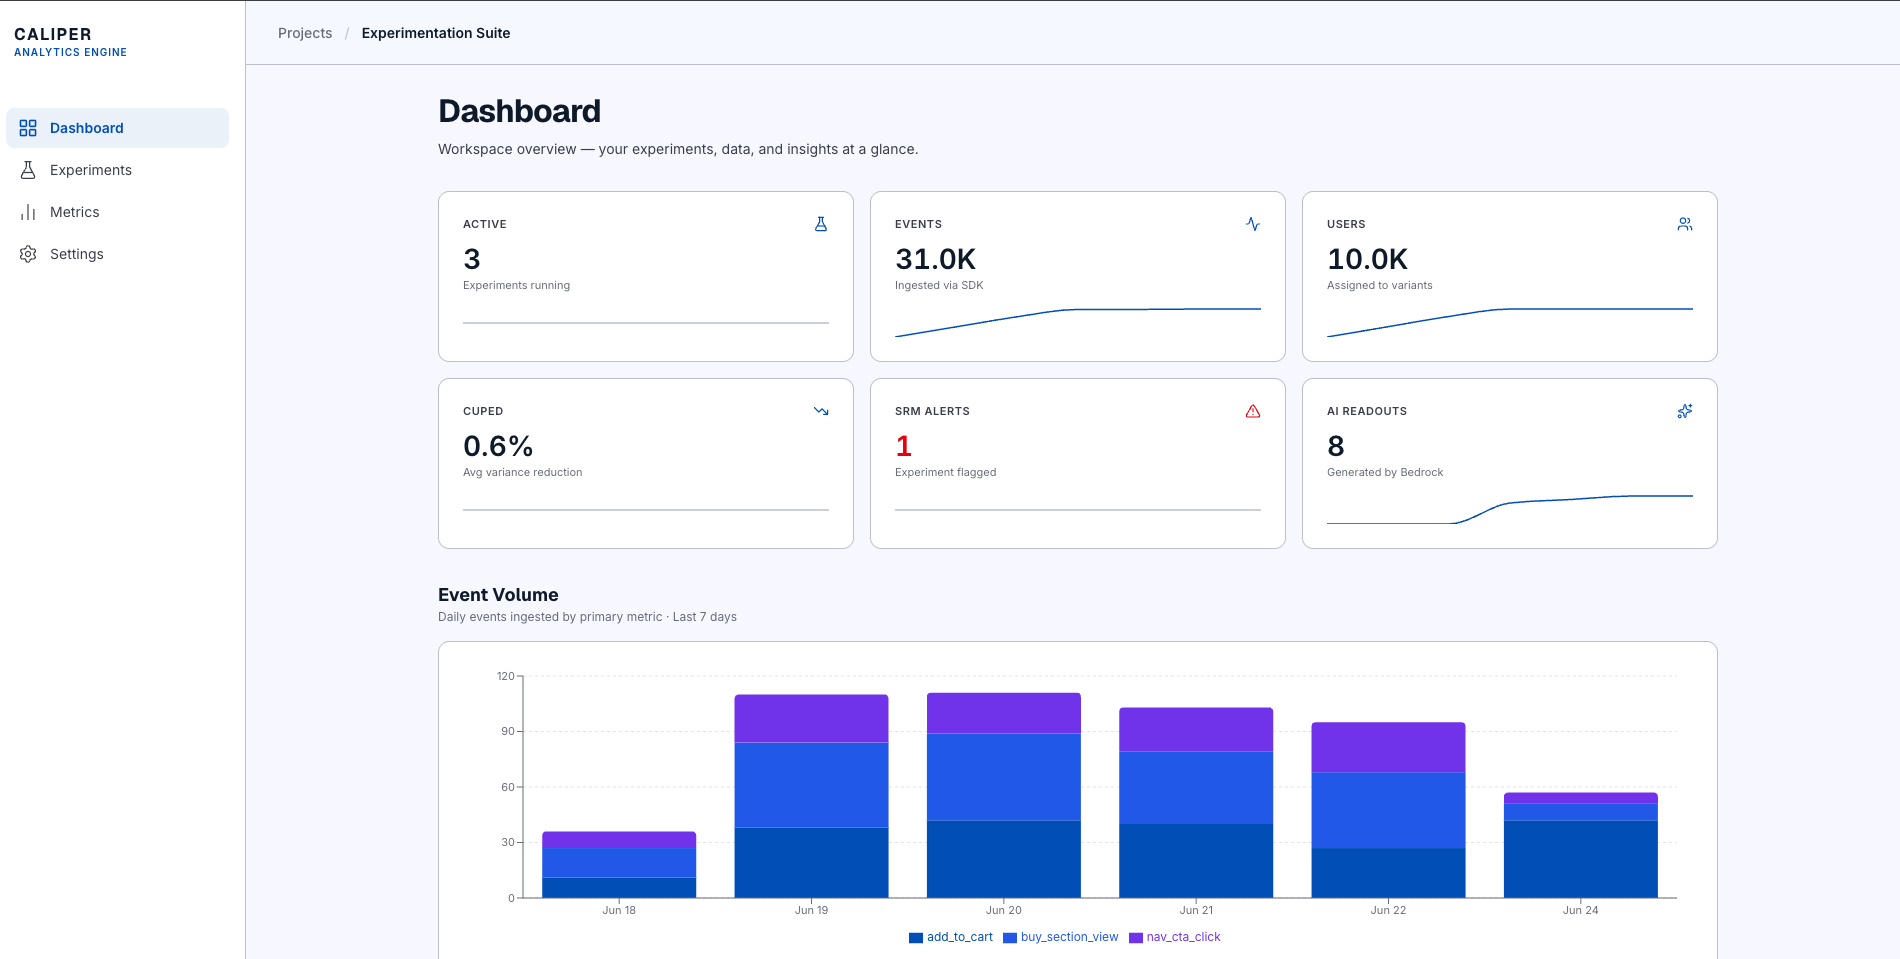
Workspace overview: 6 KPIs (active experiments, events, users, CUPED, SRM alerts, AI readouts) + 7-day event volume chart.
-
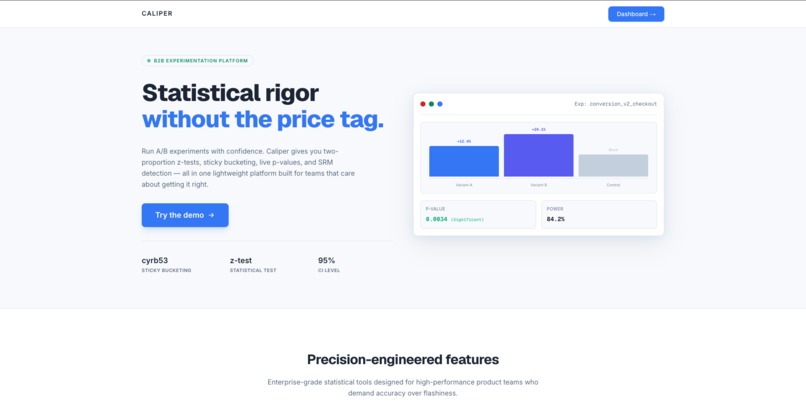
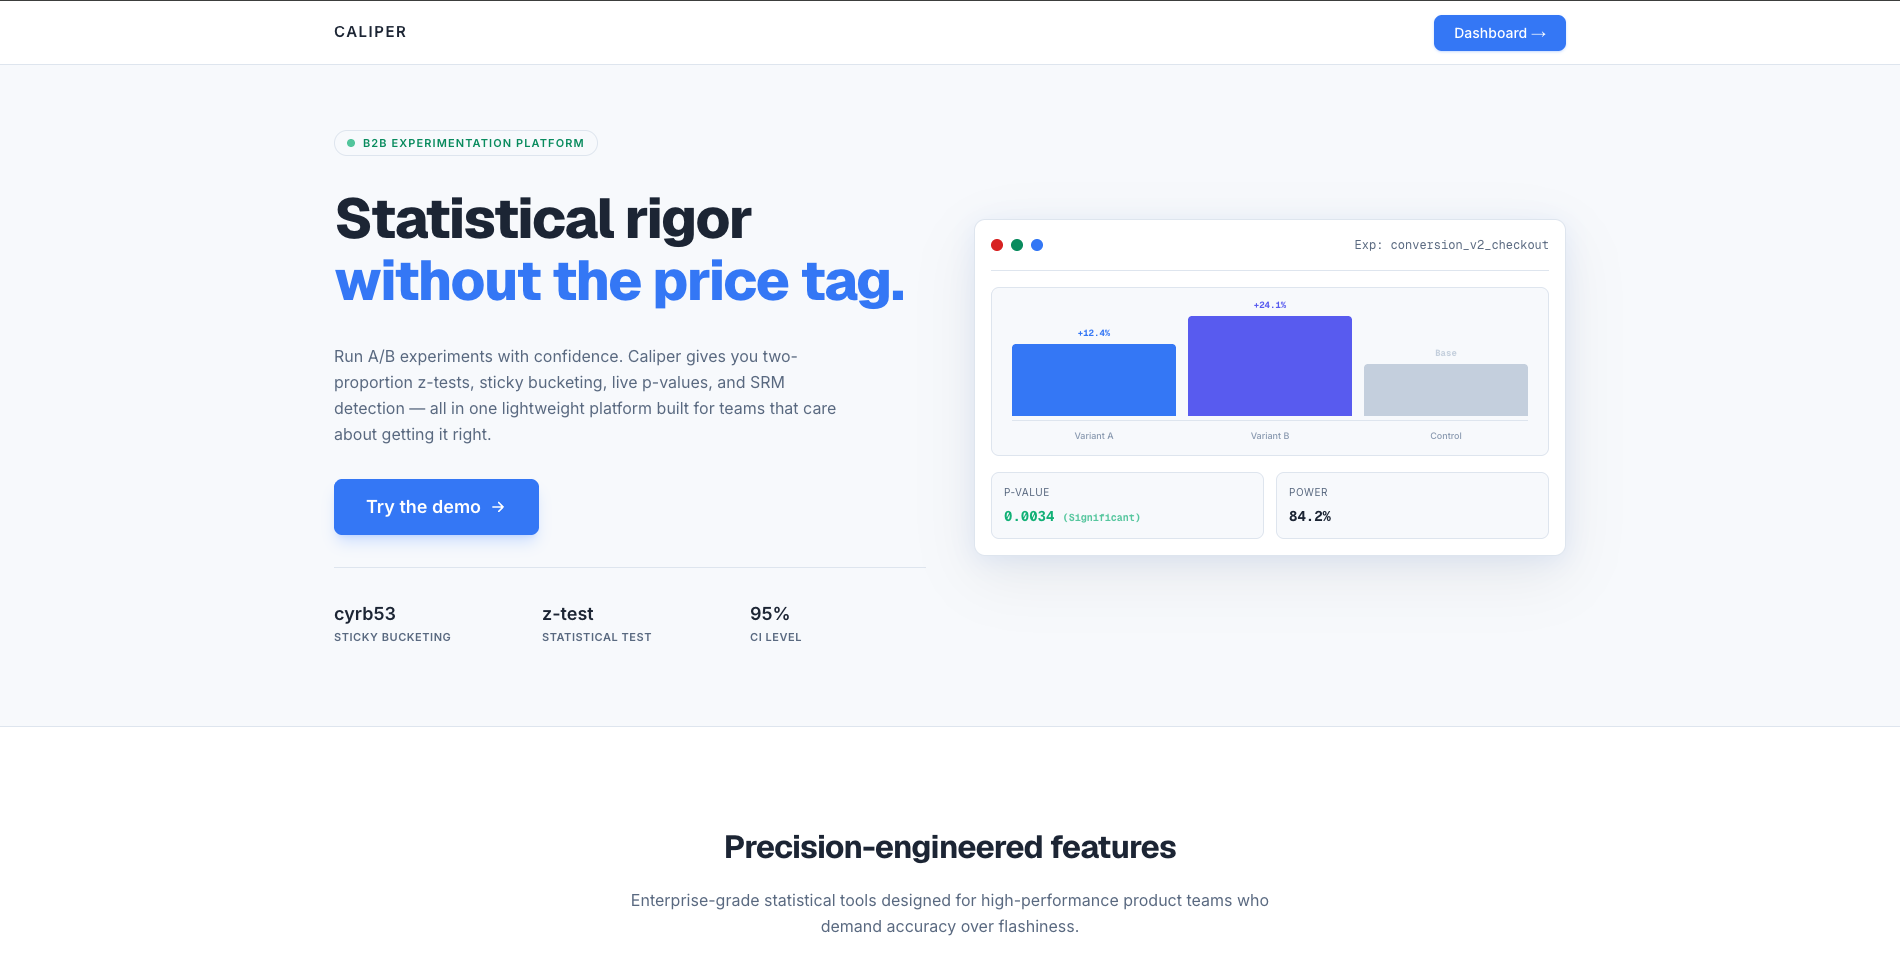
Caliper landing page: B2B experimentation platform with two-proportion z-tests, sticky bucketing, live p-values, and SRM detection.
-
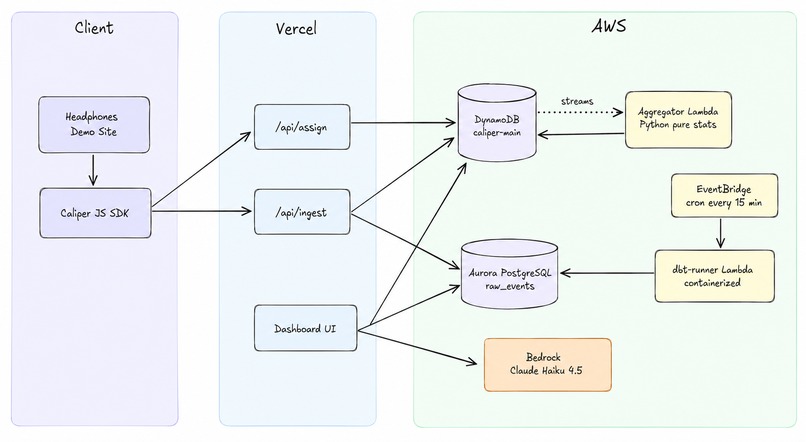
Architecture Diagram
Inspiration
Most A/B testing platforms Statsig, Eppo, Optimizely start at $1,500/month and assume you know which statistics to trust. But the field has a quiet crisis: in industry post-mortems, between 50% and 80% of A/B tests are called too early. Teams peek at running experiments, see a low p-value, and ship the change. Then production metrics regress and nobody knows why.
The math behind this failure is well-documented. Classical p-values aren't valid under repeated monitoring every time you peek, you inflate your false positive rate. Spotify, Airbnb, Netflix, and Microsoft have all published papers documenting this exact failure mode and the techniques that fix it: always-valid sequential testing (mSPRT), variance reduction via pre-experiment covariates (CUPED), and sample ratio mismatch detection (SRM checks).
These techniques exist in big-lab internal platforms. They show up in academic papers from 2013 and 2015. But they're rarely surfaced in the commercial A/B testing tools that smaller teams can actually afford.
That's the gap Caliper aims to fill. Statistical rigor without the price tag and, just as importantly, with an AI layer that interprets the results in plain language so you don't need a statistician on call.
What it does
Caliper is a B2B A/B testing platform with a real-time statistics engine, a scheduled analytics pipeline, and AI-generated experiment readouts. Three running experiments power a live demo:
- Hero CTA Test — measures conversion lift from changing the hero call-to-action copy
- Buy Button Test — measures add-to-cart rate from a buy button style change
- Nav Layout Test — measures engagement from a simplified navigation, deliberately set up with a 60/40 traffic split to demonstrate SRM detection
For each experiment, Caliper computes:
- Classical statistics: two-proportion z-test for binary metrics, Welch's t-test for continuous metrics
- Always-valid sequential statistics: mSPRT (mixture Sequential Probability Ratio Test) with a normal mixture prior produces p-values that are valid no matter how often you peek
- Variance reduction: CUPED using pre-experiment user activity as the covariate
- Quality checks: chi-squared SRM detection with α = 0.0001 (the threshold Statsig uses internally)
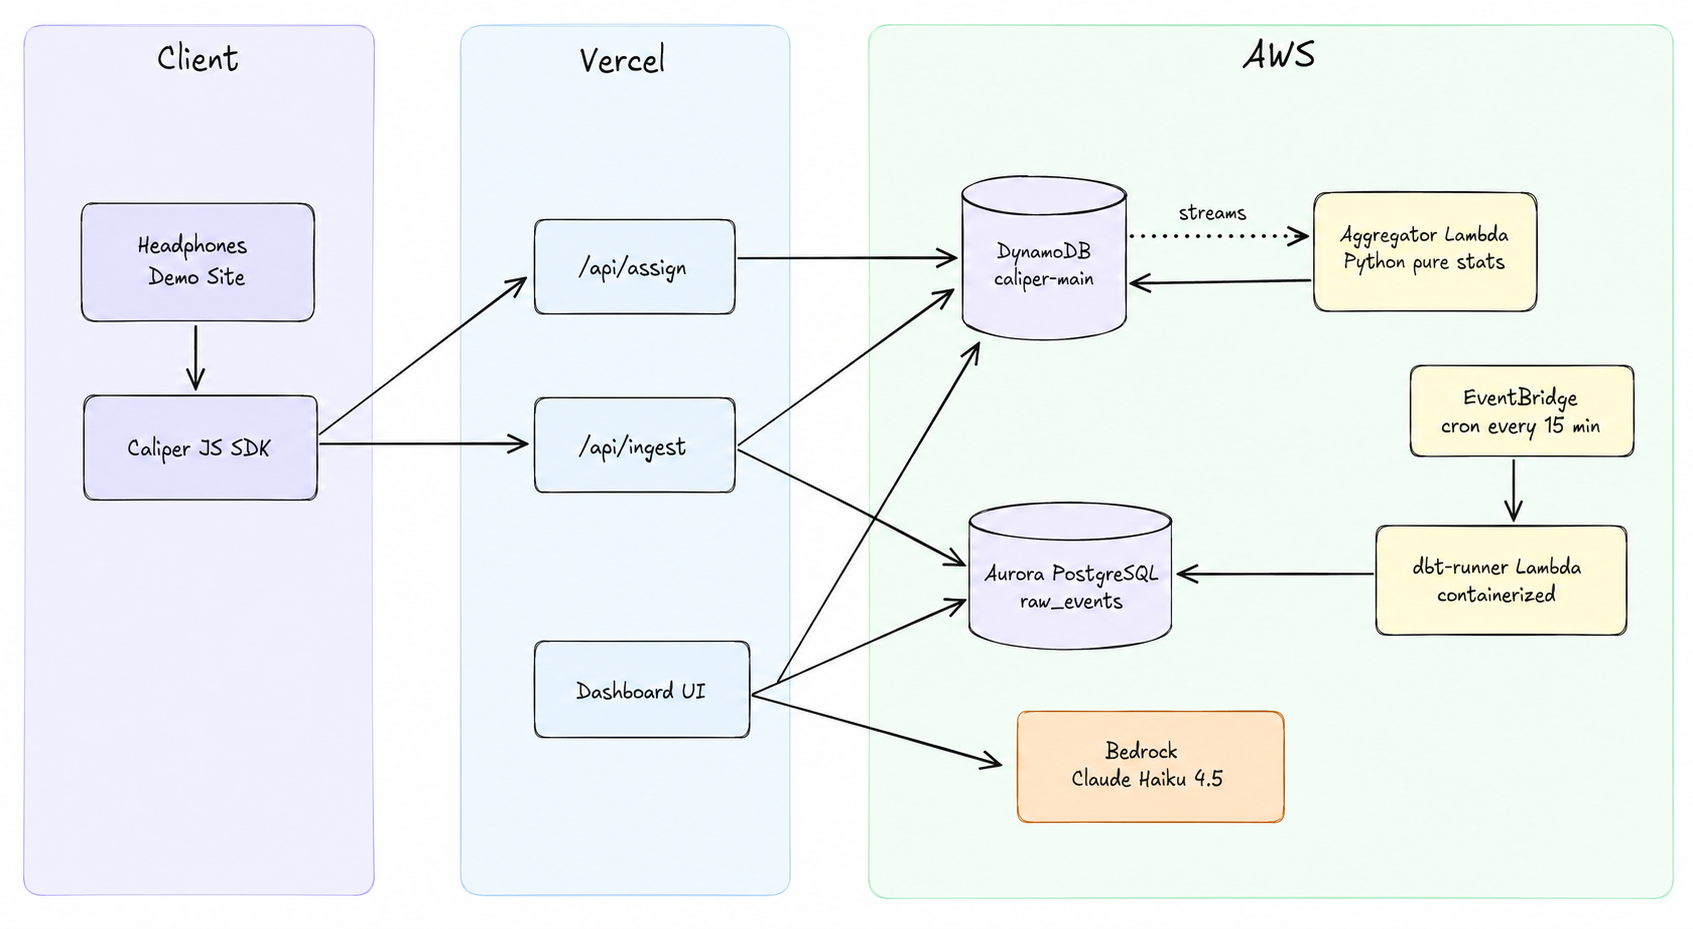
A real-time aggregator Lambda fires on DynamoDB Streams and updates all of these within seconds of new events arriving. A separate containerized dbt Lambda runs every 15 minutes via EventBridge to compute segment-level analytics (lift by country, device, customer tier). When a user requests a readout, the dashboard calls Amazon Bedrock (Claude Haiku 4.5) with the current statistical state including the classical/sequential p-value divergence and any SRM flags and receives a structured verdict back. Verdicts are SRM-aware: if the experiment is broken, the LLM refuses to call a winner.
The dashboard surfaces all of this through six pages: a workspace overview with a three-column experiment comparison grid, an experiments inventory, per-experiment detail pages with Lift Trend / Conversion Rate / Funnel charts, a metric registry, and a configuration browser.
How we built it
The architecture splits Caliper into a hot path (DynamoDB) and a warm path (Aurora PostgreSQL), with the Vercel-hosted dashboard reading from both.
Hot path: The Caliper JavaScript SDK on the headphones demo site calls /api/assign to get variant assignments and /api/ingest to send events. These Next.js API routes write to DynamoDB using a single-table design (caliper-main) with PK/SK and a GSI1. DynamoDB Streams trigger a Python aggregator Lambda on arm64 that re-computes the statistical state for each experiment touched by the batch and writes STATS items back to DynamoDB. Cold start is ~3ms because the Lambda has zero external dependencies — everything statistical is implemented in pure Python.
Warm path: /api/ingest dual-writes every event to Aurora PostgreSQL Serverless v2 via Vercel's waitUntil for fire-and-forget background writes. A containerized dbt Lambda (built from ECR, running x86_64) is fired every 15 minutes by EventBridge. It executes four dbt models — stg_events, stg_assignments, int_user_outcomes, and mart_segment_results — plus 26 dbt tests including a custom assertion that the segment totals match the experiment totals.
AI readouts: A dashboard API route calls Amazon Bedrock with a carefully structured system prompt that requires JSON output and explicitly instructs the model to call out p-value divergence and refuse to call winners when SRM is detected. Claude Haiku 4.5 is the primary model; Amazon Nova Lite is the fallback.
Frontend: Next.js 15 App Router with TypeScript, Tailwind CSS, and Recharts 3.x for all visualizations. Six pages: Dashboard, Experiments (list), Experiment Detail, Metrics, Settings, and a marketing landing page. Server components fetch and render where possible; client components handle interactive charts.
Statistical library: The AWSSDKPandas Lambda layer doesn't include scipy, so I implemented the full statistical stack in pure Python — normal CDF via math.erf, normal PPF via the AS241 rational polynomial (Wichura 1988), regularized incomplete beta via Lentz's continued fraction, and a regularized lower incomplete gamma for chi-squared p-values. All four implementations are validated against scipy reference values via 33 unit tests.
Challenges we ran into
The scipy problem. The aggregator Lambda needs a normal CDF, a normal PPF, an incomplete beta function, and a chi-squared CDF. scipy provides all of these in one import, but it's not in the AWSSDKPandas Lambda layer and packaging it adds 80MB+ to the deployment artifact, increasing cold starts substantially. I rewrote the entire statistical stack in pure Python using math.erf, the AS241 algorithm, Lentz's method, and series expansions for the incomplete gamma. The pure-Python version cold-starts in ~3ms versus ~400ms with scipy bundled.
The mSPRT formula bug. My first implementation of mSPRT had a subtle variance-scaling error — I was using $n^2$ where I needed $n_{\text{eff}}^2$. Unit tests against scipy reference values caught it. The correct closed-form likelihood ratio for the normal mixture is:
$$\Lambda = \sqrt{\frac{s^2}{s^2 + \tau^2}} \cdot \exp\left(\frac{\hat{\delta}^2 \tau^2}{2 s^2 (s^2 + \tau^2)}\right)$$
where $s^2$ is the variance of the difference, $\tau^2$ is the mixture prior variance, and $\hat{\delta}$ is the observed difference in means. Getting this right matters — mSPRT is the technique that distinguishes Caliper from generic A/B testing tools, and a wrong implementation is worse than not having it.
dbt on Lambda — three bugs in a row. Running dbt-core in a Lambda has three separate gotchas:
psycopg2fails to compile from source in the Lambda build environment. Solution: switch topsycopg2-binary.- Docker images built on Apple Silicon include an OCI manifest list that Lambda rejects. Solution: build with
docker buildx build --provenance=false --platform linux/amd64. - dbt's parallelism uses
multiprocessing.synchronize, which requires/dev/shm. Lambda doesn't have/dev/shm. Solution: monkey-patch dbt's multiprocessing primitives to use threading-based equivalents at Lambda startup.
Each of these took several hours to diagnose. None of them have first-page Google answers.
SRM detection on the wrong unit. My initial SRM check was counting raw event totals instead of unique assignments. This gave false positives during high-engagement experiments where one variant happens to fire more events per user. The fix was to compute SRM on COUNT(DISTINCT user_id) per variant and tighten α to 0.0001 (matching Statsig and Eppo's internal standard) to reduce false positives further.
The 15-minute dashboard problem. The dbt analytics layer refreshes every 15 minutes, but live events arrive continuously. Early versions of the dashboard showed segment numbers that lagged the headline stats by up to 15 minutes which is honest but jarring. Solution: be explicit in the UI about which numbers are "live" (DynamoDB) versus "warm" (dbt). Don't pretend warm numbers are real-time.
Accomplishments that we're proud of
End-to-end live system in 22 days. A real user clicks the demo headphones site, the SDK fires events through Vercel, both DynamoDB and Aurora get the writes, the aggregator Lambda recomputes stats, and the dashboard reflects everything within seconds. No mock data, no stubbed responses.
Pure Python statistical library, scipy-free. 33 unit tests, all passing, all cross-validated against scipy reference values. The library is small enough to fit on a sticky note (~300 lines) and accurate enough for production use.
SRM-aware AI readouts. The Bedrock prompt is carefully structured so the LLM refuses to call a winner when SRM is detected. This isn't a generic "summarize the data" wrapper — it's an opinionated layer that knows when results are untrustworthy.
Six-page dashboard with comparative views. A workspace Dashboard with a three-column experiment comparison grid, an Experiments inventory, full Experiment Detail pages with charts and AI readouts, a Metric Registry, and a Settings configuration browser. Built with the same v0-derived design language throughout.
dbt on Lambda actually shipping. Containerized dbt runs every 15 minutes via EventBridge, materializes a four-layer model hierarchy, and runs 26 dbt tests. The three deployment bugs were each instructive enough to write a blog post about.
What we learned
Three lessons stand out:
Scope discipline beats feature breadth. I explicitly cut multi-variant tests, Bayesian methods, feature flags, multi-tenant auth, and billing. Each of those is a real product surface for Statsig and Eppo. Cutting them gave me time to build the statistical core deeply rather than thinly. Better to have one excellent thing than five mediocre ones.
Always-valid sequential testing isn't an academic curiosity. The mSPRT-versus-classical divergence isn't subtle in real data my hero demo experiment has a classical p-value of 0.0061 (looks like a clean winner) and an always-valid p-value of 0.3650 (nowhere close to ship-it). That's a 60× ratio. If you're a PM using a tool that only shows you classical p-values, you'd absolutely ship that change. The math has been published for years; product platforms just haven't surfaced it.
LLMs are good at being opinionated about statistics when you prompt them right. The Bedrock readouts could easily be slop "the treatment shows a 27% improvement, consider shipping." Instead, they correctly identify peeking risk, refuse to call winners when SRM is detected, and explain the math in plain English. The trick was constraining the output format (JSON verdict + structured rationale) and giving the model explicit instructions to call out p-value divergence.
What's next for Caliper
The hackathon scope intentionally excluded several real product surfaces. The honest roadmap:
- Multi-variant (A/B/C/D) testing — the math generalizes naturally to ANOVA and Tukey HSD post-hoc tests; the data model needs minor schema changes.
- Feature flags and kill switches — separate product surface; would integrate with the existing variant assignment infrastructure.
- Customer-defined metric DSL — a small DSL for defining metrics from raw events without writing SQL.
- Bayesian methods alongside frequentist — Beta-Binomial models for binary outcomes, log-normal for revenue metrics.
- Multi-tenant auth and billing — Auth0 + Stripe integration for production deployment.
- Real customer pilot — Caliper's architecture is intentionally production-shaped; the next step is finding a small SaaS team to pilot it.
The longer arc is making the math that big labs use internally available to the rest of the industry without a $20K/year contract. Twenty-two days is a hackathon. The product is whether teams smaller than Spotify get access to the same statistical rigor.
Built With
- amazon-aurora
- amazon-bedrock
- amazon-dynamodb
- amazon-ecr
- amazon-eventbridge
- aws-lambda
- claude
- dbt
- docker
- next.js
- postgresql
- python
- react
- recharts
- tailwindcss
- typescript
- vercel

Log in or sign up for Devpost to join the conversation.