-
-
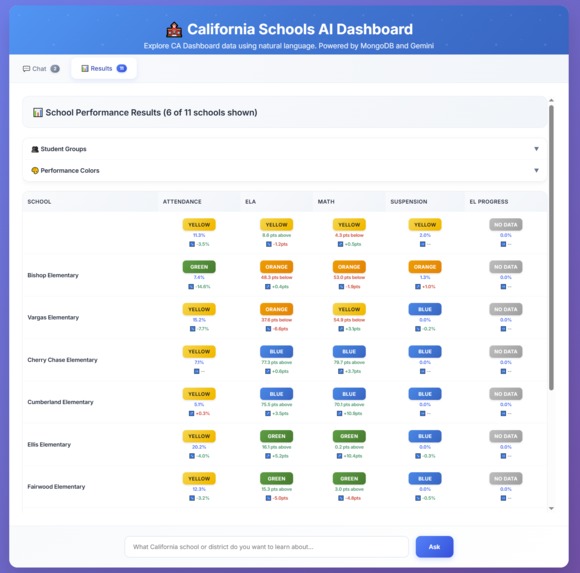
Table view of all school indicators across chosen student group

CA Schools AI Dashboard - Project Story
💡 What Inspired This Project
As someone passionate about educational equity, I discovered a frustrating reality: California's school accountability data is obnoxiously difficult to navigate for the people who need it most.
Every California school district must address performance areas where their schools are performing in the "Red" or "Orange" categories in their Local Control and Accountability Plan (LCAP). This isn't optional—it's state-mandated. Yet the state's official dashboard website makes this critical information nearly impossible to access efficiently.
The problem was stark: To find which schools in a district need attention, you have to:
- Navigate through multiple menus
- Click into individual schools one by one
- Check each performance indicator separately
- Manually track which areas are problematic
- Repeat this process for dozens or hundreds of schools
This process takes hours or even days for what should be a simple question: "Which of our schools need help, and in what areas?"
I realized that parents, school board members, advocacy groups, and even district administrators were being denied access to data that could drive meaningful change—not because the data doesn't exist, but because it's buried in an unusable interface.
🎯 The Vision
I envisioned a tool that could answer questions like:
- "Show me all elementary schools in our district with concerning math performance for Hispanic students"
- "Which schools have multiple Red indicators that need immediate attention?"
- "How are English learners performing across our high schools?" And I wanted it all in one place for the whole district
🛠 How I Built It
Data Architecture with MongoDB
Traditional relational databases would have struggled with the complex, nested nature of California's school data. Each school has:
- 7 different performance indicators
- 17+ demographic student groups
- Historical performance data
- District and county hierarchies
MongoDB's document-based structure was a game-changer. Instead of complex JOIN operations across multiple tables, I could store each school as a single document with nested student group data. This meant:
- Faster queries when filtering by multiple criteria
- Intuitive data structure that mirrors how educators think about schools
- Flexible schema that adapts as new indicators are added
- Efficient aggregation for district-wide analysis
AI-Powered Natural Language Interface
The breakthrough came with Google's Vertex AI and Gemini 2.0 Flash. Instead of forcing users to learn database query syntax, I could let them ask questions naturally.
The AI handles the complex translation from:
"Schools in Sunnyvale with math issues for Hispanic students"
To:
{
  district_name: "sunnyvale",
  indicators: ["math_performance"],
  student_groups: ["HI"],
  colors: ["Red", "Orange"]
}
Serverless Deployment Magic
Google Cloud Run made this project possible as well
The free tier allows me to provide this as a true public service without ongoing costs—exactly what a tool for educational equity should be.
🧠 What I Learned
AI as a Coding Partner
I extensively used Claude (Anthropic) and Gemini not just for the application's AI features, but as coding assistants throughout development. This accelerated development dramatically and taught me:
- Prompt engineering for technical problem-solving
- Iterative refinement of AI-generated code
- Hybrid human-AI development workflows
Working as a team using github for the first time was also challenging and still a learning curve.
MongoDB's Power for Public Data
Working with MongoDB revealed how perfectly document databases suit government data:
- Irregular data structures that change over time
- Nested relationships that are natural to the domain
- Query flexibility for unknown future use cases
🚧 Challenges We Overcame
The Great Frontend-Backend Translation Challenge
The biggest technical hurdle was getting the frontend and backend to communicate effectively about complex data structures.
The problem: MongoDB was returning rich, nested documents, but the frontend table view expected flat, predictable data structures. We spent significant time debugging why:
- Data was being passed correctly but not displaying
- Tables were rendering empty despite successful queries
- Student group filtering wasn't working as expected
The breakthrough: Realizing that different performance indicators lived in different parts of the data structure. Some indicators existed for all students, others only for specific demographic groups (like English Learner Progress, which only exists for English Learners).
Data Structure Discovery
California's education data is... complex. Each CSV file had different column names, different ways of representing the same concepts, and different approaches to missing data. MongoDB's flexibility was crucial here—I could import the data as-is and clean it up iteratively.
Rate Limiting for Public Access
Balancing public accessibility with cost control required implementing smart rate limiting that prevents abuse while allowing legitimate research use.
🌟 Impact and Future
This project demonstrates how modern AI and cloud technologies can democratize access to public data. By removing technical barriers, we can:
- Empower parent advocacy with data-driven insights
- Support evidence-based policy making
- Enable community organizing around educational equity
- Accelerate compliance workflows for school districts
The tool has already saved hours of manual data gathering and revealed patterns that weren't visible through the state's interface.
🔮 What's Next
- Add trend analysis to identify improving vs. declining schools
- Integrate additional data sources like funding and demographics
- Improve AI Functionality - open it up This is the main one; right now the AI isn't as chatty as I'd like, so it's really structured and rigid with what it's able to do. I want to be able to compare across geographical areas, and find other things online and compare that to the academic data it has.
Most importantly: Continue proving that public data should be publicly accessible, and that technology can be a force for educational equity.
Built With
- css3
- docker
- flask
- flask-limiter
- github
- google-cloud
- google-cloud-run
- google-vertex-ai
- gunicorn
- html5
- javascript
- mongodb
- mongodb-atlas
- pymongo
- python


Log in or sign up for Devpost to join the conversation.