-
-
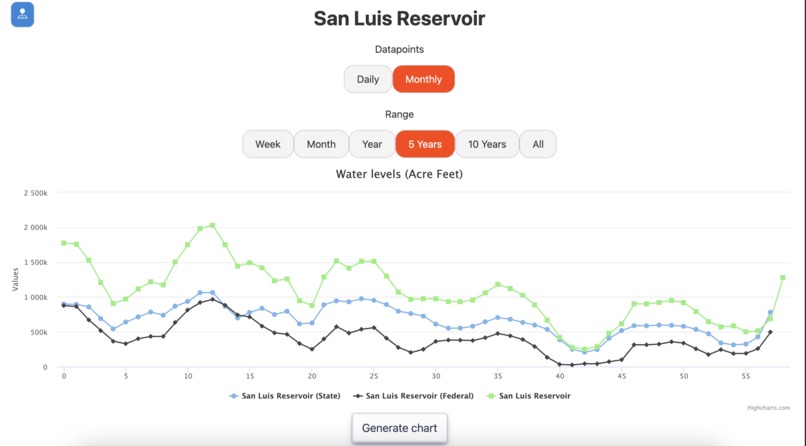
water levels
-
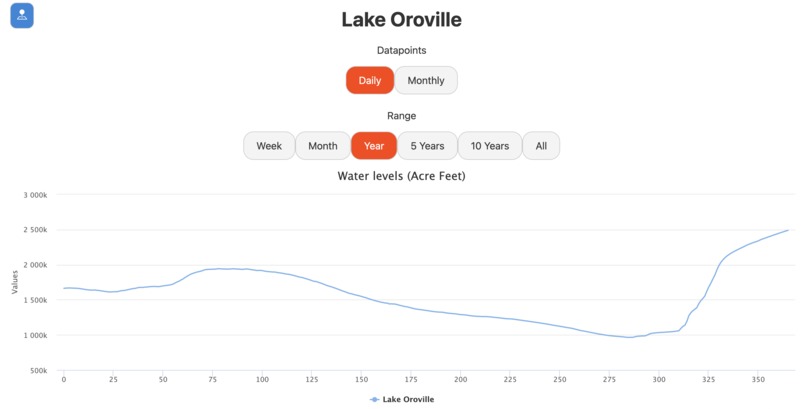
reservoir
-
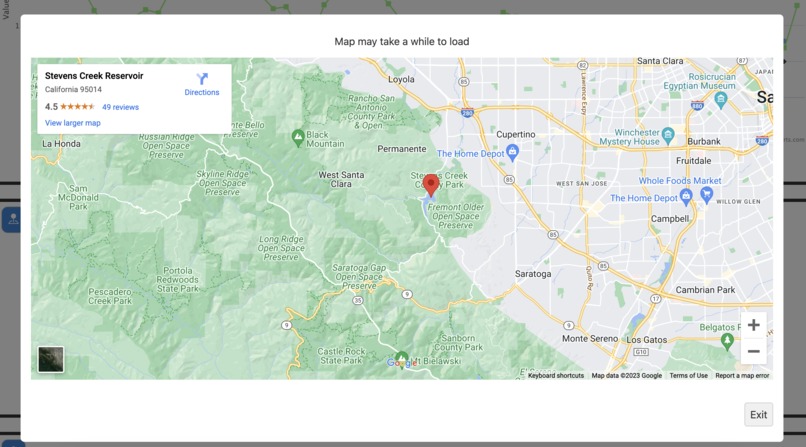
maps
Inspiration
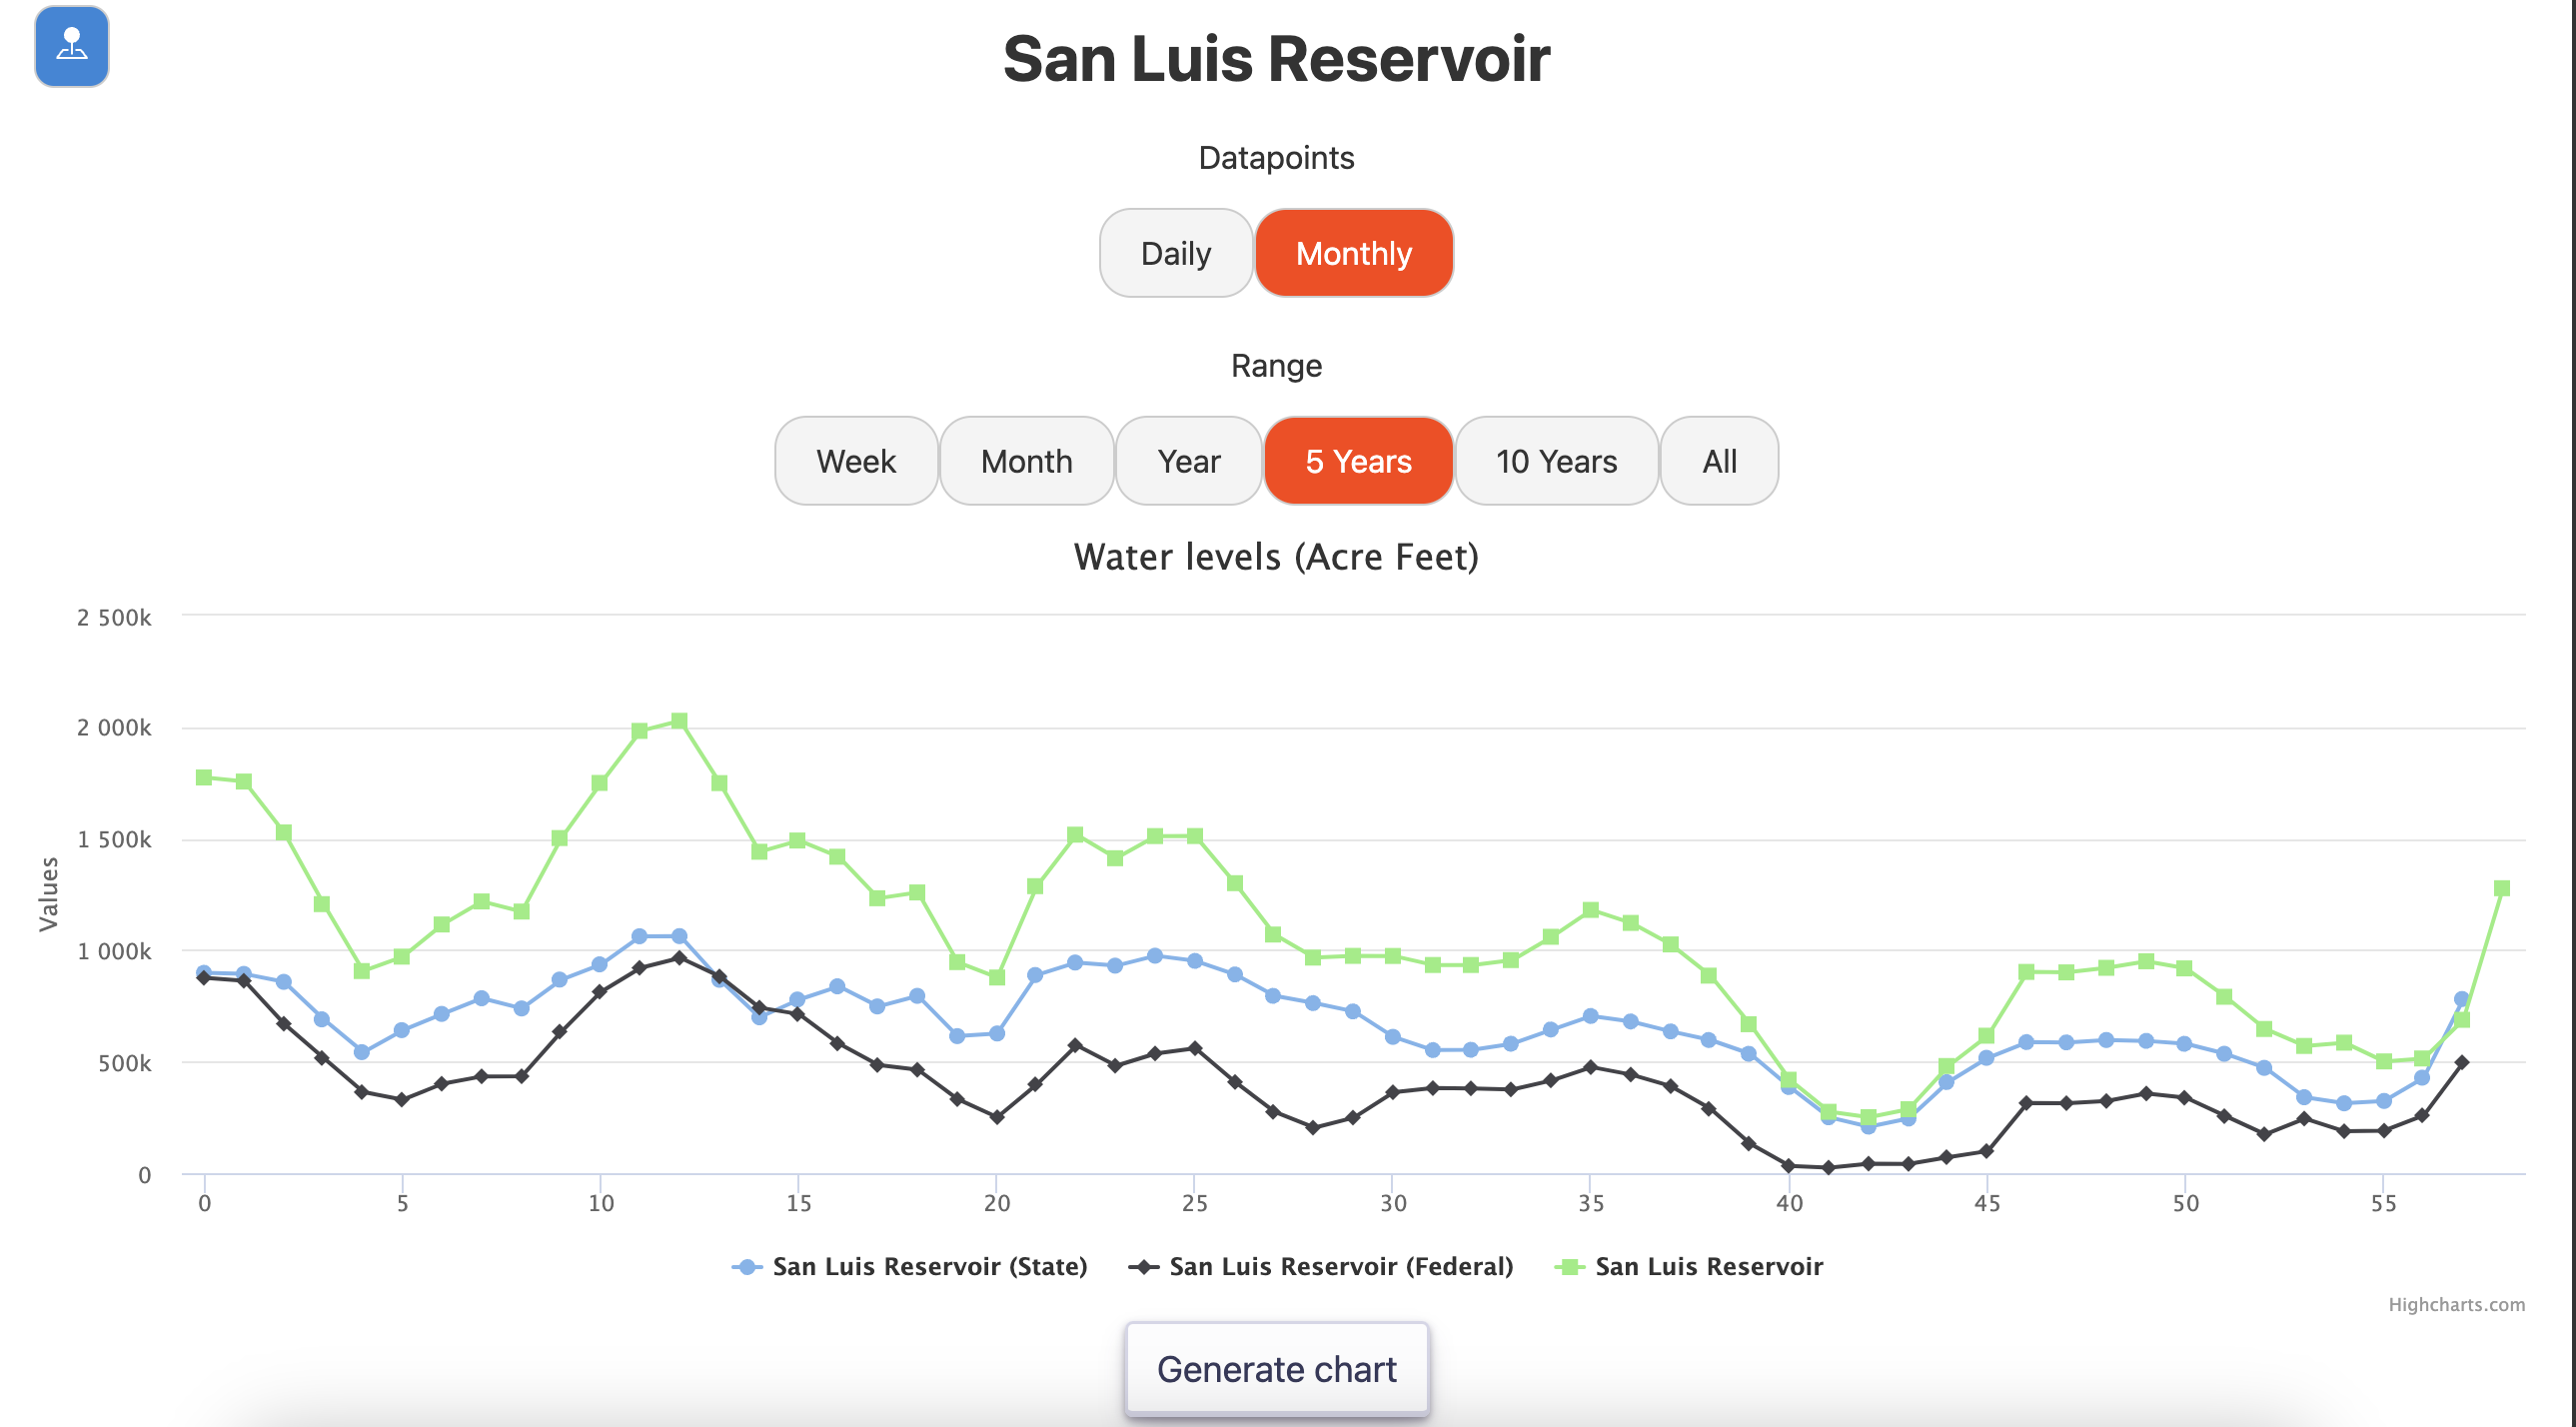
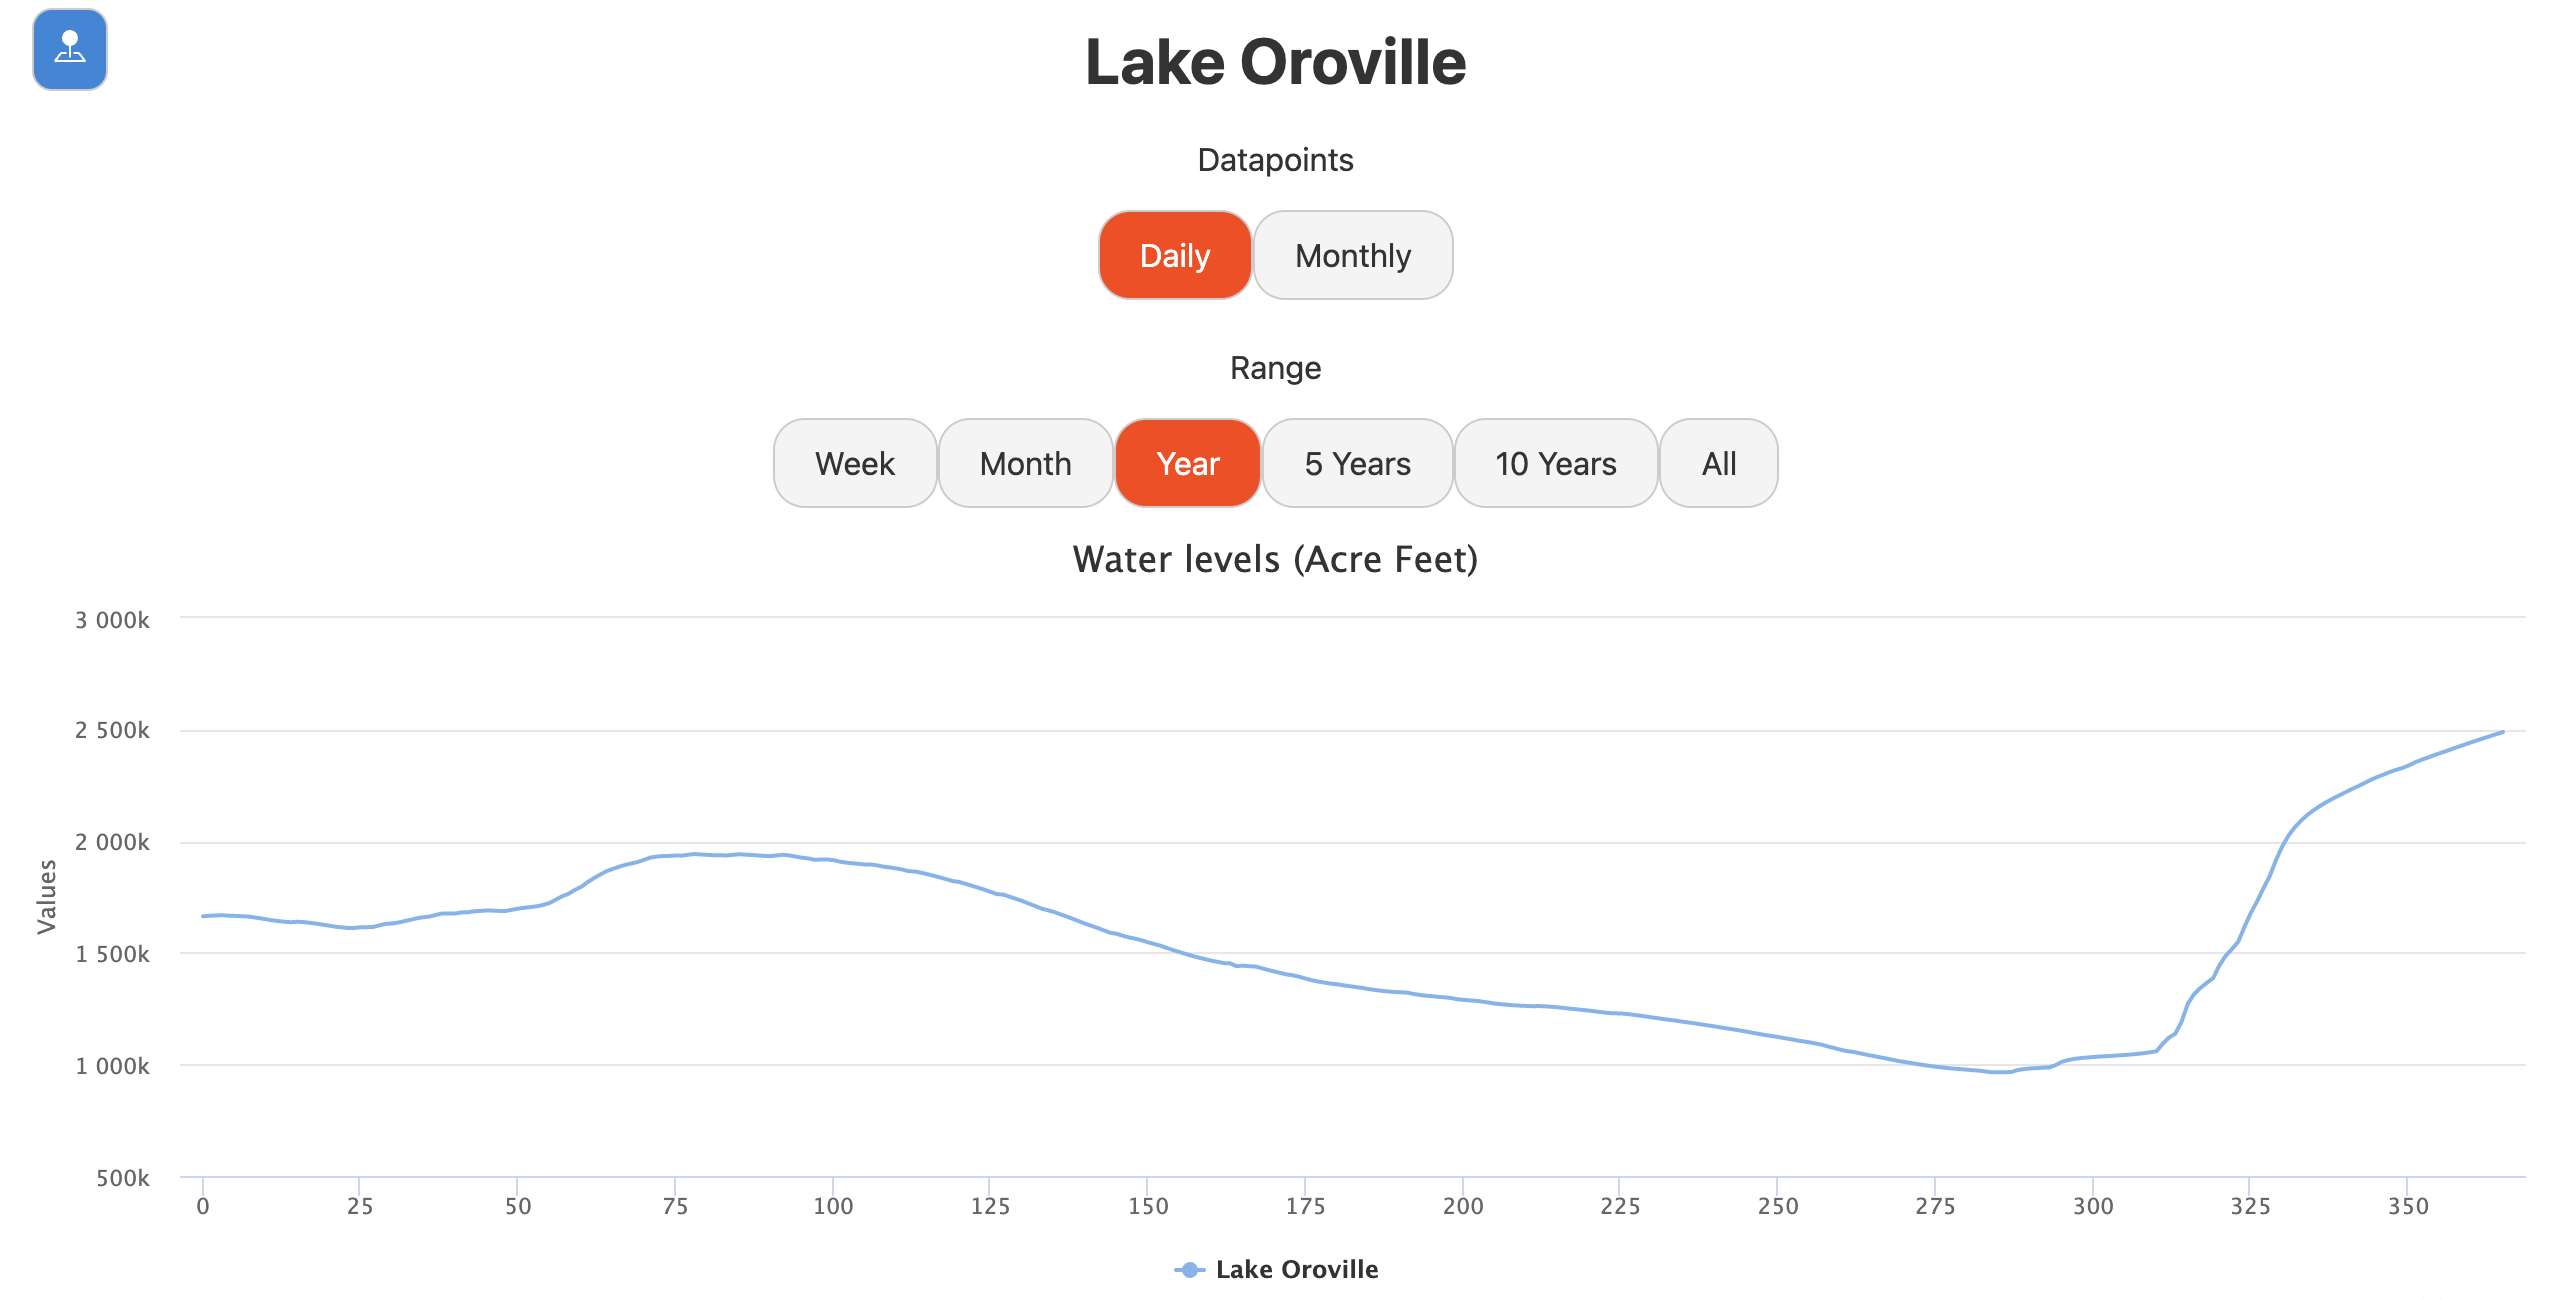
California is always struggling with droughts and low water levels. It is difficult to find a place to compare the current water levels to historical droughts, and this app can allow those interested to visually study patterns about California water levels.
What it does
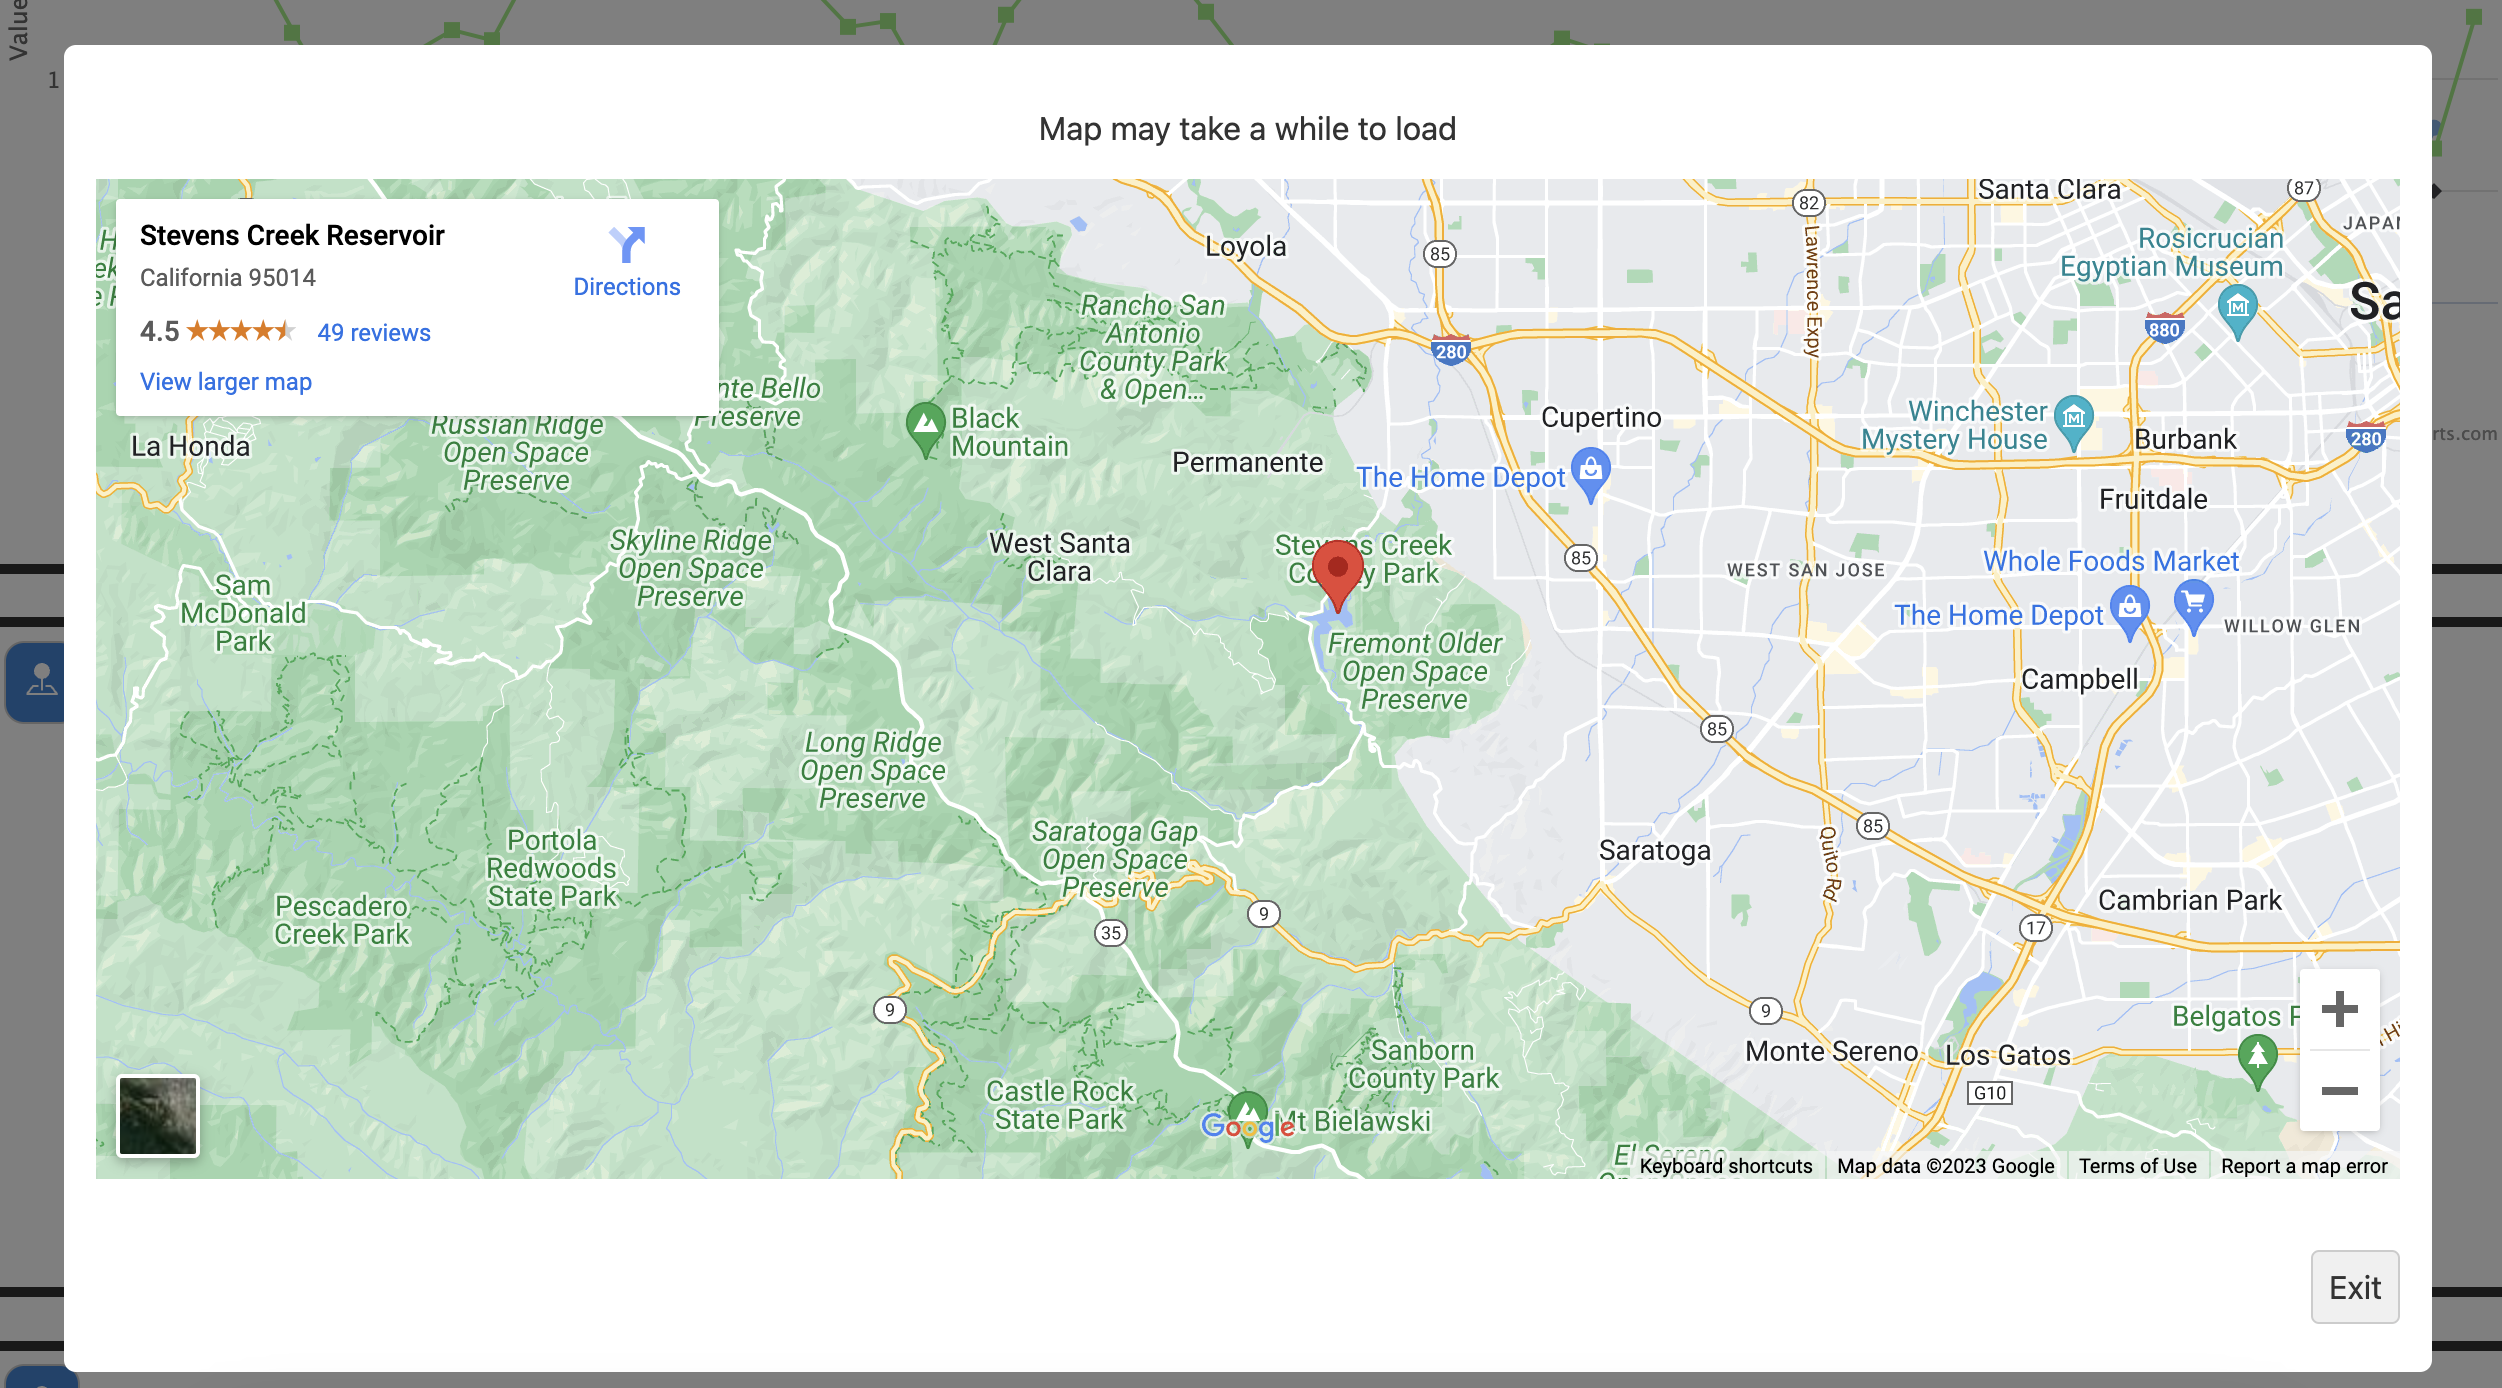
The app pulls reservoir data from link, and the user is able to select how they want to see the data graphed. The user is also able to view where the reservoir is on a map.
How we built it
I built the single page application using svelte and typescript, which I have previous experience, but I also learned and used highcharts and google maps.
Challenges we ran into
One challenges that I ran into when fetching data from the website was being blocked from CORS. I had to use a CORS proxy as a bridge to access the data from the server. Another problem that arouse was embedding google maps into the application without an API key, and configuring the X frame options to allow iframes.
Accomplishments that we're proud of
I am proud of being able to finish the project despite using many new tools. I am also proud that the application is functional and practical.
What we learned
I learned about fetching data with javascript, using highcharts, as well as embedding google maps with iframes.
What's next for California Reservoir Viewer
I plan on expanding the application to include data from places outside of California. Also, the application can be optimized with things like Ajax, which were unable to be implemented due to time constraints.
Built With
- cdec
- google-maps
- highcharts
- svelte
- typescript
Log in or sign up for Devpost to join the conversation.