Inspiration
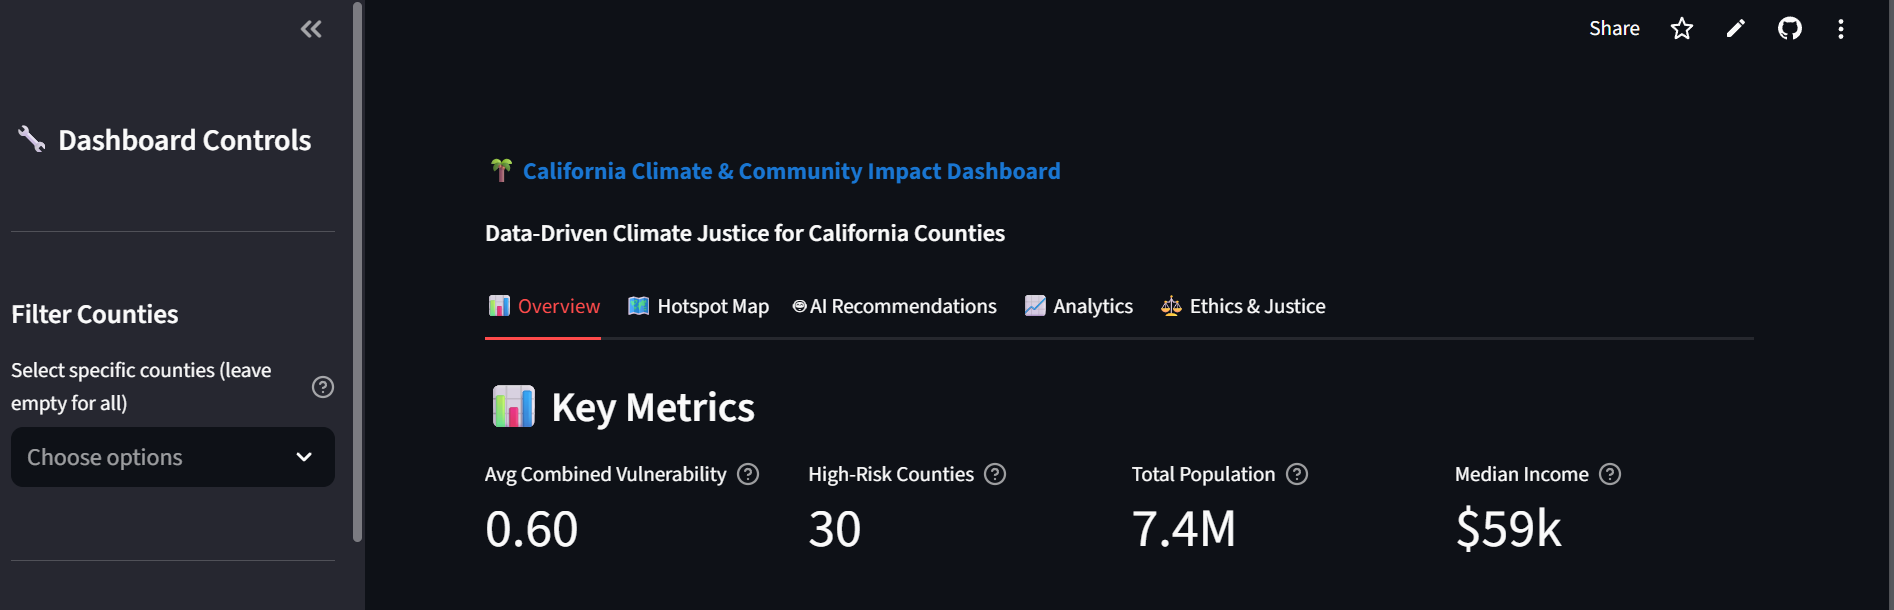
I was inspired by Splunk's enterprise solution to tracking enterprise data, but I wanted to add a climate/social justice twist to it by creating a solution that converges two data sets (socioeconomic and climate) into one result that policymakers and engineers can reference.
What it does
Check GitHub Writeup
How we built it
Check GitHub Writeup
Challenges we ran into
The biggest challenge I faced was definitely data formatting and mapping. This is because the climate and socioeconomic datasets come from totally different systems and getting all that information to “speak the same language” required a lot of cleaning, normalization, and debugging.
Accomplishments that we're proud of
The moment the map finally loaded correctly was incredibly rewarding because it was a visual confirmation that the system worked. We built something that transforms thousands of raw data points into a meaningful story about climate inequality in California.
What we learned
On the technical side, I learned how to design a complete machine learning pipeline from the ground up. From collecting and cleaning raw climate and socioeconomic data to training and testing a model that identifies patterns of vulnerability across California. I also learned how to connect that analytical process to a geospatial visualization layer, using libraries like GeoPandas and Plotly to turn complex model outputs into intuitive, interactive maps.
What's next for ClimateJustice AI
Check GitHub Writeup
Built With
- chatgpt
- claude
- geopanda
- panda
- pandas
- plotly
- python
- scikit-learn
- streamlit


Log in or sign up for Devpost to join the conversation.