-
-
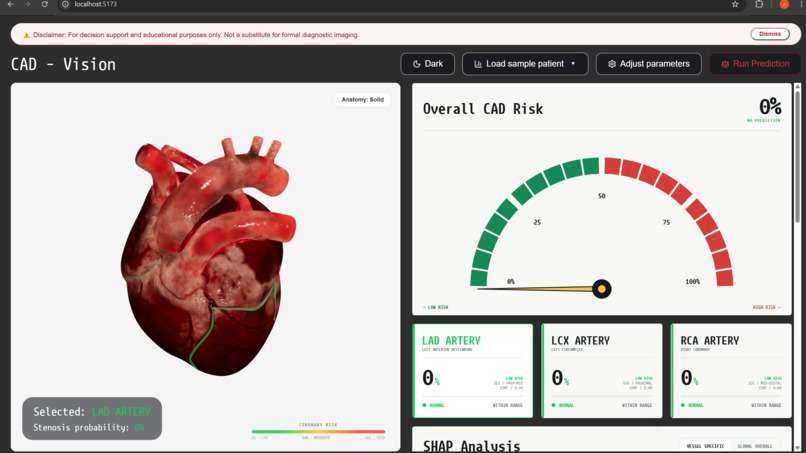
Dashboard
Inspiration
Coronary artery disease is difficult to understand from raw clinical values and model probabilities alone. We wanted to build a system that does more than output a risk score — it should help users see where the risk lies, understand why the model made its prediction, and interact with the result visually. That led to CAD-Vision: a decision-support prototype combining machine learning, explainable AI, and interactive 3D visualization.
What it does
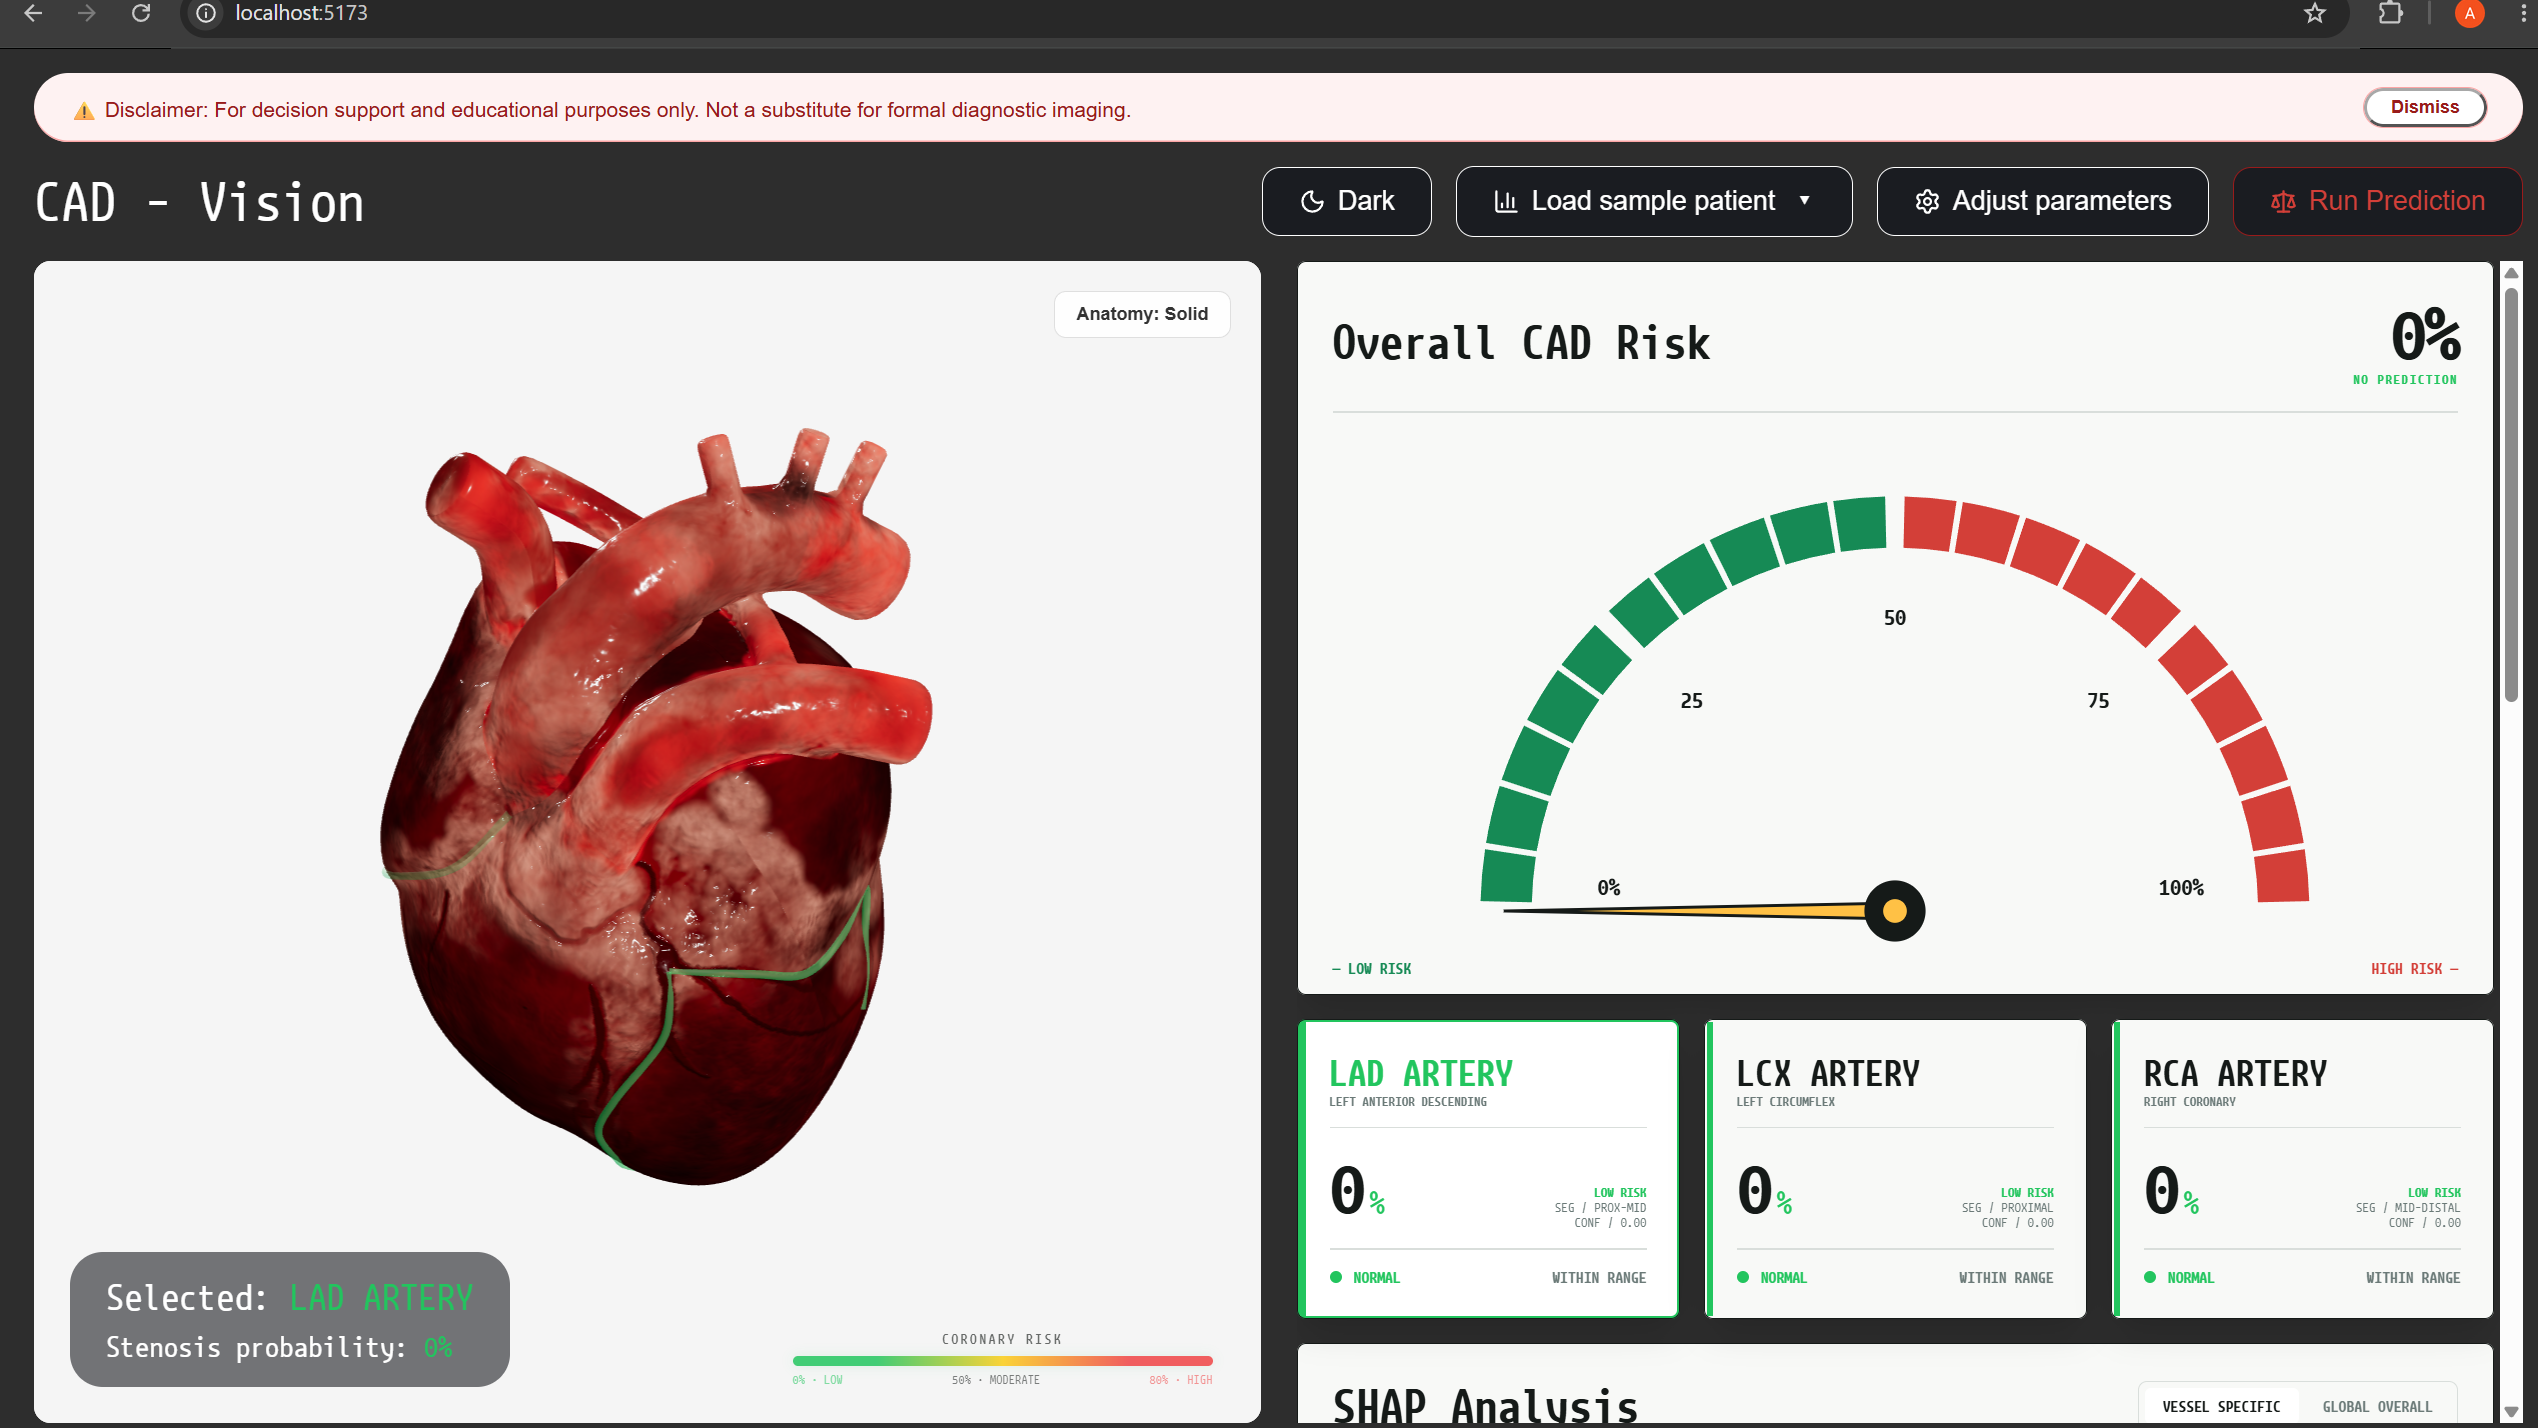
CAD-Vision predicts overall coronary artery disease risk along with stenosis probabilities for the LAD, LCX, and RCA arteries. Users can enter patient clinical data or load sample patients, run predictions, and view the results through an interactive dashboard. The application includes:
- Overall CAD risk prediction
- Individual LAD, LCX, and RCA stenosis probabilities
- Interactive 3D heart and coronary artery visualization
- Risk-based artery highlighting
- SHAP-based local explanations for individual patients
- Global feature importance across reference patients
- Plain-language narratives explaining the strongest model influences
- Automatically derived values such as BMI and obesity status The system is intended for educational and decision-support purposes, not as a replacement for formal medical diagnosis. ## How we built it We built CAD-Vision as a full-stack application with separate machine learning, backend, and frontend layers. The prediction pipeline uses trained models for four targets: Cath, LAD, LCX, and RCA. The backend is built with FastAPI and handles input validation, feature transformation, derived features, model loading, predictions, and SHAP explanations. For explainability, we integrated SHAP to generate patient-specific feature contributions and global feature importance. Since the models use a combination of numerical and categorical clinical features, we added a compatibility layer that temporarily encodes categorical values for SHAP while preserving the original model input format. The frontend was built with React, TypeScript, Vite, Zustand, Three.js, and React Three Fiber. Prediction results are mapped directly onto the dashboard and 3D coronary visualization. The complete system is containerized using Docker Compose, allowing the frontend and backend to run together in a reproducible environment. ## Challenges we ran into One major challenge was integrating independently developed machine learning models with the backend while maintaining the exact feature names, order, encodings, and preprocessing expected by the models. We also encountered issues when moving from stub models to real model artifacts. Some models used LightGBM, which required additional runtime dependencies inside Docker, including the Linux OpenMP library. SHAP integration created another challenge because its tabular masker could not directly handle categorical string values such as "Male" or "N". We solved this by creating a temporary numeric representation specifically for SHAP and converting those values back before passing them to the actual trained models. Another challenge was keeping frontend, backend, and model development synchronized across multiple branches while avoiding breaking changes during integration. ## Accomplishments that we're proud of We are especially proud that CAD-Vision became a complete working system rather than just a standalone ML model. Some of our key accomplishments include:
- Successfully integrating four real trained prediction models into the application
- Building a functional end-to-end pipeline from patient input to prediction to visualization
- Creating an interactive 3D coronary artery representation linked to model outputs
- Implementing real SHAP explanations for all four prediction targets
- Generating both local patient-level explanations and global feature importance
- Converting SHAP outputs into readable natural-language explanations
- Supporting sample patient workflows for rapid demonstrations
- Creating a Dockerized setup that runs the entire stack consistently ## What we learned This project showed us that building a machine learning application involves much more than training a model. A large part of the work is ensuring that data formats, preprocessing, APIs, model artifacts, frontend state, and visualization all agree on the same contract. We also learned the importance of explainability in medical AI. A probability by itself is not very useful if the user cannot understand what influenced it. Integrating SHAP helped us move from a black-box prediction system toward something more interpretable. On the engineering side, we gained experience with FastAPI, React, TypeScript, Docker, model serialization, SHAP, LightGBM integration, API testing, Git workflows, and multi-component system integration. ## What's next for CAD-Vision The next step would be to validate the system on larger and more diverse datasets and perform stronger clinical evaluation. We would also like to add:
- What-if analysis to show how changing patient variables affects predictions
- Faster SHAP computation through cached explainers
- More advanced artery-level and cross-sectional 3D visualization
- Improved uncertainty and confidence displays
- Historical patient comparisons
- Better model monitoring and evaluation metrics
- Deployment to a secure cloud environment
- Integration with clinical data systems and electronic health records Long term, CAD-Vision could evolve into a more comprehensive explainable cardiovascular decision-support platform that combines prediction, visualization, and interpretable AI in one interface.
Built With
- css
- docker
- fastapi
- git
- github
- html
- javascript
- joblib
- lightgbm
- numpy
- pandas
- pydantic
- python
- react
- react-native
- scikit-learn
- shap
- three.js
- typescript
- uvicorn
- vite

Log in or sign up for Devpost to join the conversation.