-
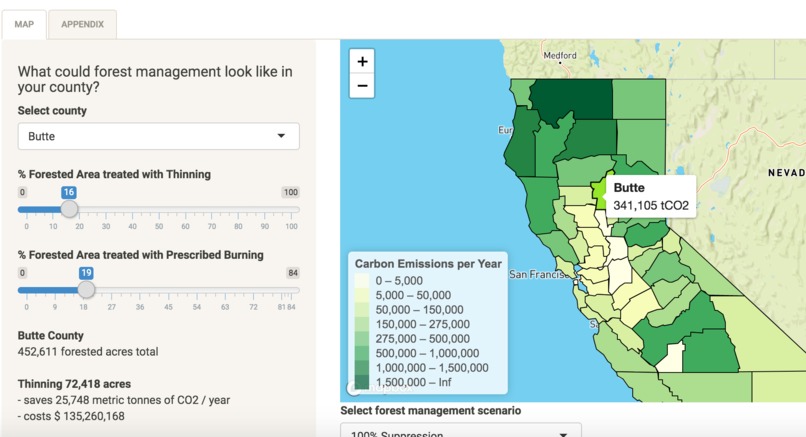
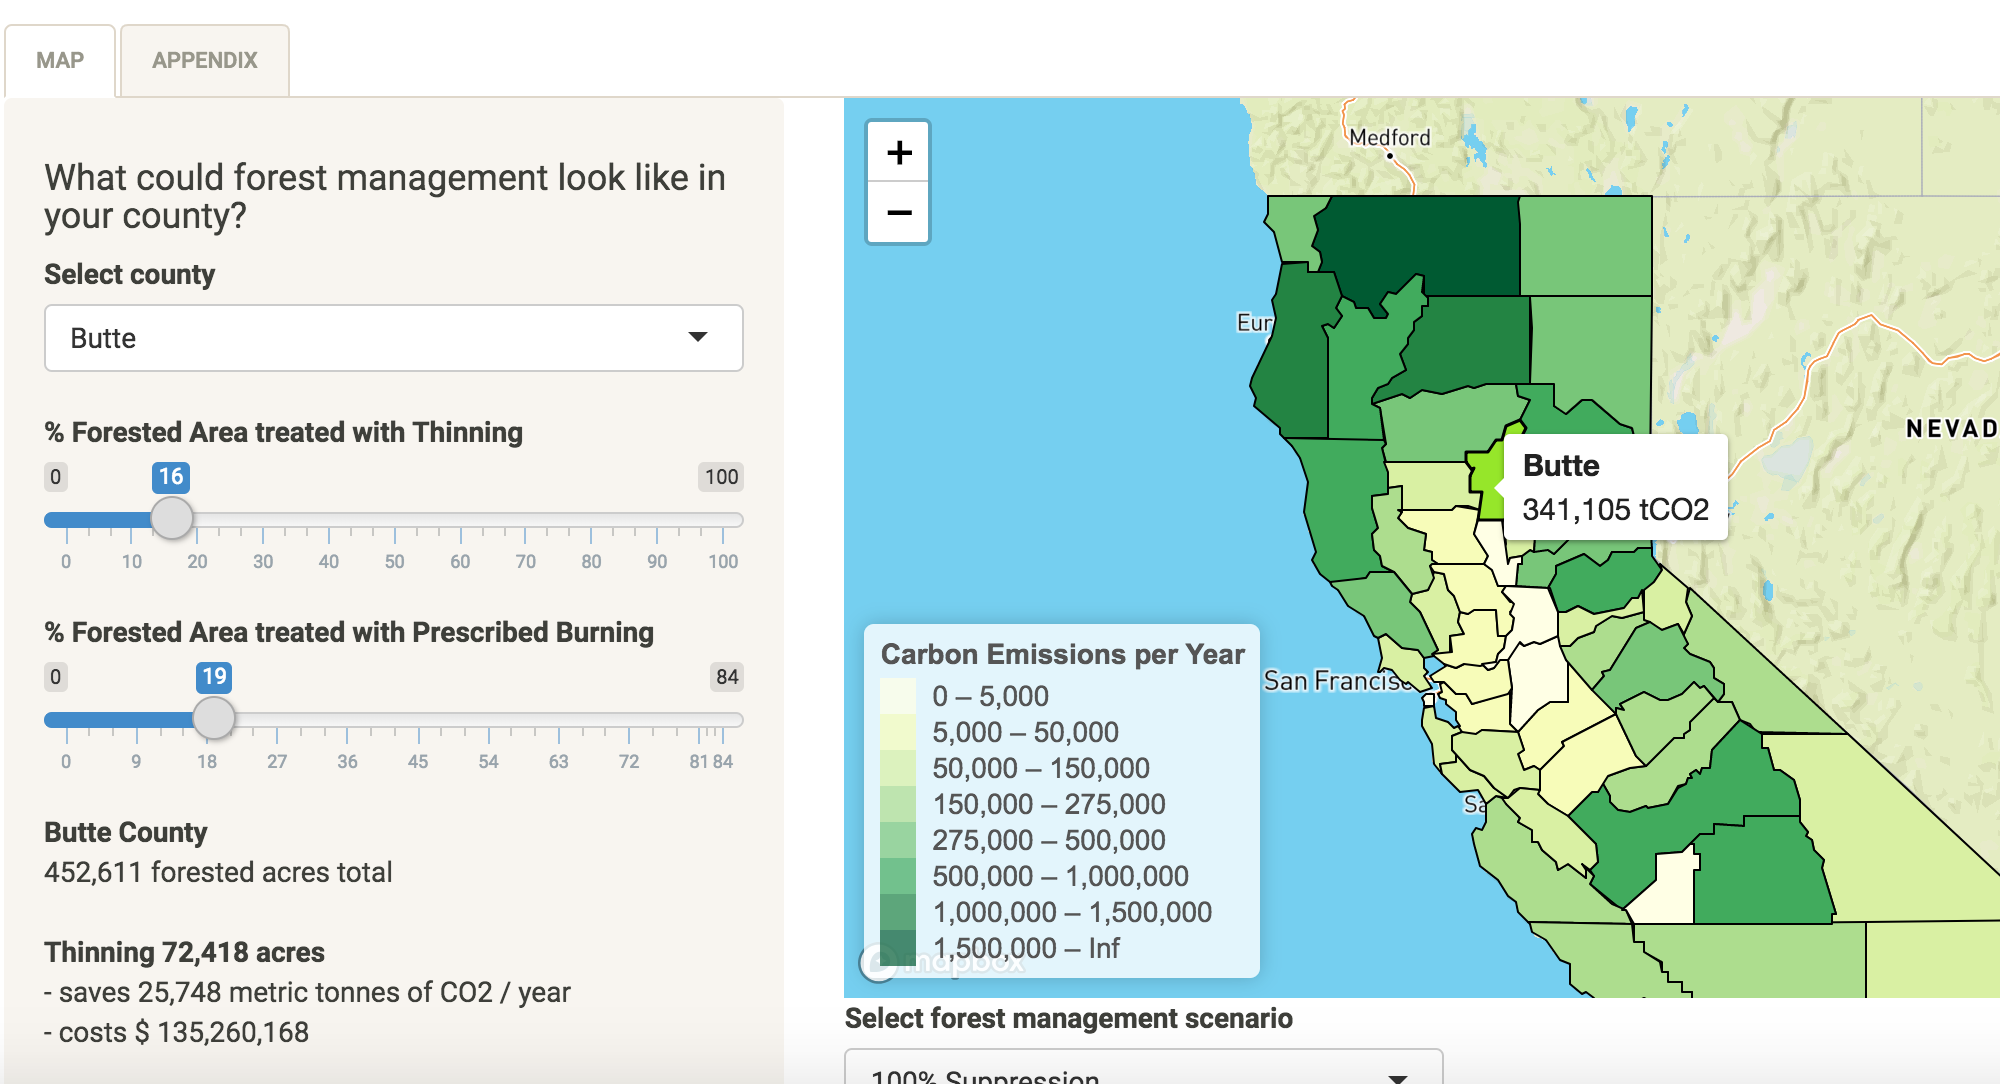
A glimpse at our interactive web map
VIEW OUR PROJECT
an interactive web map to calculate forest management carbon emissions by county
Inspiration
As students in the Atmosphere/Energy program, we are passionate about climate change mitigation and reducing carbon emissions for environmental and health purposes. One of the many impacts of climate change has been increasing California's sensitivity and susceptibility to wildfires, and we must be proactive in reducing wildfire risk.
We are both Northern California natives, from Sonoma and Humboldt Counties. Amy is from Santa Rosa, where her hometown was deeply impacted by the Tubbs Fire back in 2017. Since then, she has focused multiple projects on analyzing wildfires in California. Eli grew up helping his family with fuels reduction work from the time he could walk, and has worked on and off with his dad's thinning crew for nearly a decade. Eli's parents actually met while working on a wildfire, his dad as a hazard tree faller and his mom on a Forest Service hand crew, making his passion for the subject a sort of family tradition. These experiences have led us to this hackathon and to this specific project.
Project Overview
California's AB 32 set the goal to reduce greenhouse gas emissions to 1990 levels by 2020, which is 431 million metric tonnes of CO2 equivalent. In 2016, California first reached this goal four years earlier than its initial target. However, these state estimates do not include emissions from wildfires. The California Air Resources Board estimated that in 2018, 45.5 million metric tonnes of CO2 were emitted from wildfires, pushing us to fail to meet our state emission reduction goals. As wildfire severity in California increases, we must acknowledge the magnitude of the associated emissions and act accordingly.

The frequency and severity of wildfire in the western U.S has been growing for decades, driven by over 100 years of fire suppression policy and ever worsening climate change.[1] However, more progressive forest management practices such as thinning and prescribed fire have been gaining traction as means of preventing such high severity conflagrations. Treating an area with prescribed burning or thinning has shown to significantly reduce the severity of wildfire that may later burn through that area.[1] Lower severity fires kill fewer trees [2] and are more easily kept from destroying human property and life. While these benefits of prescribed fire and thinning have been well established, their potential impact on net carbon dioxide (CO2) emissions has been a point of investigative contention, with some studies suggesting that such practices reduce net CO2 emissions to the atmosphere while other studies suggesting otherwise.[3]
In response to this debate, our project attempts to lend yet another perspective by building a model for quantifying net CO2 emissions from wildfire under three scenarios: suppression, prescribed fire, and thinning. We apply this model to each county in California with the simultaneous intention of providing information to state agencies looking to distribute forest management funding or county governments looking to adopt climate action and/or wildfire preparedness plans. Both of these entities could use the information provided in our product--an interactive web map--to obtain a ballpark idea of what counties have the greatest wildfire emissions reductions potential, what that potential is, and what it could cost in the context of other emissions reductions measures. In this way, our research can add analysis to the debate over the net CO2 impacts of these various forest management practices while also providing a potentially useful tool for entities with the inclination and resources to implement these practices.
Methodology
Through an extensive literature review, we have estimated the available carbon fuel content of forest biomass in California and combustion emissions in different forest management scenarios. Using the below formula, we calculated the average carbon emissions per year for each county due to wildland fires:
forested area (km2) × average available burnable biomass carbon density (tonnes C/km^2) × (tonnes CO2/tonnes C released upon combustion) × % of available biomass consumed from wildfire given the area’s prior forest management treatment × forest density correction factor (%) × natural fire return interval (fires/year)
Estimates of each variable in our equation are research-based. Our web-based app includes an "Appendix" tab, which links to our methodology document, detailing our assumptions, calculations and the literature that supports our choices.
To visualize our data, we used R Shiny to create an interactive web app allowing for users to adjust forest management scenarios. Our choropleth map, built through Mapbox and Leaflet, highlights the total carbon emissions per year in 100% suppression, 100% prescribed burning, and 100% thinning scenarios. Our app also includes a section for users to be able to adjust suppression, thinning, and burning percentages for specific counties and understand the carbon emission reductions and costs associated with these values.
Reflection
Our project has been redeveloped and redesigned many times due to various challenges and a greater understanding of our research goals. While we feel that our work contributes to current literature surrounding forest management and wildfire risk, we recognize its limitations as well as its potential to be developed into a more robust analysis of carbon emissions.
Challenges
One of the main challenges to our project was, unsurprisingly, data. Because we did not have clean data for the all of the various variables in our equation, we often calculated these individual variables from estimates based off of our research. Specific limitations of our data included:
- Estimates occasionally derived from very specific case studies under conditions that are not necessarily generalizable to California and its differing biomes.
- Computer memory resources, as more granular sources included hundreds of gigabytes of data that our computers could not support. An area which we would have liked to explore further was LANDFIRE Vegetation data, which includes granular geospatial data regarding vegetation types and carbon content throughout California.
An additional challenge was learning how to construct and deploy a web app that allowed for the functionality we desired. Throughout this process, we switched from JavaScript to Python to R, reiterating our dashboard and map and evaluating which features are most important to us. Ultimately, we used R for all data wrangling, cleaning, visualization, and web app deployment.
And finally, largely due to time constraints, we have yet to incorporate the emissions produced from the actual prescribed burning and thinning itself which will cut into the emissions reductions from both practices when compared to suppression.
Learning
Our deep-dive into the world of forest management and carbon emissions has allowed us to better understand the complexities of reducing wildfire risk. There is no general consensus on the role of suppression, prescribed burning, and thinning in greenhouse gas management, and we feel that this is an area that needs to be expanded upon. One key insight our project has taught us is that this field is quite data-limited, which prevents decision-makers from being able to make the most well-informed, strategic forest management choices possible. We hope that our tool can lay a foundation upon which future work in this field can build.
Future Work
As mentioned in Challenges, the literature existing around this topic is often patchwork, and a more collaborative and synchronized approach to future research amongst academic, governmental, and professional players in the field could help more smoothly facilitate more accurate analyses of how various forest management practices affect net emissions as well as numerous related questions. Throughout our analysis, we needed to make many, sometimes tenuous, assumptions but have explicitly included our process for transparency- hoping that future researchers could build upon this base, as more research is produced on this topic.
Our tool ultimately provides ballpark estimates, but could greatly benefit from data allowing us to incorporate more specifics of each county's forests and vegetation. We are excited about possible expansions to this project such as improving certain assumptions made, extending the scope of emissions included by incorporating tree mortality and associated carbon sequestration as well as extending our model beyond just forests to shrubland management and other biomes, and what we see as the most necessary next step towards improving the value of this tool: including emissions produced from thinning and prescribed burns. With further work and research, this too has the potential to guide county governments and state agencies to not only reduce wildfire risk but reduce carbon emissions towards state goals.
Thank You
Thank you to everyone affiliated with the Big Earth Hackathon Wildland Fire Challenge course- our fellow classmates, our professors, TA, and the countless number of speakers who taught workshops, took the time to highlight different issues surrounding wildfires, and overall, inspire us. We couldn't have done it without you!
Bibliography
[1] “Yocom Kent et al. - 2015 - Interactions of Fuel Treatments, Wildfire Severity.Pdf.” Accessed May 31, 2020. https://www.fs.fed.us/rm/pubs_journals/2015/rmrs_2015_kent_l001.pdf.
[2] Collins, Brandon M., Jamie M. Lydersen, Richard G. Everett, and Scott L. Stephens. “How Does Forest Recovery Following Moderate-Severity Fire Influence Effects of Subsequent Wildfire in Mixed-Conifer Forests?” Fire Ecology 14, no. 2 (August 30, 2018): 3. https://doi.org/10.1186/s42408-018-0004-x.
[3] Ryan, Michael G, Mark E Harmon, Richard A Birdsey, Christian P Giardina, Linda S Heath, Richard A Houghton, Robert B Jackson, et al. “A Synthesis of the Science on Forests and Carbon for U.S. Forests,” 2010, 17.

Log in or sign up for Devpost to join the conversation.