-
-

Logo
-
-
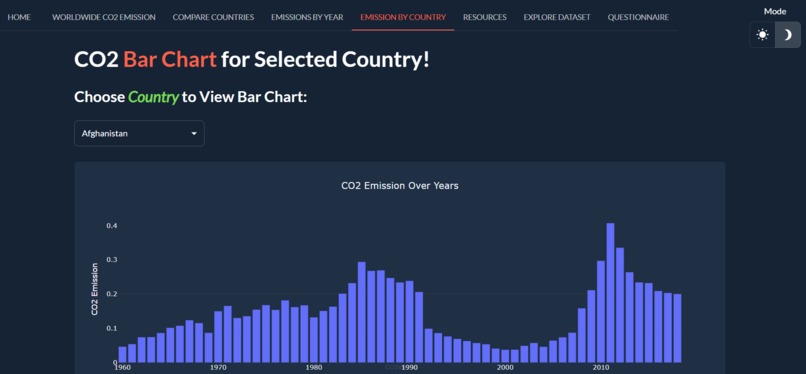
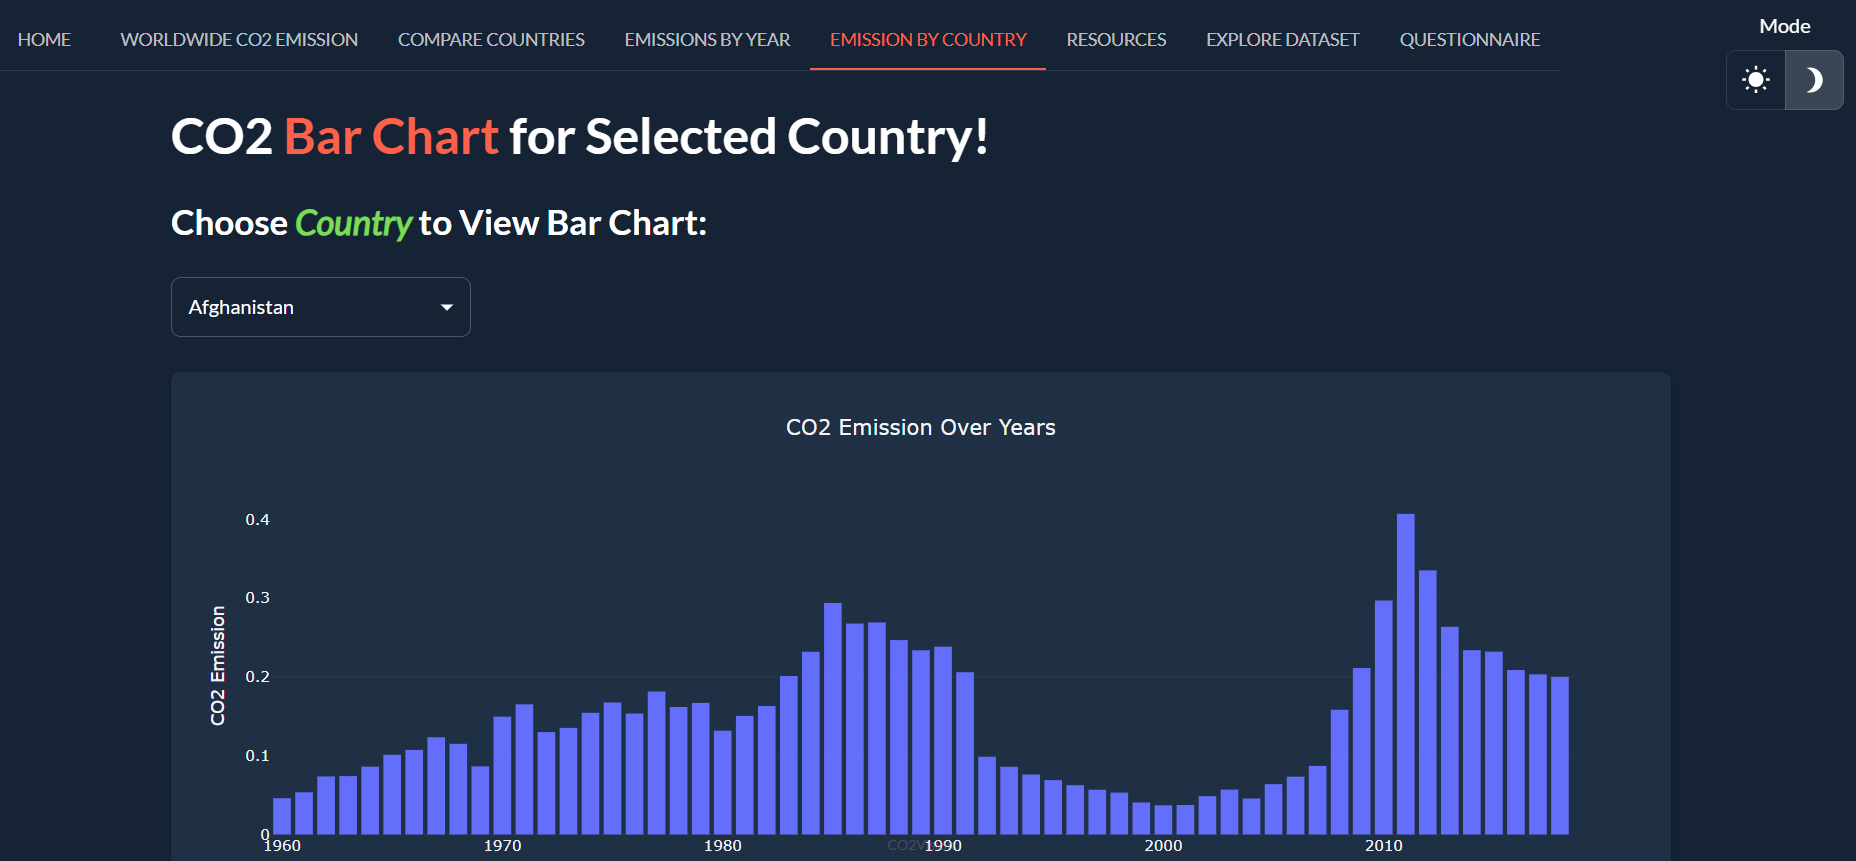
Bar chart country wise
-
-
Home page


Inspiration
I grew near an industrial area in Maharashtra, where the air was rarely clean, the case of metropolitan cities here. I kept wondering how the air must be in different countries. This is how the motif of CO2Vision was developed.
What it does
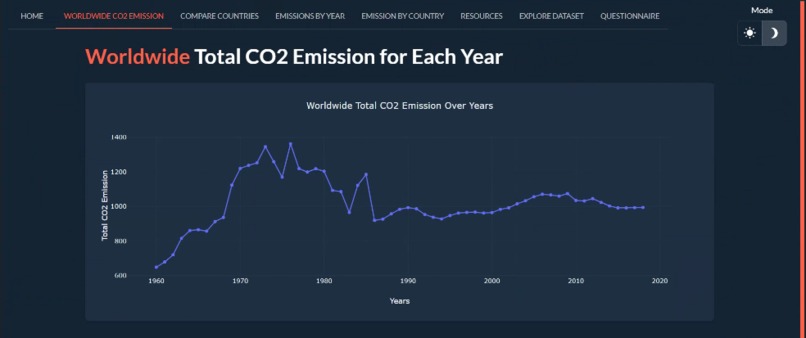
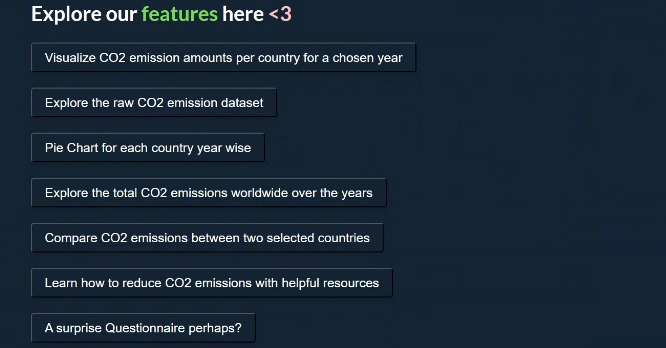
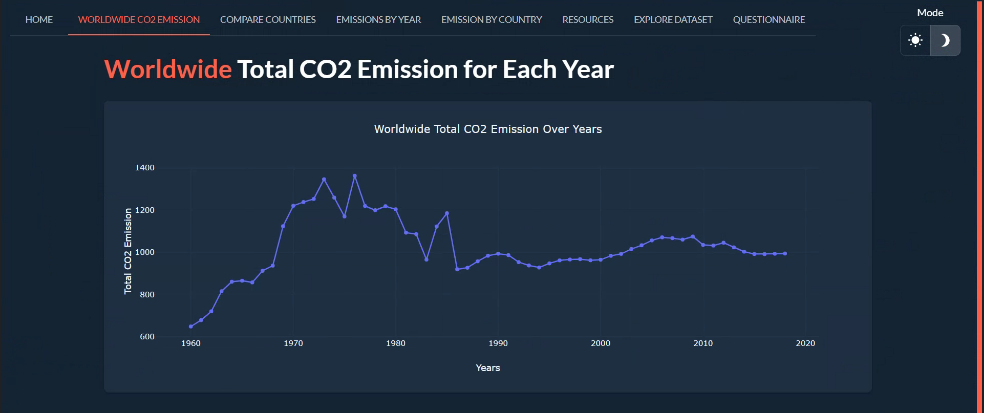
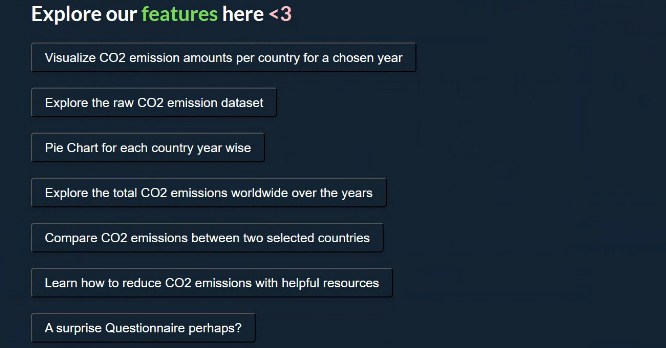
C02Vision visualizes the C02 emissions of 250 countries over the years, we could see clearly how the progress of each country is, and we can also compare the emissions between two countries with the help of beautiful visualizations.
How we built it
We built it using a Python framework for building web applications. We used Taipy components such as,
- Taipy
- Markdown
- Taipy-GUI
- Pandas
Challenges we ran into
- The main challenges we faced was the absence of data for some countries, this caused a lot of issues for us.
- The debugging process took longer than expected
What we learned
- We learnt how to use Taipy to create web apps in Python
- We learnt use Taipy components to create interactive visualizations
- Lastly, we learnt patience through the debugging process
What's next for C02Vision
C02Vision aims to contribute to a better air for a better tomorrow!!
Built With
- python
- taipy
- taipy-gui


Log in or sign up for Devpost to join the conversation.